
Abstract
The synthesis of carbon nanotubes (CNTs) by chemical vapor deposition (CVD) of isobutane (i-C4H10) over sodium-exchanged K10-montmorillonite based iron-catalysts is investigated. By studying the influence of iron-addition (5-25 wt%) on the catalyst performances, at 700 °C, an empirical relationship is derived relating the mass of CNTs synthesized with the exposed surface of loaded iron, as resulting from simultaneous change of number, size and dispersion of Fe-nanoparticles available for the growth.
1. Introduction
Laponite, clinoptilolite and montmorillonite are low-cost natural clay minerals. In the last years, they have been successfully utilized as catalyst support-materials for the production of CNTs, by CVD catalyzed by first-row transition metals [1–8], addressed to the development of binary hybrid nanocomposites to be used as polymer-additives for the improvement of the pristine polymer properties [2,9].
It has been recently demonstrated that iron loaded commercial montmorillonite (K10) behaves as a bi-functional catalyst in the CVD of i-C4H10 at 700 °C [7,8]. Hydrocarbon decomposition occurring over added metal sites preferentially leads to the formation of multi-walled carbon nanotubes (MWCNTs), while Brönsted acid sites of the support are responsible for the formation of other carbon nanostructures, such as carbon nanofibers and disordered graphite flakes. The decomposition of hydrocarbon has been, hence, selectively driven towards MWCNTs by lowering the activity of support, via Na+-exchange reaction or increase of catalyst reduction-temperature. Between the two different strategies the decrease of the support activity via Na+-exchange reaction allows obtaining, at given metal load, the highest amount of MWCNTs with improved crystalline quality [7,8]. Hybrid materials prepared by direct growth of MWCNTs over Fe-Na+/K10 catalysts outstandingly enhance electrical conductivity of the insulating polylactide [9].
This work deals with the synthesis of MWCNTs by iron-catalyzed CVD over Na+-exchanged K10-montmorillonite based catalysts. It is a continuation and a completion of the previous study on this topic [7,8]. The influence of iron-addition (5-25 wt%) on the catalyst performances is here investigated. Formerly studied un-exchanged K10- based catalysts are also considered and an empirical law is proposed to describe the growth of MWCNTs over added iron sites of both Fe/K10 and Fe/Na+-K10 catalysts.
2. Experimental
2.1 Catalysts
2.1.1 Samples considered
A set of five catalysts, based on sodium-exchanged K10-montmorillonite, was prepared and characterized, as illustrated below. Besides, an additional set of three catalysts, based on un-exchanged commercial K10 clay, was considered. Their codes and specifics, as resulting from previous studies [7,8], are reported in Tab. 1.
2.1.2 Preparation
Sodium-exchanged K10 montmorillonite was obtained by dispersing 10 g of as-purchased Aldrich K10 montmorillonite (size: 5-10 μm) in 300 ml of water. Clay was allowed to swell by continuous stirring for about 6 h. Then, water was replaced with 1 M solution of NaCl to enable the ion-exchange reaction.
As-obtained Na+-K10 montmorillonite was used to prepare Fe-loaded catalysts. For this purpose, 5 g of unloaded Na+-K10 clay was impregnated with 8 ml of an aqueous solution of Fe(NO3)3·9H2O (Fluka, 99.9%) having an amount of iron salt suitably calculated to obtain the desired extra Fe-load (wL = 5.0-25.0 wt%). Their codes, overall Fe-content (wFe) and specifics are reported in Tab. 1.
2.1.3 Characterization
NKwL catalysts were slowly dried at 80 °C and calcined at 450 °C in air to get iron oxide from its precursor. Solids were well ground to powder and reduced for 2 h upon 120 cc/min 1:1 H2+He flow at 500 °C (TR). The same route was previously followed to reduce KwL catalysts at 700 °C.
The specific surface area of reduced catalysts was determined by Brunauer-Emmett-Teller (BET) method using a Q-SURF Series Surface area analyzer. After out-gassing the sample at 200 °C for 2 h nitrogen was adsorbed at −196 °C.
The phases present after reduction were investigated by performing x-ray diffraction (XRD) measurements. XRD data were collected with an APD 2000 Ital Structures diffractometer using CuKα radiation source. The patterns were recorded in step scan mode (step: 0.02 °) in the range 10-70 ° of 2-theta angles. Counting time was 1 sec/step.
2.2 Carbonaceous deposits
2.2.1 Synthesis and yield evaluation
CVD growth reactions were carried out in i-C4H10+H2 atmosphere at 700 °C. The reduced catalyst (0.5 g) was placed in a quartz boat inside the quartz reactor, located in a horizontal electric furnace, and preliminarily heated upon 120 cc/min 1:1 He+H2 flow up to synthesis temperature. Then helium was replaced with isobutane keeping constant flow ratio and total flow rate. After 2 h the reaction was stopped. The raw products were cooled down to room temperature (RT) in He atmosphere and weighed (0.1 mg balance sensitivity) for yield evaluation.
The mass of deposited carbon (mC = mT-mR) was estimated subtracting the mass (mR) of reduced catalyst employed from the mass (mT) of materials (reaction products+catalyst) discharged from the reactor at the end of each synthesis. Two trials were carried for each parameter setting. Yield

and specific yield

Codes, reduction temperature (TR) and specifics of all the considered catalysts. Catalyst codes, NKwL and KwL, summarize information concerning the type of clay (NK and K stand for Na+-exchanged and un-exchanged K10 clay, respectively) and iron extra-load (wL = 5.0-25.0 wt%). NK0 and K0 denote unloaded catalysts. The overall metal content (wFe) is the sum of iron already contained in NK0 (1.7 wt%) and K0 (2.0 wt%) and iron added by impregnation. dFe and ABET denote mean size of Fe-particles and measured specific surface area of the overall catalysts (inclusive of metal and clay-support). A star marks cases in which Fe0 is not detected in XRD patterns. Mean catalytic yields (YC) and specific yields (SYC) are also reported, as well as calculated dispersion (D) and specific surface area of iron (AFe).

of the catalytic process were calculated by normalizing mC to the mass (mR) of the whole catalyst (clay-support included) [7,8,10,11] and to the mass (mFe) of its sole active-component. Mean values obtained are reported in Tab. 1.
2.2.2 Purification and characterization
Support and iron particles were subsequently removed by refluxing products obtained from reactions in a mixture of 12% HCl and 12% HF acids. After purification carbonaceous deposits (below coded as the catalyst used for their synthesis) were washed thoroughly with distilled water, dried at 110 °C for 3 h and finally analyzed.
The process selectivity was evaluated by means of scanning electron microscopy (SEM) using JEOL JSM-5600LV operating at 20 kV. Morphology, dimensions and crystalline structure of the MWCNTs synthesized were investigated by transmission electron microscopy (TEM) using JEOL JEM-2010, equipped with a Gatan 794 Multi-Scan CCD camera and operating at 200 kV. Several different SEM and TEM images with diverse magnification factors per specimen were recorded to have a reliable picture of the samples.
Their crystalline quality was evaluated by measuring Raman scattering excited by the 514.5nm (2.41 eV) line of a Coherent Innova 70 Ar+ laser. The analysis was carried out in air at RT. Spectra were recorded in the 800-3350 cm−1 spectral range by using a Jobin Yvon Ramanor U-1000 double monochromator, equipped with an Olympus BX40 microscope (X50 objective) and a Hamamatsu R943-02 photomultiplier operating in photon-counting mode. The use of a low laser-power (3 mW at the sample surface) prevented annealing effects. In order to reliably describe the sample bulk, several different locations of each specimen were sampled on account of the possible structural non-homogeneity. A 30 s long acquisition time was used to improve the S/N ratio. Spectra were normalized, averaged and finally reproduced by Lorentzian bands after constant background subtraction.
The Fe-impurity content and thermal stability of carbonaceous deposits were investigated by means of thermo-gravimetry (TG) using TA Instruments SDTQ 600 (0.1 μg balance sensitivity) and differential thermo-gravimetry (DTG). For this purpose, 2-3 mg of each sample were analyzed. Each specimen, placed in a platinum pan, was firstly kept at 200 °C in inert environment (argon) until balance stabilization and subsequently burned upon 100 cc/min pure-oxygen flow. The temperature range of 200-1000 °C was explored at 1 °C/min scan rate. A multipoint calibration was preliminarily carried out by means of metallic standards of very high purity.
Further technical details, concerning measurements performed and instrumentation utilized, can be found elsewhere [7,8,10–12].
3. Results
Figure 1 displays the XRD patterns of reduced catalysts with higher Fe-loads. The mean size of Fe-nanoparticles (dFe) is estimated via the Scherrer equation from the peak of metallic iron at 2-theta = 44.7°. The results obtained are reported in Tab. 1 together with the overall specific surface area (ABET) of the catalysts evaluated by BET method.

XRD patterns of Fe-loaded Na+-K10 catalysts with higher Fe-loads. Symbols: (•) montmorillonite, (*) muscovite, (▪) quartz and (◯) metallic iron.
Figures 2–5 show the results of the analyses performed on reaction products after purification. Figure 2 displays SEM micrographs of deposits obtained over Fe-loaded catalysts, while some TEM images are shown in Fig. 3. Results of TEM observations are summarized in Tab. 2.

Selectivity towards nanotubes as monitored by SEM.
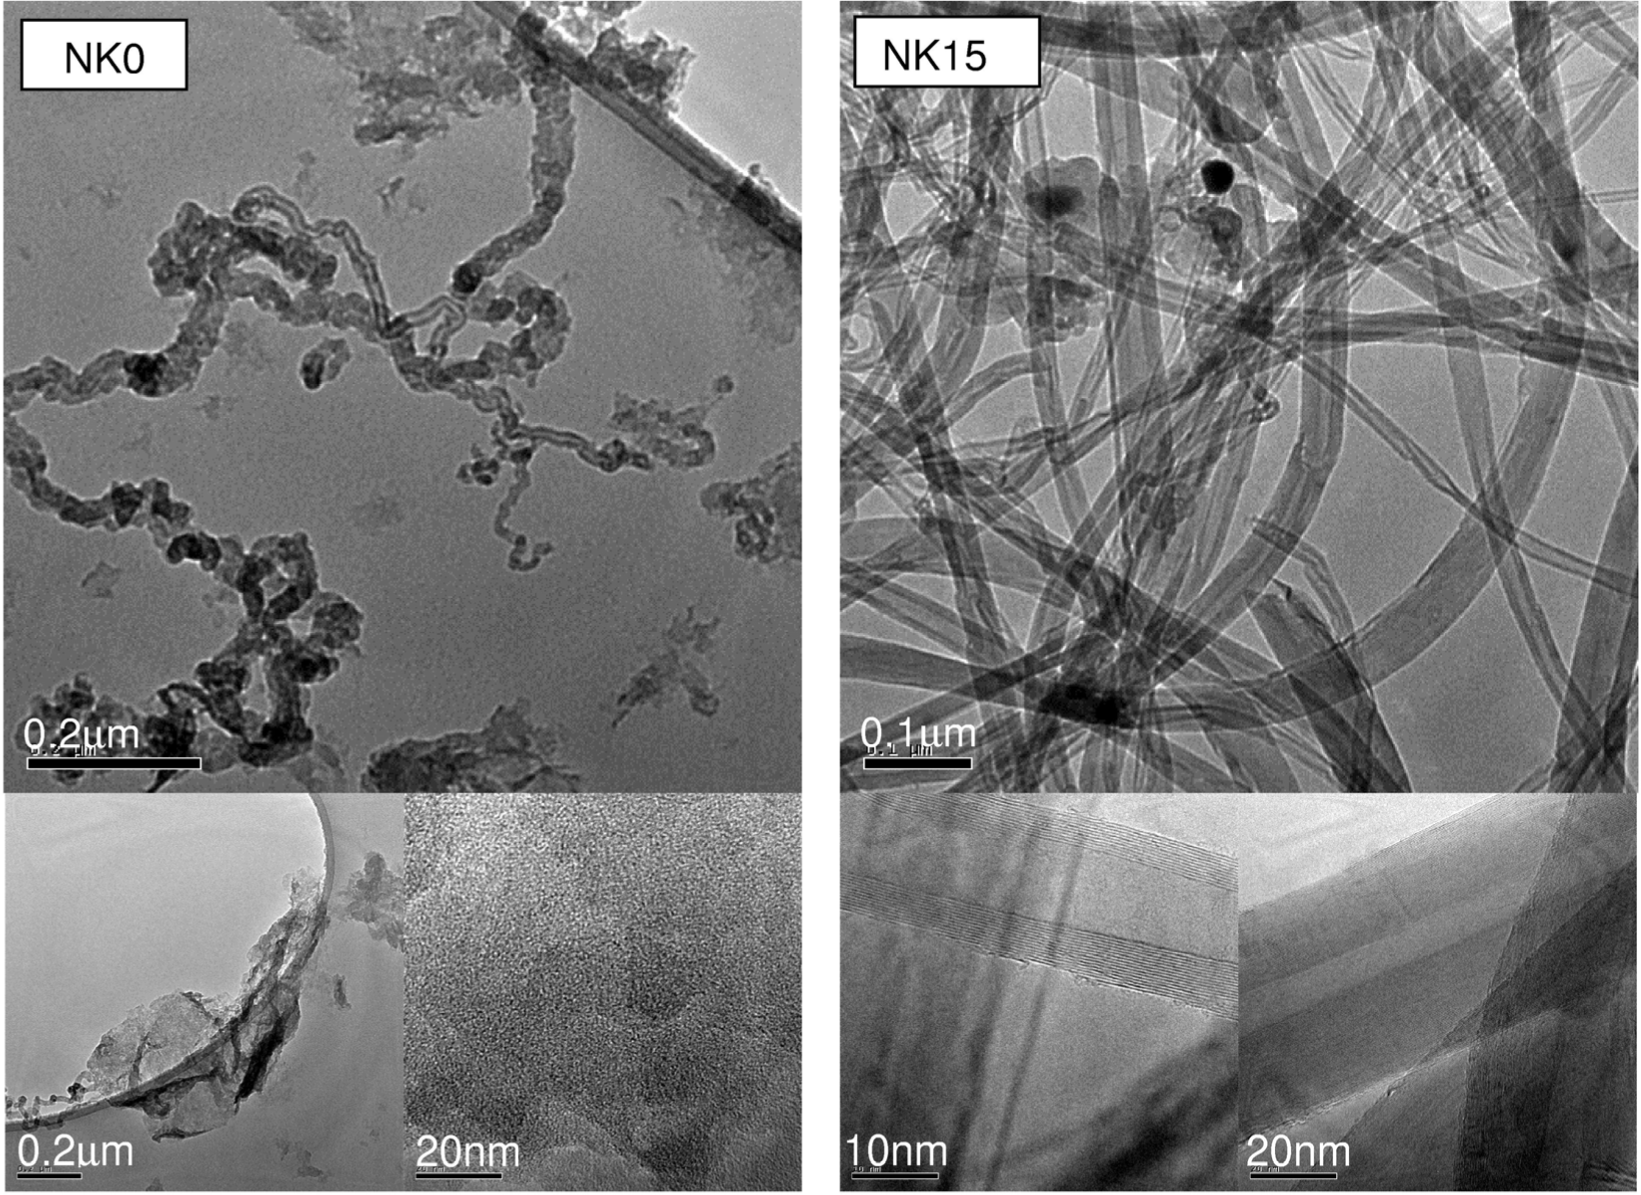
TEM micrographs of carbonaceous deposits synthesized over unloaded (NK0) and Fe-loaded Na+-K10 catalysts (the case of 15 wt% Fe-load is shown). Only nanofibers and disordered graphite flakes form on NK0.

Results of (a) TG and (b) DTG analyses on purified C deposits.

Results of MRS analysis on purified C deposits. Spectra are normalized to the D-band maximum intensity.
Figures 4(a) and 4(b) display thermo-grams and differential mass-loss profiles. The relative amount of non-burnt matter at the end of each TG measurement [11] represents the content of Fe-impurities (wI), while the maximum oxidation-rate temperature (TP) in DTG profiles gives a measure of the thermal stability. The values of wI and TP obtained are reported in Tab. 2.
Figure 5 displays the shape evolution of the micro-Raman spectra. The main spectral features detected in all the samples investigated are the G-band at 1580 cm−1 (graphite-like in-plane optical mode associated to the stretching of all C=C pairs), the D-band at 1350 cm−1 (forbidden in perfect graphite and rendered Raman-active by any kind of lattice defects relaxing the selection rules through the breaking of the basic symmetry of graphene-layers) and the G'-band at 2700 cm−1 (overtone of the D-band, Raman-allowed and defect-independent) [12–15].
The G'/D integrated intensity ratio (IG'/ID) gives a measure of the relative amount of the defect-free to ill-organized graphitic sheets and, hence, monitors the average crystalline quality (aromaticity) of the carbonaceous lattice [8,10,12,15]. The values obtained from the spectra-decomposition are reported in Tab. 2.
The G/D integrated intensity ratio (IG/ID) is currently used to estimate the average size of crystallites (LC) in all graphitic samples through empirical laws [16–19]. Recently, the relationship LC = 560·(IG/ID)·EL−4, where EL is the laser visible excitation energy (2.41 eV, in present case) has been proposed for the estimation of LC in nanotubes and nanographites [18,19]. The values of LC obtained by the use of this formula are reported in Tab. 2. Smaller LC values (3.9-8.5 nm) are attained by the use of the relationship LC = 4.4·(IG/ID), widely used in the past [16,17].
4. Discussion
4.1 Catalysts
The diffraction peaks of Na+-K10-montmorillonite clay [8] are detected in all the catalysts (Fig. 1). Structural analysis further reveals the presence of muscovite and quartz as clay's impurities. The peak of Fe0 is not detected in NK0 and NK5 catalysts [8], likely due to the insufficient amount of iron and/or to the smaller particle size. Instead, in the remaining catalysts (Fig. 1) its intensity progressively increases with the amount of metal loaded.
Also dFe slowly increases with Fe-load (Tab. 1), causing also dispersion and exposed surface of the metal to vary. Fe dispersion, namely the molar fraction of exposed iron, is calculated, assuming a spherical particle approximation, as [20]
Results of TEM, TG, DTG and MRS analyses carried out on purified reaction products. wI is the relative amount of Fe-impurities present in C deposits. TP is peak temperature of DTG profiles giving a measure of thermal stability. The G'/D intensity ratio (IG'/ID) monitors crystalline quality. The G/D intensity ratio (IG/ID) allows estimating the average size (LC) of graphitic crystallites (the values calculated following both refs. [18,19] (a) and refs. [16,17] (b) are reported).


where dFe is the mean metal particle size calculated via the Scherrer equation, dVA=6τM/aM is the volume-area mean diameter, aM = 6.13×10⁻²⁰ m2 is the effective average area occupied by a metal atom in the surface [20] and τM=1.18×10⁻²⁹m3 is the volume per metal atom in the bulk, calculated as w/(NA·ρ), with NA=6.023×10²³/mol standing for the Avogadro's number, w=55.845 a.m.u. denoting the atomic weight of iron and ρ=7.86×10⁶ g/m3 being the mass density of bulk iron.
By this procedure, D is found to decrease from 5.2×10⁻² to 4.2×10⁻² going from sample NK15 to NK25 (Tab.1). The same calculation is applied to the formerly studied un-exchanged K10-catalysts reduced at 700 ×C. Lower D values (Tab. 1) are obtained for catalysts K5 and K15, based on dFe data inferred from previous XRD measurements [8]. Specific surface area

(where nFe is the overall number of moles of added iron per gram of catalyst) and surface area

of the exposed iron are found to slightly increase, respectively from 5.1 m2/g to 6.9 m2/g (Tab.1) and from 2.6 m2/g to 3.5 m2/g, going from sample NK15 to NK25 (Tab. 1). Smaller AFe (Tab. 1) and SFe values are obtained for catalysts K5 and K15.
It is worthwhile noting that in all the cases the calculated specific surface area of the metal is always much smaller than the overall specific surface area, ABET, of the catalysts (Tab. 1), demonstrating that iron does not completely cover the clay surface, either at higher loads.
4.2 Carbon deposits
TEM analysis had previously evidenced [7,8] that only carbon nanofibers (CNFs) and disordered graphite flakes (DGFs) form on the unloaded clay. Present study (Fig. 3) reveals that MWCNTs are, instead, obtained over all the Fe-loaded catalysts, regardless their load. SEM analysis (Fig. 2) evidences no substantial change in their morphology, but increased entanglement of the tubes and less uniform and larger diameters, in accord with the increase of dFe [21,22].
Disordered carbon nanostructures formed over NK0 are here found to contain the highest amount of Fe-impurities (wI = 17 wt%). In addition, as lattice defects act as initial oxidation sites [23], they also possess the lowest thermal stability (TP = 475 °C).
Among MWCNTs, the highest oxidative resistance (TP = 536 °C) pertains to sample NK15, where TEM analysis reveals the presence of straight and smooth tubes consisting of regular sequence of perfectly ordered graphitic layers (Fig. 3). Very intense G- and G'-bands dominate the Raman spectrum of this sample (Fig. 5), whose crystalline quality (IG'/ID = 2.43) largely exceeds that of remaining samples (Tab. 2), as well as that of MWCNTs reported as the best crystallized ever obtained over clay-based catalysts [5,7]. The high crystalline perfection of MWCNTs NK15 is proved also by the size of crystallites (32 nm), larger by a factor of 1.5-2.0 than in remaining NKwL samples (Tab. 2).
Recent studies have then demonstrated that, thanks to the high graphization-degree of these MWCNTs, the incorporation of small amounts (1-5 wt%) of hybrid NK15 (MWCNTs + clay) within an insulating polymeric matrix outstandingly enhances its electrical conductivity (up to 9 orders of magnitude) with respect to the pristine polymer [9].
4.3 Growth process over clay-based catalysts
As shown in Tab. 1, at lower loads, YC rapidly increases with Fe addition. The maximum value (∼2.2 grams of deposited carbon per gram of catalyst) is reached for wL = 20 wt%. Above this load YC decreases, in spite the larger amount of iron. This is because SYC progressively drops above wL = 15 wt%, load for which the largest amount (∼12 grams) of carbon per gram of iron is produced.
As initially mentioned, previous studies demonstrated that lowering the acidity of the clay support, via Na+ exchange reaction or reduction-temperature enhancement, inhibits the formation of highly disordered carbonaceous nanostructures, responsible for metal deactivation at small iron loads (wL = 5 wt%), producing beneficial effects on yield [7].
For wL≤15 wt%, YC was shown to effectively increase exponentially with the product wFe·ABET in un-exchanged K10 catalysts reduced at 700 °C [7], as well as in Na+-exchanged K10 catalysts reduced at lower temperature (500 °C) as in present study. A saturating trend is here observed at higher loads [Fig. 6(a)].

(a) Comparison between plots of YC vs. the product wFe·ABET and of mC vs. SFe for Na+-K10 catalysts (present study) and K10 catalysts [7] reduced at different temperature (arrows indicate which axes the data refer to; length of error bars equals the difference between YC values obtained in the two trials). The dependence of (b) ABET and (c) SYC on dFe is also shown.
The same trend is observed when mC is plotted against the exposed surface of loaded iron SFe [Fig. 6(a)]. Note that this regards exclusively samples (NK15-NK25 and K5-K15) for which dFe data are available. As a fixed amount of reduced catalyst is here used, based eq. (1.a), mC is proportional to YC. Therefore, the similarity between YC vs wFe·ABET and mC vs SFe trends hints at the existence of a linear relationship between SFe and wFe·ABET, as actually found. In fact, ABET is here found to coarsely scale as 1/dFe [Fig. 6(b)]. For fixed mR=0.5 g, SFe is proportional to AFe [eq. (3.b)]. In turn, according to eq. (3.a), AFe ∞ D·nFe, where of course nFe ∞ wFe and, based on eq. (2), D ∞ 1/dFe just alike ABET.
Both these findings deserve a detailed and attentive discussion in order to avoid drawing erroneous conclusions.
An important consequence of the existence of the effective dependence of YC on wFe·ABET is that, in KwL catalysts reduced at 700 °C, a higher wFe may compensate for a lower ABET to finally give the same (or comparable) wFe·ABET product as in NKwL catalysts reduced at 500 °C, hence resulting in the same (or comparable) YC. This is immediately evident by considering the values of wFe, ABET and YC relative to samples NK5 and K15 reported in Tab. 1 and/or by comparing the corresponding data in Fig. 6(a). As can be seen, as strictly concerns catalytic yield, in spite of different wFe and TR (and resulting nFe and dFe) the two catalysts behave similarly.
As for the found dependence of mC on SFe, it can be argued that, for catalysts NK15-NK25 and K5-K15, the amount of produced carbon is ultimately determined exclusively by the exposed surface of added iron, as evaluated [through eqs. (3.a) and (3.b)] on the basis of merely geometric factors (dFe and resulting D) besides to, of course, the iron content (nFe) and the catalyst amount (mR).
This is not a surprising result because all measured dFe values largely exceed 10 nm (Tab. 1), value above which the relative amount of the diverse types of iron atoms (saturated ones, present in the crystal face, and unsaturated ones, present at edges, corners and terraces), endowed with different catalytic activity, hardly changes with size [20].
Based on the similar trends of the curves YC (WFe·ABET) and mC(SFe) [Fig. 6(a)], one might be brought to extend considerations made for NK15-NK25 and K5-K15 to the remaining samples. Indeed, the lack of information about dFe impedes any straight widening of the above discussion. In fact, for dFe < 10 nm, also the different catalytic activity and relative amount of the diverse types of iron atoms should be taken into account.
By fitting 10 available experimental data, it is found that the mass mC of nanotubes, synthesized at 700 °C upon (120 cc/min) 1:1 i-C4H10+H2 flow over (0.5 g) Na+-K10 and K10 iron catalysts, increases with the exposed surface of loaded iron SFe according to the relationship

Although the choice of the function to be utilized to reproduce mC data of Fig. 6(a) is to some extent arbitrary, that here used is theoretically inferred from the simple physical model below.
To this purpose, it is worthwhile noting that, far from establishing a general model of the growth process, the discussion below aims exclusively at accounting for the changes of mC with SFe observed in the samples under study.
Therefore, a stringent simplifying assumption is introduced, consisting in attributing the same active surface to both the kinds of unloaded catalysts (Na+-exchanged K10 reduced at 500 °C and un-exchanged K10 reduced at 700 °C).
The main reason for this choice is that very large errors affect lower YC and mC values (relative error is well above 75 % in case of K0 catalyst), which renders them hardly distinguishable, at least as concerns the present aim of reproducing the changes of mC with SFe.
Actually, unloaded catalysts exhibit comparable iron contents (Tab. 1), but the diverse TR might introduce a relevant size-difference. However, the very small reduction of the pristine iron content (δwFe =−0.3 wt%, Tab. 1), produced by the ion exchange reaction with a NaCl solution, suggests that Fe cation is not in an exchangeable position, but it is mainly present as a structural ion and/or as iron oxide formed from the dissolution of octahedral iron sites upon acid treatment [8]. This hints at a strong iron/support interaction, which likely hampers, or at least severely limits, possible sintering effects and size-variations at higher TR. Indeed, ABET, which, as shown [Fig. 6(b)], is sensitive to the changes of dFe, exhibits quite similar values in the two unloaded catalysts (Tab. 1).
Thus, indicated with S0 the active surface in unloaded catalysts and with SFe the surface increase brought about by iron addition, let S = S0+SFe be the overall iron exposed-surface and mC the mass of carbon correspondingly synthesized.
Because of the low fraction of supplied carbon that is transformed to carbon deposits (maximum: 6.8 wt% after 2 h of reaction for wL = 20 wt%), the incident C flux does not suffer significant impoverishment owing to the formation of carbonaceous products. Thus, in principle, it should be expected that the increase of S with wL would produce a linear increase of mC. Nonetheless, it has to be borne in mind that the increase of S with wL is the result of the simultaneous variation of manifold influential factors (amount, size and related dispersion of Fe-nanoparticles, possibly involving also textural effects) and that an optimal size-range relative to C supply [24,25] does exist, as demonstrated by the dependence of SYC on dFe shown in Fig. 6(c).
Based on all these factors, a non-linear dependence of mC on S can be reasonably hypothesized.
Therefore, if the variation, dmC, undergone by mC for an increment of the effective-variable d(Sα), is taken as proportional, according to the simplest possibility, besides to d(Sα), to the residual “distance” (mCmax-mC) from the largest mass amount, mCmax =1.09±0.04 g (where the error is evaluated considering the different YC values obtained in the two trials carried out upon fixed conditions), which is produced under the considered growth conditions, namely

by setting X = mCmax-mC, the differential equation dX = -a·X·d(Sα) is obtained that can be solved in terms of X to give

This finally becomes

where S* is a critical S value. This expression, besides accounting for the positive curvature of the mC(SFe) curve at small SFe (Fig. 3), is also able to reproduce the negative curvature and saturating trend at larger SFe. As the experimental data are fitted to this function, A = 1.07 ± 0.02 g, S0 = 5.50±0.04 m2, S* = 7.74±0.04 m2 and α=12.9±0.6 are found, leading to eq. (4) and validating the quite simple assumptions made. Empirical law (4) describes how the amount of grown MWCNTs increases with the overall exposed surface of iron, and includes the effect of the simultaneous variation of number, size and dispersion of Fe-nanoparticles available for their growth, as well as of the existence of an optimal size-range relative to C supply [24,25].
In case of mono-dispersed iron (namely, D=1), eq. (2) gives dFe = dVA = 1.2 nm that is the diameter of “only-surface-atom cluster” containing ca 100 atoms [20]. Interestingly, assuming that in the unloaded catalyst iron is nearly mono-dispersed (D≤1) and accordingly using dFe≥dVA as mean Fe-nanoparticle size value to calculate specific surface area of the exposed iron, from eq. (3.a) AFe≤11.24 m2/g is obtained. According to eq. (3.b), being mR=0.5 g, this corresponds to S0≤5.62 m2, value which is fairly compatible with the one (5.50 m2) derived from the fitting procedure.
Also the large value of the exponent α (12.9) needs a brief comment. Combining eqs. (1.a) and (1.b) catalytic yield can be written as YC = wFe·SYC/100, so as mC = wFe·SYC·mR. Thus, the observed (non linear) dependence of mC on SFe [i.e. eq. (4)] is through wFe and SYC. Different from wFe, whose changes cause a smooth variation of dFe (22.4-27.6 nm at 500 °C and 32.0-45 nm at 700 °C) and, hence, of SFe, SYC is strongly sensitive to the changes of dFe and drastically declines at larger dFe [Fig. 6(c)].
5. Conclusion
The growth of MWCNTs by isobutane decomposition at 700 °C is considered. The influence of iron-addition (0-25 wt%) on the performances of Na+-K10 based catalysts is investigated. For this purpose, XRD and BET measurements on reduced catalysts and SEM, TEM, TG and MRS analyses on purified carbon deposits are carried out.
The comparison of present results with those formerly obtained by the use of Fe/K10 catalysts allows clarifying the physical meaning of the previously found effective dependence of yield YC on the product, wFe·ABET, of overall iron-content wFe times overall specific surface area ABET of the catalysts. The empirical law reflects the increase in the amount of grown MWCNTs produced by that of the exposed surface of iron, as a purely geometric effect, and includes the effect of the simultaneous variation of number, size and dispersion of Fe-nanoparticles available for their growth, as well as of the existence of an optimal size-range relative to the fixed C supply.