
Abstract
Mapping of Brain Activity by Automated Volume Analysis of Immediate Early Genes
Renier N, Adams EL, Kirst C, Wu Z, Azevedo R, Kohl J, Autry AE, Kadiri L, Venkataraju KU, Zhou Y, Wang VX, Tang CY, Olsen O, Dulac C, Osten P, Tessier-Lavigne M. Cell 2016;165:1789–1802. doi: 10.1016/j.cell.2016.05.007.
Understanding how neural information is processed in physiological and pathological states would benefit from precise detection, localization, and quantification of the activity of all neurons across the entire brain, which has not, to date, been achieved in the mammalian brain. We introduce a pipeline for high-speed acquisition of brain activity at cellular resolution through profiling immediate early gene expression using immunostaining and light-sheet fluorescence imaging, followed by automated mapping and analysis of activity by an open-source software program we term Clear-Map. We validate the pipeline first by analysis of brain regions activated in response to haloperidol. Next, we report new cortical regions downstream of whisker-evoked sensory processing during active exploration. Last, we combine activity mapping with axon tracing to uncover new brain regions differentially activated during parenting behavior. This pipeline is widely applicable to different experimental paradigms, including animal species for which transgenic activity reporters are not readily available.
Commentary
Imagine three different scenarios. One: Your rodent model of epilepsy is coming through the latent period and the first spontaneous seizure pops up. One hour after having the seizure recorded on video and EEG with techniques currently available, the entire brain is processed immunohistochemically for the presence of immediate early genes (IEG), and the images are compared to the brain atlas to determine site(s) of either seizure origin or control. Two: The experimental (epilepsy) condition you are studying is responsive to brain stimulation. You just need to determine the best set of the brain areas to be activated by the stimulation. Again, IEG immunohistochemistry in the whole brain can provide the answers. Three: In your epilepsy model mouse, the expression of epilepsy markers changes developmentally. Where and how? Immunohistochemistry for those markers done in the whole brain through postnatal development can be the solution.
Both basic and translational scientists repeatedly encounter all three scenarios (and many other similar ones). Standard techniques provide sufficient tools for their solution (1). However, investigation of the entire brain requires enormous labor cost of serial sectioning of the brain, immunohistochemical processing of individual brain sections (30–40 μm thick coronal sections of the 20 mm rat brain or 13 mm mouse brain). Then the resulting staining is captured using microscopy and registered in brain maps to determine the role of individual brain nuclei. While some standard techniques can be automated, there is still a lot of hand and eye work. Additionally, there are many limitations, such as both limited and uneven penetration of the antibodies to the tissue sections, rendering full quantitative evaluation close to impossible.
Now imagine there is no obstacle for antibodies to penetrate through the brain tissue and there is also no visibility limit (2), that is, we can see (using microscopy) through the brain (see the overview of clearing techniques [3]). Finally, let's assume that all the labor-intensive procedures in the scenarios are automated and, after few days of processing, the computers spit out quantified data registered per individual brain nuclei. What took months to years before and had limitations now takes weeks to months—and sounds like a dream to many of us.
The authors of this manuscript employed a sequence of techniques that remove most of the labor-intensive procedures and replace them with an automated precision approach. The groundwork for some techniques was laid earlier; however, many novel approaches were developed in this manuscript. So, how does this all work? Table 1 shows the flow of procedures following the condition (behavioral, pharmacological, other experimental, etc.).
Procedural Flow
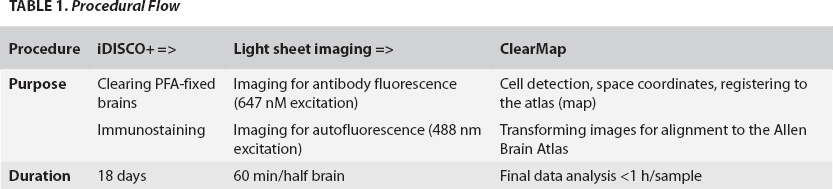
The authors previously developed the iDISCO/3DISCO technique for clearing the brain tissue (4). This original protocol is compatible with many antibodies (not only IEG) and also significantly increases their penetration through the tissue. The iDISCO-treated tissue is amazingly transparent for fluorophores in the far-red spectrum; hence, the antibodies should be tagged in this range. If blue-green spectrum (excitation at 480 nm) is used, intrinsic fluorescence of the brain (myelin in white matter, some nuclei and cortical areas) is evoked, which helps register the image into the atlas. However, the iDISCO protocol produces significant tissue shrinkage (up to 50% volume), severely impeding automated registration to the brain maps. Thus, the authors developed iDISCO+ with only 11% volume shrinkage for half brain and about 5% for the whole brain when compared to matched MRI scans acquired with a 9.4 T magnet. Thus, the new clearing protocol enables registration of the cleared samples to the serial two-photon tomography (current standard for automated whole-brain histological analysis of fluorescent markers [5]) reference mouse brain, which is aligned to the Allen Brain 25 μm Atlas.
Next, the authors optimized fluorescent microscopy imaging using continuous light sheet (6) for the voxel volume of 5 μm3 (~4 × 4 × 3 μm registered per pixel; imaging with 1.6× objective). This objective linked with camera with 10.4 mm sensor field length was able to reliably record single cell fluorescence over the field of 7 mm in length (entire mouse forebrain). At these parameters, one tile (visual field) covered half of the forebrain without olfactory bulbs, the data collection lasted 60 minutes, and the dataset occupied 20Gb. The authors also tested a newly developed 4x objective (LaVision Biotec, Bielefed, Germany) requiring 12 tiles of scanning over the brain (1.6 × 1.6 μm pixels) and requiring ~200Gb of data space per brain as well as 10× more time to complete.
Finally, and most importantly, the authors have developed ClearMap, an open source image processing software package. The purpose of this software is the automated detection of immunopositive (fluorescent) cells in 3D and registering their 3D coordinates in the reference atlas. The software includes several interfaces to other open source software packages (such as Elastix [7]) to remove (minimal) distortion of the brain due to iDISCO+ processing. Users can even create their own brain maps for use with ClearMap—a very useful feature for investigators working with developing brain!—using a Clear-Map interface to yet another software package. After cells are registered, they are counted, and the software builds density maps as well as performs final evaluation of the data.
The authors did not stop at the pure description but tested the system in three experimental conditions using IEG that were controlled by classic manual/visual approaches. First, they mapped brain activity induced pharmacologically by injection of haloperidol. ClearMap registered increases in activity in target regions of haloperidol, including internal globus pallidus, the caudate-putamen, and the nucleus accumbens. These results indicate that even the deepest structures in the samples were effectively labeled by the c-Fos antibodies. In the second approach, the authors monitored cortical activity in the barrel cortex during exploration in mice with either trimmed or spared whiskers. Here, the technique was able to detect reliably cortical fields of spare whiskers. Finally, the authors determined activity in the hypothalamic nuclei during parental behaviors and found significant male to female differences. Visual evaluation always confirmed data collected automatically.
The authors do not discuss limitations of the techniques. However, few technical issues (besides high initial costs) should be mentioned: How does photobleaching of deep layers affect cell counts in those deep brain areas? With the light sheet step size of 3 μm, how accurate is the computer registration of the cells close together in neighboring light sheets? Finally, the authors discuss use of other antibodies for iDISCO/3DISCO procedures, which may lead to an unconfirmed assumption that iDISCO+ can be also expanded to determine the expression of other than IEG-related proteins.
In summary, the authors have described a novel pipeline that can greatly assist in mapping neuronal activity in intact mouse brain for the discovery of novel brain regions activated by drugs, sensory inputs (or lack of thereof), and natural behaviors. In the experimental seizure field, perhaps the simplest application of this method would be to determine the involvement of brain regions in acutely induced PTZ seizures with reference back to the original, labor-intensive studies. (8–10).