
Abstract
Objective
To identify the significance of a support vector machine (SVM) model and a decision tree (DT) model for the diagnosis of lung cancer combined with the detection of fragile histidine triad (FHIT), RAS association domain family 1 (RASSF1A) and cyclin-dependent kinase inhibitor 2A (p16) promoter methylation levels and relative telomere length (RTL) of white blood cells from peripheral blood DNA.
Methods
The levels of p16, RASSF1A and FHIT promoter methylation and the RTL of white blood cells in peripheral blood DNA of 200 healthy individuals and 200 lung cancer patients were analyzed by SYBR Green-based quantitative methylation-specific PCR and quantitative PCR. Based on the 4 biomarkers, SVM and DT models were developed.
Results
The levels of FHIT, RASSF1A and p16 promoter methylation were 3.33 (1.86-6.40) and 2.85 (1.39-5.44) (p = 0.002); 27.62 (9.09-52.86) and 17.17 (3.86-50.87) (p = 0.038); and 0.59 (0.16-4.50) and 0.36 (0.06-4.00) (p = 0.008) in cases and controls, respectively. RTL was 0.93 ± 0.32 and 1.16 ± 0.57 (p<0.001). The areas under the receiver operating characteristic (ROC) curves of the Fisher discriminant analysis, SVM and DT models were 0.670 (0.569-0.761), 0.810 (0.719-0.882) and 0.810 (0.719-0.882), respectively.
Conclusions
The SVM and DT models for diagnosing lung cancer were successfully developed through the combined detection of p16, RASSF1A and FHIT promoter methylation and RTL, which provided useful tools for screening lung cancer.
Introduction
Lung cancer is the leading cause of cancer-related mortality in China (1). It is vital to find effective methods of early diagnosis of lung cancer as soon as possible. At present, diagnostic imaging, chemical analysis, cell and histocytological analysis are the most common methods to diagnose lung cancer, but these methods have different degrees of limitations.
A large number of studies have shown that there are molecular epigenetic changes, such as promoter methylation during the early stage of malignant tumor formation, which provide a new way for early cancer diagnosis (2). Many genes are indeed silenced in lung cancer by DNA methylation, including cyclin-dependent kinase inhibitor 2A (p16), RAS association domain family 1 (RASSF1A), and fragile histidine triad (FHIT) (3). We previously investigated their promoter methylation status changes in peripheral blood DNA of 200 lung cancer patients and 200 controls using SYBR Green-based quantitative methylation-specific PCR (qMSP). The results suggested that high methylation levels of p16, RASSF1A and FHIT were associated with a significantly increased risk of lung cancer (4).
The telomere is the end of a chromosome, which has a specialized structure involved in the replication and stability of chromosomes. Gene instability induced by telomere shortening caused by exogenous physical and chemical factors tends to occur at early stages of cell transformation (5). These results suggest telomere length changes could be useful biomarkers for the early diagnosis of lung cancer.
Joint detection of several tumor markers has been applied to improve the sensitivity and specificity in the diagnosis of lung cancer. However, there are still some problems regarding multiparameter testing, which cannot be efficiently analyzed by general statistical methods. Methods based on data mining appear to be suited for this task. Data mining techniques include genetic algorithms, support vector machines (SVMs), decision trees (DTs), neural networks, etc. Different methods may produce different results, and there may be certain application values after trying different methods with better models. Therefore, we adopted different data mining techniques for a diagnostic model of lung cancer in this study.
SVM is based on the principle of structural risk minimization and the theory of the Vapnik-Chervonenkis dimension, and has become the research field of machine learning because of its excellent performance. SVM has a solid theory foundation and concise mathematical model, and overcomes “dimension disaster”, so it has a distinct advantage in solving problems with features like a small sample size, nonlinear or high dimensional pattern type (6). DT is another kind of data mining method; it takes advantage of features of tree structure to deduce useful classification rules from a set of non-rule or unordered cases, and its greatest advantage is that of being intuitive (7).
Proper data mining models combined with some important molecular biomarkers will improve the accuracy, sensitivity and specificity of early diagnosis of lung cancer. The SVM and DT models both have their own advantages and drawbacks in actual practice. In this study, SVM and DT models were developed for the diagnosis of lung cancer based on 4 biomarkers: p16, RASSF1A and FHIT promoter methylation and relative telomere length (RTL). The information and rules hidden inside the data were comprehensively and intensively mined, and the predictive effect of each of these markers was compared with that of the others. By thorough analysis of the 2 methods, the significance of combined detection in the diagnosis of lung cancer could be explored.
Materials and methods
Study population
The study population consisted of 200 patients with histologically confirmed primary lung cancer and 200 healthy individuals without a history of cancer. The lung cancer patients, who had no previous history of other cancers or cancer-related treatments, were recruited consecutively from the First Affiliated Hospital of Zhengzhou University between January 2009 and May 2010. The controls were recruited during the same period from the individuals who visited the hospital for physical examinations. A detailed questionnaire, which included information on sex, age, smoking history, tumor stage and medical history, was completed for each participant by trained interviewers. Permission for sample collection for study purposes was obtained from the patients or their relatives.
Main instruments and reagents
The instruments and reagents used in the study included a PTC-200 PCR amplifier (MJ Research), a Stratagene Mx3000P real-time PCR system (Startagene), primers (Sangon Biotech), an EPS-350 electrophoresis apparatus (Pharmacia-LKB), and GoTaq qPCR Master Mix (Promega).
DNA extraction, qMSP assay and telomere length assay
Genomic DNA of peripheral blood was extracted using a blood DNA kit. Bisulfite-treated DNA was used as a template for qMSP and primers for qMSP analysis of p16, RASSF1A and FHIT were synthesized as previously reported (8). Calculation of the methylation level (rate) was described in a previous study (9). Real-time quantitative PCR was used for determination of relative telomere length; the primer sequences were: tel 1,5′-GGTTTTTGAGGGTGAGGGTGAGGGTGAGGGTGAGGGT-3′; tel 2, 5′-TCCCGACTATCCCTATCCCTATCCCTATCCCTATCCCTA-3′; 36B4u, 5′- CAGCAAGTGGGAAGGTGTAATCC-3′; 36B4d, 5′-CCC ATTCTATCATCAACGG GTACAA-3′.
Statistical analysis and model evaluation
All data were analyzed using SPSS Statistics v. 21.0. The measurement data had a Gaussian distribution and were expressed as means ± standard deviation, while other data showed a skewed distribution and were expressed as medians and interquartile range. The rank sum test or t-test was used to evaluate the differences between cancer cases and controls. Each contingency table was tested with the chi-square test. The significance level was set at 0.05.
This study assessed specificity, sensitivity, accuracy, negative predictive value (NPV), positive predictive value (PPV) and area under the ROC curve (AUC) to evaluate the models.
Establishment of models
Data preprocessing
Normalization of input data
The levels of p16, RASSF1A and FHIT gene promoter methylation did not follow a normal distribution, so normal transformation was needed. The levels of p16 and FHIT promoter methylation were normalized by common logarithm transformation (log10), and the level of RASSF1A promoter methylation was normalized using square root transformation.
Groups of training set and testing set
Based on previous experience, according to a ratio of 3:1, the normalized data of each group were separated randomly into a training set (150 controls, 150 cancer cases) and a testing set (50 controls, 50 cancer cases). The training set was used to develop the model, while the testing set was used to verify the model.
Model derivation
Fisher discriminant analysis
The parameter settings of Fisher discriminant analysis in SPSS Statistics 21.0 were a partitioned database environment as no, route as enter, pattern as high grade, gamma as 1, prior probability as all groups equal.
SVM model
The model was developed using the training set, then the samples of the testing set were used to validate the quality of the model. Telomere length, levels of FHIT, RASSF1A and p16 gene methylation, age and smoking history were taken as input items, while the groups (1 for lung cancer, 2 for normal controls) were taken as output items. On account of the nonlinear training samples, a nonlinear SVM algorithm was adopted. The SVM parameter settings were mode as expert, Kernel type as polynomial, stopping criteria as 1.0E-3, gamma as 1.
DT model
The DT model was chosen from C5.0 algorithms because of the running speed and accurate generated rules. The model was developed using the training set, then the samples of the testing set were used to validate the quality of the model. Telomere length, levels of FHIT, RASSF1A and p16 gene methylation, sex, age and smoking history were the input items, while the groups (1 for lung cancer, 0 for normal controls) were the output items. Following preliminary exploration, the DT parameter settings were output type as decision tree, partition as no, advance as yes, model as experts, interactive authentication as no, minimum numbers of each branch record as 2, building severity as 75, global clip as yes, error classification loss as no.
Results
Demographic characteristics of cancer patients and controls
Two hundred patients with lung cancer (mean age 59.56 ± 10.56 years; 143 men, 57 women; 107 smokers, 93 nonsmokers) and 200 controls (mean age 53.70 ± 13.34 years; 151 men, 49 women; 79 smokers, 121 nonsmokers) were enrolled. The lung cancer patients were well matched for sex with the healthy controls (p = 0.365). However, the average age and the number of smokers were significantly higher in the cancer group. The difference between smoking histories was also statistically significant (p = 0.005).
Comparison of p16, RASSF1A and FHIT methylation levels and RTL
There were statistically significant differences in the methylation levels of p16, RASSF1A and FHIT promoters between cancer cases and controls; likewise, there was a significant difference in RTL between cancer cases and controls (Tab. I).
Comparison of p16, RASSF1A and FHIT methylation levels (%) and RTL (
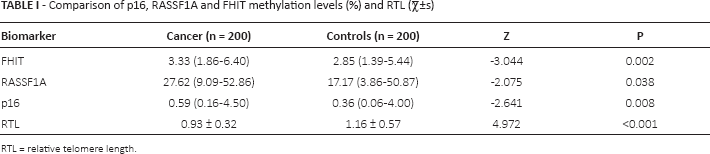
RTL = relative telomere length.
Effects of sex, age, smoking history, histological type and clinical stage on p16, RASSF1A and FHIT methylation levels and RTL
There were no significant correlations between p16, RASSF1A and FHIT methylation levels or RTL and sex, age, smoking history, histological type, or clinical stage.
Results of data mining to distinguish lung cancer
Table II presents the results of Fisher discriminant analysis, the SVM model and the DT model based on the methylation status of p16, RASSF1A and FHIT, and RTL. In the training set, the accuracies of Fisher discriminant analysis, SVM and DT were 69.3%, 89.3% and 98.7%, respectively. The accuracies in the testing set were 67.0%, 81.0% and 81.0%, respectively.
Effect of data mining to distinguish lung cancer
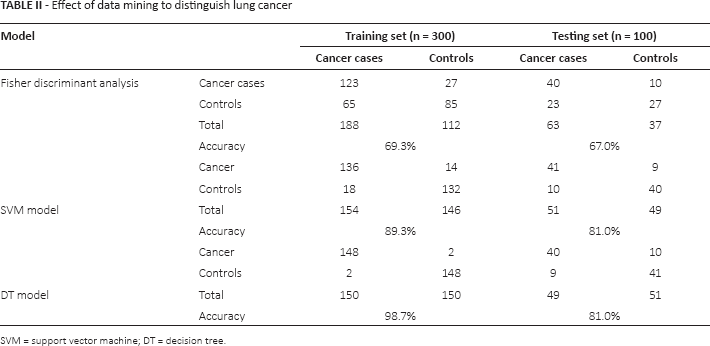
SVM = support vector machine; DT = decision tree.
Comparison of SVM model, DT model and Fisher discriminant analysis
According to the above results, differences in the prediction results of the SVM model, DT model and Fisher discriminant analysis are shown in Table III. The ROC curve is presented in Figure 1. For the calculation equations of sensitivity, specificity, accuracy, PPV and NPV we refer to our previous study (10). The sensitivities of SVM, DT and Fisher discriminant analysis were 82.0%, 80.0% and 80.0%, respectively; the specificities were 80.0%, 82.0% and 54%, respectively. The AUCs were 0.810 (95% confidence interval [CI] 0.719-0.882), 0.810 (95% CI 0.719-0.882) and 0.670 (95% CI 0.569-0.761), respectively.
Comparison of results in the testing set by SVM, DT and Fisher discriminant analysis
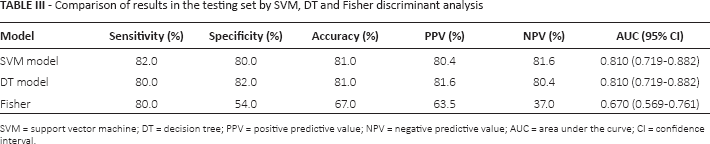
SVM = support vector machine; DT = decision tree; PPV = positive predictive value; NPV = negative predictive value; AUC = area under the curve; CI = confidence interval.
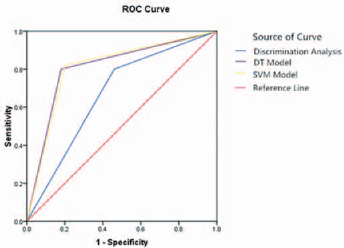
ROC curves of SVM, DT and Fisher discriminant analysis. The red line is the reference line and the blue, yellow and purple lines represent Fisher discriminant analysis, the SVM model and the DT model, respectively. The AUCs of the SVM and DT models are both 0.810, and the AUC of Fisher discriminant analysis is 0.670.
Discussion
Diagnostic value of tumor markers in lung cancer
The development of cancer involves multiple factors, multiple genetic changes and multistage advances. DNA methylation is a frequent early molecular event in the development of lung cancer. A line of studies showed that lung cancer was associated with p16, RASSF1A and FHIT promoter methylation (11, 12). The tumor suppressor gene p16, located on chromosome 9p21, was found to be directly involved in cell cycle regulation. Once p16 was silenced, the decreased p16 protein expression caused abnormal cell proliferation followed by tumor development, and the main mechanism of p16 gene silencing was a high level of methylation in the promoter region (13). RASSF1A, located on the short arm of chromosome 3, is a member of the RAS association domain family. When RASSF1A is inactivated, RAS signaling pathways lead to unlimited cell growth and differentiation, followed by tumor development (14). Studies carried out so far have shown that deactivation of RASSF1A gene expression in lung cancer is caused by abnormal methylation of CpG islands in the promoter region (15). FHIT is a tumor suppressor gene located on chromosome 3p14.2. Studies have shown that high methylation in the FHIT promoter region was closely associated with loss of heterozygosity. The loss of FHIT expression in lung cancer was mainly due to high methylation in its promoter region (16). In the present study, there were statistically significant differences in the methylation status of p16, RASSF1A and FHIT promoters between cancer patients and controls.
Changes in telomere length influence changes of telomere structure and function, and the risk of cancer increases with the shortening of telomeres. There is growing evidence that telomere shortening plays an important role in lung cancer development. In early stages of cancer, excessive wear of telomere ends on chromosomes makes the cell escape the monitoring point of cell senescence and death, which causes telomere ends to fuse into a breakage-fusion-bridge cycle, leading to chromosome instability and eventually tumor development, with further cell differentiation and proliferation (17). In addition, recent research has shown that shorter telomeres also increase the risk of lung cancer by causing immune cell dysfunction or accelerating apoptosis (18). In the present study we found that the length of lung telomeres in cancer patients was shorter than in controls, which suggested that telomere shortening was a risk factor for lung cancer; this was consistent with previous findings (19).
In fact, one of p16, RASSF1A and FHIT promoter methylation and RTLI could be detected in various tumors, and therefore was not specific for lung cancer, but there might be different levels. Consequently, the combined detection of p16, RASSF1A and FHIT promoter methylation status and RTL might be a useful aid in the diagnosis of lung cancer.
Prediction of SVM model
With thorough study of SVM and the rapid development of computer application technology, the theory of SVM has gradually matured, and SVM has been used in many fields in recent years. It also gradually acquired a place in the medical field. SVM is different from traditional statistics. The SVM algorithm is a new type of structured learning method that is not based on the traditional principle of empirical risk minimization but on the theoretical basis of structural risk minimization. As it emphasizes the minimization of confidence intervals, it is suitable for small sample sizes. It has the advantage of developing a high-dimensional model of small size sample, and it is good at predicting (7). In view of these advantages, the SVM model also has very high potential in clinical auxiliary diagnosis (20). At present, the excellent classification performance of SVM is becoming the focus among mass data-mining techniques; in particular, it produced a series of good results in terms of biological auxiliary diagnosis (21).
The SVM model had a sensitivity of 82.0%, specificity of 80.0%, accuracy of 81.0%, PPV of 80.4%, and NPV of 81.6% in the present study. Considering the features of SVM itself, no mater the size of the sample, it was a good choice to try SVM to obtain better effects. These results indicate that SVM in combination with multiple markers is a valuable tool in the computer-assisted diagnosis of lung cancer.
Prediction of DT model
DT is an effective machine-learning classification algorithm which has been clinically used to display the influence of each variable on the classification by an inverted tree through the study of data, and to classify the data and forecast their rules. The aim is to reduce subjectivity in diagnosing by use of an artificial intelligence diagnostic model (22). The general process of the DT model is as follows. First, large amounts of extracted data are processed by their features, and the training set is divided into groups after repeated training. Second, the initial tree is set up according to the rules, and the model is developed to predict the new parameters after proper pruning. Lastly, the model is optimized by pruning the tree via forecast data for verification (23). Outstanding characteristics of DT classification are the short time needed, the high efficiency, and the low occupation of computer resources; moreover, the classification results are intuitive, clear and simple, and DT can deal with classification variables and continuous variables (8).
The DT model had a sensitivity of 80.0%, specificity of 82.0%, accuracy of 81.0%, PPV of 81.6%, and NPV of 80.4% in the present study. Since the classification rules of DT were easier to understand, and DT was good at dealing with non-numeric data (discrete value field) and with missing values, the DT model could also reduce the lots of data processing workload. These results indicated that DT in combination with multiple markers can also play a key role in the computer-assisted diagnosis of lung cancer.
Comparison of SVM model, DT model and Fisher discriminant analysis
The sensitivity, specificity, accuracy, PPV and NPV of SVM, DT and discriminant analysis were evaluated. The sensitivity was equal among the 3 models while the other values were different, and higher in SVM and DT. The AUCs of the SVM model (0.810, 95% CI 0.719-0.882) and DT model (0.810, 95% CI 0.719-0.882) were identical, and were higher than the AUC of Fisher discriminant analysis (0.670, 95% CI 0.569-0.761). The difference was statistically significant, so the effects of SVM and DT were superior to that of the traditional Fisher discriminant analysis.
There are differences between the SVM model, DT model and Fisher discriminant analysis in the diagnosis of lung cancer, the main reason being that there are many influencing factors in the discrimination of lung cancer. In addition to the 4 tumor markers used in this study, there are also other kinds of information such as symptoms, smoking history, family history, and so on, and complicated nonlinear relationships exist between complicated factors. Fisher discriminant analysis is a linear model and has certain limitations in analyzing a nonlinear system. SVM and DT on the other hand do not need accurate mathematical models and can learn fuzzy evaluation. Another reason is the methodology itself: the SVM and DT models solve problems based on logic, while Fisher discriminant analysis solves problems based on the statistical properties of the sample.
The SVM model and DT model are common methods of data mining, and the classification effects are both good. They also have their own characteristics because of different principles. SVM is especially suitable for a small sample size. DT has an advantage in processing discrete data. This study showed no significant differences between their classification effects. One of the reasons may be that the sample size was small; moreover, the data of the 4 tumor markers were neat, with neither discrete nor missing values, so no prominent advantages of either model were reflected. The 2 models to identify lung cancer showed no obvious differences, and were both good classification models of lung cancer.
However, it is worth noting that our research team previously tried to take other tumor markers into a data mining model with an accuracy as high as 96.9% in the context of a lung cancer-related study (24). In the present study, the SVM model and DT model did not reach that level of accuracy; possible reasons are that the sample and biomarkers were both changed. Therefore, to improve the system, we need to analyze and compare biomarkers comprehensively, screen for ideal biomarkers, and perfect the data mining model in the future.
Conclusions
This study shows that p16, RASSF1A and FHIT promoter methylation status and RTL are associated with lung cancer, and that the SVM model and the DT model for the diagnosis of lung cancer have been successfully developed combined with the detection of the 4 biomarkers. These 2 model systems have great potential for the diagnosis of lung cancer.
Footnotes
Financial support: The work was supported by the National Natural Science Foundation of China (NSFC 81573203, 30972457, 81001239) and the Outstanding Youth Grant of Zhengzhou University (No. 1421329082).
Conflict of interest: None of the authors has any conflict of interest related to this work.