
Abstract
Background and Objectives
Body cavity fluid examination sometimes presents a diagnostic challenge in cytology practice. This meta-analysis was undertaken to comprehensively assess the diagnostic potential of epithelial membrane antigen (EMA) in malignant effusions.
Materials and Methods
All relevant original articles about EMA in the diagnosis of malignant effusions published up to July 1, 2014 were retrieved. The overall sensitivity, specificity, positive and negative likelihood ratio, diagnostic odds ratio, and summary receiver operating characteristic (SROC) curve were pooled to evaluate the diagnostic value of EMA for malignant effusions using the Meta-Disc 1.4 and STATA 12.0 statistical software.
Results
Eleven studies met the inclusion criteria for the meta-analysis and the summary estimates for EMA in the diagnosis of malignant effusions were as follows: sensitivity 0.9 (95% CI 0.83-0.87), specificity 0.87 (95% CI 0.96-0.99), positive likelihood ratio 5.8 (95% CI 15.59-36.37), negative likelihood ratio 0.15 (95% CI 0.07-0.20) and diagnostic odds ratio 52.63 (95% CI 20.91-132.49). The SROC curve indicated that the maximum joint sensitivity and specificity (Q-value) was 0.88; the area under the curve was 0.94.
Conclusion
The present meta-analysis indicated that EMA may be a useful diagnostic tool with good sensitivity and specificity for differentiating malignant effusions from benign effusions.
Introduction
Body cavity effusions may be the first manifestation of an underlying malignancy such as lung, breast, gastrointestinal or female genital adenocarcinoma and malignant mesothelioma (1-2-3). Distinguishing malignant effusions presents a common and sometimes difficult diagnostic challenge in day-to-day cytology practice due to wide morphological variation of mesothelial and malignant cells in serous effusions (4). In recent years, with the development of newer techniques, the diagnostic accuracy of effusion cytology has been enhanced (5). Immunocytochemical identification of carcinoma cells in effusions has been increasingly recognized especially when malignant cells are few in number and likely to be missed with conventional cytology. The epithelial membrane antigen (EMA) belongs to a group of proteins known as human milk fat globule membrane proteins, which are present in a wide variety of epithelia under normal and neoplastic conditions (6). An increasing number of studies are examining the ability of EMA antibody as a marker for the diagnosis of malignant effusions (3, 7-8-9-10-11-12-13-14-15-16). Nevertheless, the role of EMA in the differential diagnosis between malignant and benign effusions remains controversial. We therefore performed the present meta-analysis to establish the overall accuracy of EMA for differentiating malignant cells in serous effusions.
Materials and Methods
Search Strategy and Study Selection
PubMed, Embase and the Cochrane Library were searched to identify suitable studies up to July 1, 2014. We used the terms “EMA”, “epithelial membrane antigen”, “body fluids”, “effusions”, “sensitivity and specificity” and “accuracy”, while the syntax used for the search was ((“EMA”[All Fields] OR “epithelial membrane antigen”[All Fields]) AND (“effusions”[All Fields] OR “body fluids”[All Fields]) AND (“sensitivity”[All Fields] OR “specificity”[All Fields]) OR “accuracy”[All Fields])). The language was limited to English. Any other relevant studies cited in the reference lists of the selected papers were also evaluated to identify additional eligible studies. Conference abstracts and letters to journal editors were excluded because of the limited data presented in them.
To be eligible for inclusion in the meta-analysis, studies must evaluate EMA in the diagnosis of malignant effusions and provide sufficient data to calculate both sensitivity and specificity. Only studies including at least 10 body cavity fluid specimens were selected since very small studies may be vulnerable to selection bias. Two authors independently screened the articles for inclusion. Disagreements between the reviewers were resolved by consensus.
Data Extraction and Quality Assessment
Two authors independently extracted the data and reached a consensus on all items. Any discrepancies were resolved by discussion with a third author to reach a final consensus. The following data were collected from each study: (i) basic characteristics including the first author's name, year of publication, country, test method, cutoff value; (ii) diagnostic outcomes including sensitivity and specificity data. The methodological quality of the studies was assessed using guidelines published by the QUADAS-2 (Quality Assessment of Diagnostic Accuracy Studies) tool, an evidence-based quality assessment tool for use in systematic reviews of diagnostic accuracy studies. The QUADAS-2 tool consists of 4 key domains that discuss patient selection, index test, reference standard and flow of patients through the study and timing of the index tests and reference standard (flow and timing) (17).
Statistical Analyses
The standard methods recommended for the diagnostic accuracy of meta-analyses were used in the present study (18). The following measures of test accuracy were computed for each study: sensitivity, specificity, positive likelihood ratio (PLR), negative likelihood ratio (NLR), and diagnostic odds ratio (DOR). The diagnostic threshold identified for each study was used to plot a summary receiver operating characteristic (SROC) curve (19). Spearman's rank correlation was performed as a test for threshold effect. The interstudy heterogeneity was calculated by the chi-square-based Q-test and the inconsistency index I2. When a significant Q-test (p<0.05 or I2>50%) indicated heterogeneity among studies, the random-effect model (DerSimonian-Laird method) was conducted for the meta-analysis to calculate the pooled sensitivity, specificity and other related indexes of the studies; otherwise, the fixed-effect model (Mantel-Haenszel method) was used. Meta-regression was performed to investigate the source of heterogeneity within the included studies (inverse variance weighted) (20). The publication bias was tested by Deeks’ funnel plots (21). Analyses were performed using the following statistical software programs: STATA, version 12.0 (Stata Corporation) and Meta-Disc 1.4 for Windows (XI Cochrane Colloquium, Barcelona, Spain) (22, 23). All statistical tests were 2-sided, and significance was set at p<0.05.
Results
Characteristics and Quality of the Included Studies
The initial database search yielded 107 articles. From these 107 articles, 66 were excluded because they were not relevant to the study question, 10 were excluded because they were not human studies, 4 were excluded because they were reviews, letters and conference abstracts, leaving 27 potentially relevant studies. Full articles of potentially eligible studies were reviewed in depth and 11 individual studies met our inclusion criteria. The article selection process used in this study is summarized in Figure 1. The main clinical characteristics of the included studies are presented in Table I. Overall, the 11 selected studies included 609 individuals and had an average size of 55 individuals. The studies were performed in 7 countries (United States, Iran, Spain, Korea, Greece, Netherlands and China) and published between 1994 and 2011. As shown in Table II, the validity of the included trials was assessed using the QUADAS-2 tool. Based on the methods reported in each trial, each of the 14 components according to the QUADAS-2 criteria was graded as ‘‘yes’’, ‘‘unclear’’ or ‘‘no’’, which meant ‘‘low risk of bias’’, ‘‘uncertain of bias’’ and ‘‘high risk of bias’’, respectively (17).
Summary of the studies included in the meta-analysis
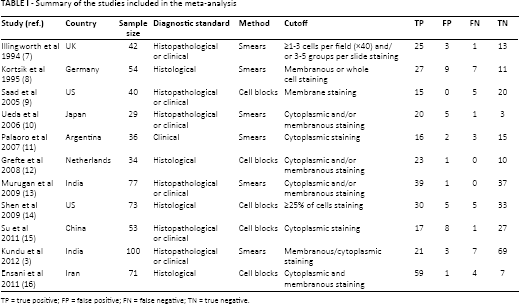
TP = true positive; FP = false positive; FN = false negative; TN = true negative.
Summary of the methodological quality assessment of the included studies according to QUADAS-2 criteria
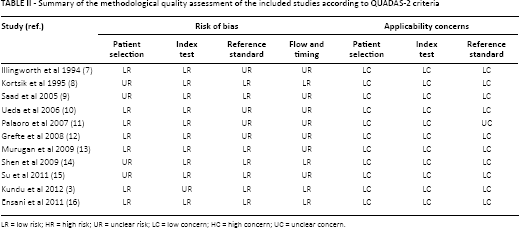
LR = low risk; HR = high risk; UR = unclear risk; LC = low concern; HC = high concern; UC = unclear concern.
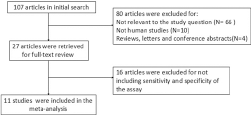
Flow chart of selection process for eligible articles.
Diagnostic Accuracy
The between-study heterogeneity was assessed by the I2 index to choose the appropriate calculation model. Since significant heterogeneity between studies was observed in sensitivity, specificity, PLR, NLR and DOR data (I2 = 66.8%, 76.9%, 80.5%, 49.8% and 55.6%, respectively; all p<0.05), the random-effect model was used in this meta-analysis.
Forest plots of the sensitivity and specificity of these 11 studies concerning EMA in the diagnosis of malignant effusions are shown in Figure 2. The pooled sensitivity and specificity were 0.9 (95% CI 0.86-0.93) and 0.87 (95% CI 0.82-0.9), respectively. The overall PLR and NLR were 5.8 (95% CI 3-11.22) and 0.15 (95% CI 0.09-0.25), respectively. The pooled DOR was 52.63 (95% CI 20.91-132.49). Figure 3 shows the SROC curves for EMA, which indicates the sensitivity versus 1-specificity of individual studies. We also used the Q-value, the intersection point of the SROC curve with a diagonal line from the left upper corner to the right lower corner of the ROC space, which corresponds to the highest common value of sensitivity and specificity for the test, for the overall measure of the discriminatory power of the test. Our data showed that the SROC curve for EMA was positioned near the desirable upper left corner and the Q-value was 0.88; the area under the curve (AUC) was 0.94, which suggested that the diagnostic accuracy of EMA reached a relatively high level.
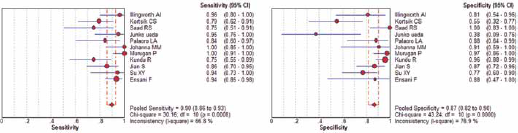
Forest plots of the sensitivity and specificity of EMA in the diagnosis of malignant effusions for all studies. The point estimates of sensitivity and specificity for each study are shown as solid circles and the size of each solid circle indicates the sample size of each study. Error bars are 95% confidence intervals (19).
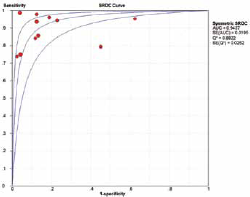
Summary receiver operating characteristic (SROC) curve for EMA in the diagnosis of malignant effusions for all studies. Solid circles represent each study included in the meta-analysis. The size of each solid circle indicates the size Applicability concernsch study. The regression SROC curve summarizes the overall diagnostic accuracy.
Meta-Regression and Publication Bias
As the I2 test for the pooled sensitivity, specificity, NLR and DOR showed significant heterogeneity between studies, a meta-regression analysis was performed to explore the possible reasons for the heterogeneity. We used 4 covariates in the meta-regression: (i) test method (cell blocks or smears); (ii) sample size (≥50 or <50); (iii) risk of patient selection bias (low risk or not); (iv) risk of bias in reference standard (low risk or not). None of the above covariates were found to be a significant source of heterogeneity (p = 0.49, 0.73, 0.77 and 0.15, respectively).
The publication bias of the literature was assessed using Deeks’ funnel plots. The graphical funnel plots of the included studies were symmetrical (Fig. 4). The Deeks’ test also indicated that there were no publication biases (p = 0.41).
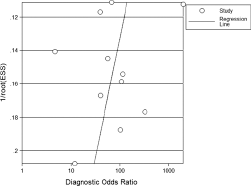
Funnel graph for the assessment of potential publication bias of the 11 included studies. The funnel graph plots the log of the diagnostic odds ratio (DOR) against the standard error of the log of the DOR (an indicator of sample size). Solid circles represent each study in the meta-analysis. The line indicates the regression line.
Discussion
Serous effusion is a common complication of a variety of benign and malignant disorders. Although cytomorphology remains the principal method to detect malignant cells in effusions, the morphological changes exhibited by reactive mesothelial cells often confound the diagnosis in the cytological evaluation of body cavity effusions (24). Therefore, complementary methods such as immunocytochemistry are often used to help the cytological diagnosis. EMA is an antibody to a human milk fat globule membrane immunogen (25). EMA reactivity was seen in a variety of simple and glandular epithelia including the respiratory tract, pancreas, intestine and endometrium. It has been suggested that EMA positivity is a sign of malignancy in epithelial mesothelial proliferations (26, 27). In recent years, a number of diagnostic tests have focused on the value of EMA in the differential diagnosis of benign and malignant effusions, but these studies reported a range of specificities and sensitivities. As meta-analysis is an essential tool for accurately and reliably summarizing evidence (28), we performed this meta-analysis to assess the overall diagnostic accuracy of EMA for malignant effusions.
The results of the analysis, which included 11 independent clinical diagnostic tests with 609 patients, suggest that EMA has good overall sensitivity (90%) and specificity (87%) in the diagnosis of malignant effusions. The DOR of a diagnostic test is the ratio of the odds of positivity in disease relative to the odds of positivity in the non-diseased, which is a single indicator of test performance that combines the data from sensitivity and specificity into a single number (29). The value of a DOR ranges from 0 to infinity, with higher values indicating better discriminatory test performance. In this meta-analysis, the pooled DOR was 52.63, also suggesting a high level of overall accuracy. The SROC curve presents a global summary of the test performance, and shows the trade-off between sensitivity and specificity. The analysis-based SROC curve showed that the maximum joint sensitivity and specificity was 0.88; the AUC was 0.94, also confirming that EMA was very helpful in the diagnosis of malignant effusions, although not perfect. The PLR was 5.8 and the NLR was 0.15. Likelihood ratios >10 and <0.1 are considered strong indicators to rule in or rule out a diagnosis, respectively (30). In clinical practice, patients with malignant effusions have an about 6-fold higher chance of being EMA-positive than patients with benign effusions, and this was high enough. On the other hand, the NLR was 0.15, which means that the probability of having malignant effusions in EMA-negative patients is 15% in theory; this indicates that, although not as good as expected, measurement of this marker could be helpful in the diagnosis of malignant effusions in clinical use.
An exploration of the reasons for heterogeneity rather than computation of a single summary measure is an important purpose of meta-analysis (31). In our meta-analysis, the effects of different methods, sample sizes and QUADAS results on relative diagnostic odds ratios (RDOR) were assessed. However, we did not find that the variables included in the meta-regression analysis substantially affected the diagnostic accuracy of EMA for malignant effusions.
Our data suggest that EMA may, to a certain extent, play a role in the diagnosis of malignant effusions. However, based on the findings in our meta-analysis, we cannot recommend using a single marker alone for the diagnosis of malignant effusions, and combination of EMA with other tumor markers seems to increase the diagnostic accuracy (32). In addition to the antibody analyzed in the present meta-analysis, some other antibodies such as MOC-31, Ber-EP4, CA19-9 and CEA have also been evaluated for their use in the diagnosis of malignant effusions. A recent meta-analysis showed that the summary estimates for MOC-31 in the diagnosis of malignant effusions were: sensitivity 0.85 (95% CI 0.83-0.87) and specificity 0.97 (95% CI 0.96-0.99) (33). Some investigators reported that calretinin and Ber-EP4 had high sensitivity (90% and 98%, respectively) and high specificity (100% and 86%, respectively) in differentiating malignant from benign effusions (34). However, it should be pointed out that there are insufficient related studies to evaluate the combination of EMA and other tumor markers in the diagnostic accuracy for malignant effusions, and due to the varying diagnostic accuracy of identical markers between studies it is unclear which markers perform best. Therefore, more immunomarkers should be evaluated for their diagnostic accuracy in larger sample sizes to find the optimum panel of antibodies for the diagnosis of malignant effusions.
Our study has several limitations. First, the exclusion of conference abstracts, letters to journal editors and non-English language studies may have resulted in publication bias, and the accuracy estimates may have been inflated due to the preferential acceptance of papers reporting favorable results. Secondly, studies with small sample sizes appeared to overestimate the diagnostic accuracy of EMA for the diagnosis of malignant effusions. Thirdly, because of a lack of required data reported in the original publications, we could not analyze the effect of factors such as laboratory infrastructure, immunotechnology expertise, and patient setting on the accuracy of the EMA measurements. For the same reason we were unable to ascertain whether the study design (e.g., blinded, cross-sectional, consecutive/random, prospective) affected the diagnostic accuracy. Further study is therefore needed to evaluate the diagnostic accuracy of EMA in clinical applications.
It should also be noted that the diagnosis of malignant effusions by immunocytochemistry is still flawed by technical problems. Cytological examination of malignant effusions in routine practice can contribute to diagnosis only in cases with adequate cytological preparations (35). Moreover, in effusion cytology, specific staining may not be obtained because of disrupted cells and membrane fragments sticking to slides, and there is a lack of parallel samples of the same cells for additional tests or to run the control (36). Experimental conditions and methods of different laboratories may also affect the diagnostic results. Therefore, in the era of precision medicine, obtaining histological material still plays a crucial role that cytological examination cannot replace for investigations in targeted therapies. Future work should focus on increasing the homogeneity and overall performance of cytological diagnosis for malignant effusions to minimize the current weaknesses.
In conclusion, our meta-analysis demonstrated that EMA may be a useful adjunct to conventional diagnostic tools with good sensitivity and specificity for differentiating malignant from benign effusions, while the results of immunostaining should be interpreted in parallel with the gold standard of morphology and clinical findings.
Footnotes
Abbreviations
Acknowledgment
We thank all authors of the primary studies included in our meta-analysis.
Financial support: None.
Conflict of interest: None.