
Abstract
Background
MicroRNAs (miRNAs), small noncoding RNAs, are involved in tumorigenesis and in the development of various cancers. Quantitative real-time polymerase chain reaction (qPCR) is the most commonly used tool to investigate miRNA expression, and qPCR low-density arrays are increasingly being used as an experimental technique for both the identification of potentially relevant miRNAs and their subsequent validation. Due to the reduced number of microRNAs to be validated, this phase is generally performed on ad hoc customized cards for which a technical robustness is assumed similar to that of the high-throughput cards used during the identification phase.
Methods
With the aim of investigating the degree of reproducibility between the 2 types of cards, we analyzed plasma-circulating miRNAs evaluated in 60 subjects enrolled in a colorectal cancer screening program.
Results
Our results showed a reproducibility between the 2 methods that was not fully satisfactory, with a concordance correlation coefficient equal to 0.69 (95% confidence interval, 0.12-0.92).
Conclusions
This report highlights the need to add a technical validation step to the high-throughput-based miRNA identification workflow, after their discovery and before the validation step in an independent series.
Introduction
MicroRNAs (miRNAs) are a class of small noncoding RNAs that play an important role in tumorigenesis and in the development of various cancers (1). Quantitative real-time polymerase chain reaction (qPCR) is the most commonly used assay to investigate miRNA expression, and qPCR low-density arrays are the most widely used technique for both the identification and the subsequent validation of the potentially relevant miRNAs (2–4). Available high-throughput qPCR low-density arrays (e.g., TaqMan miRNA low-density arrays) allow the simultaneous expression profiling of several miRNAs. They represent a suitable tool for discovery purposes where the intrinsic lack of precision (absence of replicates) and specificity (multiple tests) are balanced by the opportunity of performing large-scale screenings for selecting promising miRNAs to be further investigated. In contrast, customized low-density arrays, designed with replicates of the miRNAs identified, ideally offer the possibility to increase the level of both precision and specificity of the experiment. There are, however, some differences among the 2 methodologies, that could significantly affect the results of the validation. Although it is commonly recognized that the technical robustness of the customized arrays represents a crucial step toward the process of addressing the clinical utility of the selected miRNAs, this issue is generally disregarded by assuming an a priori satisfactory level of reproducibility between the high-throughput assay and the customized one. The 2 assays, although based on the same principles, are implemented according to specific protocols that differ for some preanalytical (i.e., number of primers included in the solutions used for the preamplification and for the reverse transcription reaction) as well as analytical steps (PCR platform setting, number of thermal cycles and number of replicates). To our knowledge, although a good level of intra-reproducibility and inter-reproducibility was reported (5–7) for both assays, no information is available about their mutual reproducibility. Based on the above considerations, we examined, from a statistical point of view, the transition from the discovery to the validation phase, by evaluating the reproducibility between the high-throughput and the customized assay for the evaluation of miRNA expression levels in plasma samples.
Materials and Methods
We considered 60 plasma samples from fecal immunochemical test positive (FIT+) subjects enrolled in the colorectal cancer screening program promoted by the Milan Local Health Authority and ongoing at our institute. Among the 60 subjects, 38 individuals (cases) presented a precancerous or cancerous lesion at colonoscopy, whereas 22 individuals resulted with no lesions (controls). The miRNA profile of each sample was analyzed using the TaqMan Array Human microRNA Card A (Applied Biosystems, Foster City, CA, USA) containing 381 mature miRNAs for the identification of miRNAs differentially expressed between cases and controls. Using this high-throughput assay (Megaplex card) in the discovery phase, we identified a set of 7 potentially relevant circulating miRNAs with a significant different expression (p-value ≤0.05) in the 2 groups compared (cases and controls), according to the Kruskal-Wallis test (8). These miRNAs were included in an ad hoc designed Custom TaqMan Array microRNA card (Customized card) for their validation. Total RNA (including small RNAs) extracted from 400 μL of plasma, as previously described (9), was used for both the cards.
A Megaplex card for each of the 60 samples was prepared using the standard Megaplex Pools protocol with the following modifications: 10 µL of reverse transcription (RT) product was added to the preAmp Reaction Mix, a preamplification step of 14 cycles was performed, and no post-preamplification and PCR reaction dilution were done (Optimized Blood Plasma Protocol for Profiling Human miRNAs Using the OpenArray Real-Time PCR System; Applied Biosystems). Since we started from a small amount of total RNA, these modifications were required to increase, with an unbiased approach, the quantity of specific cDNA targets of the 381 miRNAs. qPCR was done using FAST chemistry (Applied Biosystems, Foster City, CA, USA) in an ABI PRISM 7900 HT Real-Time PCR system (Applied Biosystems, Foster City, CA, USA).
Starting from the same 60 samples, a total of 8 customized cards were designed with the selected miRNAs in duplicate, together with their corresponding primer mix. Reactions were done according to the manufacturer's protocol (Life Technologies), with the following modifications: 4 µL of total RNA was converted into cDNA, 9 µL of RT product was preamplified, and a preamplification step of 14 cycles was done. Post-preamplification and PCR reaction dilution, even in this case, were not required. Customized cards were processed similarly to the Megaplex ones.
Data analysis was performed using as pivotal measure the log2RQ (relative quantity) values obtained with the comparative cycle threshold (Ct) method (10); accordingly, the relative expression of each of i-th (i = 1,…,7) miRNAs considered was computed as follows: ∆Cti = Cti - Ctref, where Ctref is the average of the miRNAs identified as reference. The last were identified by using an ad hoc algorithm we recently developed that allows the selection of a subset of reference miRNAs suitable for data normalization (11, 12). By starting from these values, the relative quantity was obtained as RQi = 2-∆Cti (i.e., log2RQi = -∆Cti).
To investigate the technical reproducibility between the Megaplex and the customized cards, we computed as measure of agreement the concordance correlation coefficient (CCC) and its 95% confidence interval (95% CI) (13) starting from the log2RQ values of the 7 miRNAs of interest, evaluated in the same 60 samples with the 2 methods. In line with our previous experience (14, 15), the observed value of CCC was considered fully satisfactory only when the lower limit of the 95% CI was equal to or greater than 0.80. The statistical analyses were carried out with SAS software (version 9.2; SAS Institute Inc., Cary, NC, USA).
Results
We obtained a CCC value equal to 0.69 (95% CI, 0.12-0.92) between the Megaplex and customized card by comparing the expression levels of the 7 miRNAs considered, in the same 60 samples. Specifically, taking into account the lower limit of the 95% CI of CCC, the 2 methods did not reach a fully satisfactory agreement. Similar results were obtained when Ct values were used for the comparison (data not shown). In addition the wideness of this interval strongly suggested the existence of a high variability between the 2 sets of data compared. For purposes of description and with the aim of investigating the role of each miRNA considered, we report in Figure 1 the distribution of the log2RQi differences between the 2 methods for each i-th miRNA considered, within each k-th (k = 1,…,60) sample (δik = ∆Ctik(megaplex) - ∆Ctik(customized)). The most critical miRNA in terms of reproducibility is miR-D, for which the customized card provided an overestimation (with respect to the expected value of zero). In addition miR-D showed the highest variability (interquartile range = 1.814). The most reliable result in terms of mean difference (δ−i) was observed for miR-E (δ−(miR-E) = 0.026). According to the Kruskal-Wallis test, 6 of the 7 miRNAs considered (86%) had a significantly different expression in cases vs. controls (p-value ≤0.05), considering the log2RQ values obtained with the customized card (Tab. I).
Technical validation results
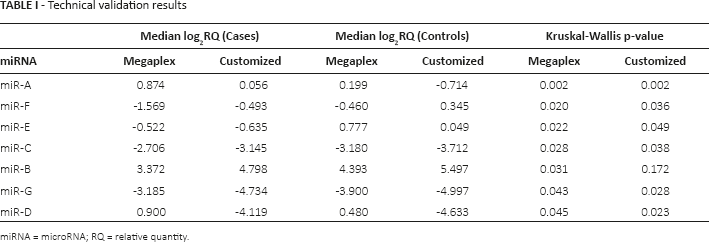
miRNA = microRNA; RQ = relative quantity.
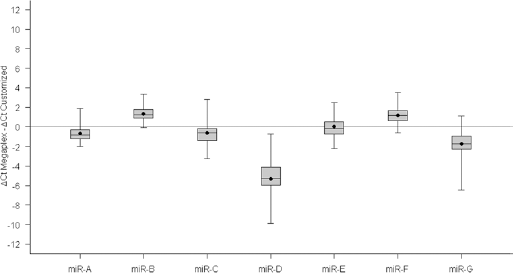
Boxplot of the distribution of the ΔCt (Cycle threshold) differences between the Megaplex and the customized cards. Each box shows the 25th and 75th percentiles of the difference distribution; the horizontal line and the dot inside the box indicate the median and the mean, respectively. The limits of the 2 whiskers correspond to minimum and maximum values. The continuous horizontal line corresponds to the zero value.
Discussion
The development of new cancer-related circulating biomarkers is a multiphase process that begins with their discovery, followed by a validation step (16, 17).
This brief report highlights the need to add a technical validation step to the high-throughput-based miRNA identification workflow, after the discovery of the miRNAs and before the validation step in an independent series. The introduction of an additional step permits us to verify the reproducibility of the assays and to correctly select miRNAs that will have a greater chance of succeeding in the subsequent validation. These considerations can be generalized to any research scenario involving high-throughput-based discovery of putative biomarkers, irrespective of the similarity of the underlying array's principles and chemistry, to reduce costs and time and to obtain robust new biomarkers to be transferred into the clinical setting. In conclusion, the statistical approach we have presented can be viewed as a diagnostics tool to be used for the evaluation of the reproducibility in the technical validation step of the workflow involved in biomarker identification.
Footnotes
Experiments on human subjects: Written informed consent was obtained from all subjects upon approval of the study by the institutional review board and independent ethics committee.
Financial support: This work was supported by the Associazione Italiana per la Ricerca sul Cancro (AIRC, Grants 10529 and 12162 to M.A.P.).
Conflict of interest: The authors have no conflicts of interest to declare.
Meeting presentation: This work was presented at the WIN Symposium 2014, in Paris, France, 23-24 June 2014.