
Abstract
Introduction
Disease recurrence after surgery is a crucial predictor of poor prognosis in colorectal cancer, where disseminated disease at the time of intervention can also be observed in localized early-stage cases. We evaluated the ability to predict disease recurrence of miRNAs from two signatures that we have found linked to the presence of colorectal cancer (CL signature) or adenoma (HgA signature) in higher-risk subjects.
Methods
miRNAs from the signatures were studied longitudinally by quantitative real-time polymerase chain reaction in plasma from 24 patients with resectable colorectal cancer collected at the time of surgery and during scheduled follow-up across 36 months. Patients either showed relapse within 36 months (alive with disease (AWD)), or remained disease-free (no evidence of disease (NED)) for the same period.
Results
Although the signatures did not predict recurrence, expression of the miRNAs from the CL signature decreased 1 year after surgery, and one miRNA of the signature, miR-378a-3p, almost reached significance in the NED subgroup (Wilcoxon signed-rank test: p-value = 0.078). Also, miR-335-5p from the HgA signature was higher in AWD patients before surgery (Kruskal–Wallis test: p-value = 0.019).
Conclusions
These data, although from a small cohort of patients, support the possible use of miRNAs as non-invasive biomarkers in liquid biopsy-based tests to identify patients at risk of relapse and to monitor them during follow-up.
Introduction
Disease recurrence after colorectal cancer (CRC) surgery remains a major clinical problem as 30–40% of patients treated with surgery alone develop recurrence 1 due to disseminated disease at the time of intervention that is not detected by standard imaging diagnostics techniques. 2 This also applies to early-stage localized CRC, for which approximately 10–15% of cases are already disseminated at the time of surgery. The time from the initial treatment to the development of recurrence is strongly related to survival. 3 Current risk assessment based on clinic-pathologic parameters is insufficient to identify patients with residual disease and many recurrence events are detected too late. Continuous efforts have been made to search for simple and reliable biomarkers that can aid in the identification of patients at high-risk of recurrence.
Liquid biopsy for the detection of tumor-related nucleic acids is a promising approach for the assessment of residual disease and early diagnosis of relapse. Circulating tumor DNA (ctDNA) successfully identifies tumor presence in nearly all patients with advanced CRC. However, a major proportion of early stage tumors do not release detectable amounts of ctDNA, even when extremely sensitive techniques are used for their identification. 4 Blood circulating microRNAs (miRNA) have been assessed as possible markers for tumor diagnosis as they are present in blood in a remarkably stable form, plus they are easily isolated and structurally stable during processing. 5 In addition, the expression level of circulating miRNAs is reproducible and consistent among individuals, and miRNAs are measurable with a much greater sensitivity than proteins.5,6 An increase in serum levels of various miRNAs has been reported in diffuse large B cell lymphoma and is associated with relapse-free survival. 7 In breast cancer, circulating miRNAs have been detected with high specificity and sensitivity in stage I and II patients, suggesting that they could be used for early diagnosis. 8 Similarly, various miRNAs have been found increased in the plasma/serum of patients with different cancers. Numerous studies, including ours, have demonstrated unique CRC miRNA profiles compared to non-cancerous tissues, indicating their potential use as tumor biomarkers. 9 Indeed, we showed that miR-378 profile in plasma is associated with disease burden in CRC patients undergoing radical resection. 10 Very recently, we also developed three miRNA signatures predictive of the presence of precancerous and cancerous endoscopic lesions within subjects positive to the fecal immunochemical test (FIT) in a CRC screening program. 11
Based on these results, we assayed the expression and performance of the miRNAs from the signatures that were associated with cancer (CL signature) and high-grade adenoma (HgA signature) in our FIT case study 11 in the plasma of 24 patients with CRC longitudinally collected before surgery and during post-operative follow-up. We then evaluated their role in predicting patient outcomes.
Materials and methods
Case series
We structured plasma samples prospectively collected from patients with resectable CRC who underwent surgery at Fondazione IRCCS Istituto Nazionale dei Tumori, and remained under post-surgical control for at least 36 months. The overall cohort, collected between 2013 and 2017, included 180 patients. Patients who had (a) chemotherapy before surgery; (b) with any other malignant disorder or chronic diseases; (c) the presence of any tumor type other than adenocarcinoma; and (d) with familial adenomatous polyposis were excluded. Each patient provided written informed consent to donate blood samples for research purposes. The study was approved by the Institutional review board (INT36/13).
For each patient, plasma samples were longitudinally collected before surgical resection (i.e. Tpre−surgery or T0) and during the planned follow-up across 36 months. Starting from the overall cohort, plasma from the 12 patients who relapsed within 36 months (alive with disease (AWD)) and from an equal number of patients without relapse (no evidence of disease (NED)) was included in the present analysis. Table 1 reports the main characteristics of the patients included in the study.
Main characteristics of the patients included in the study.
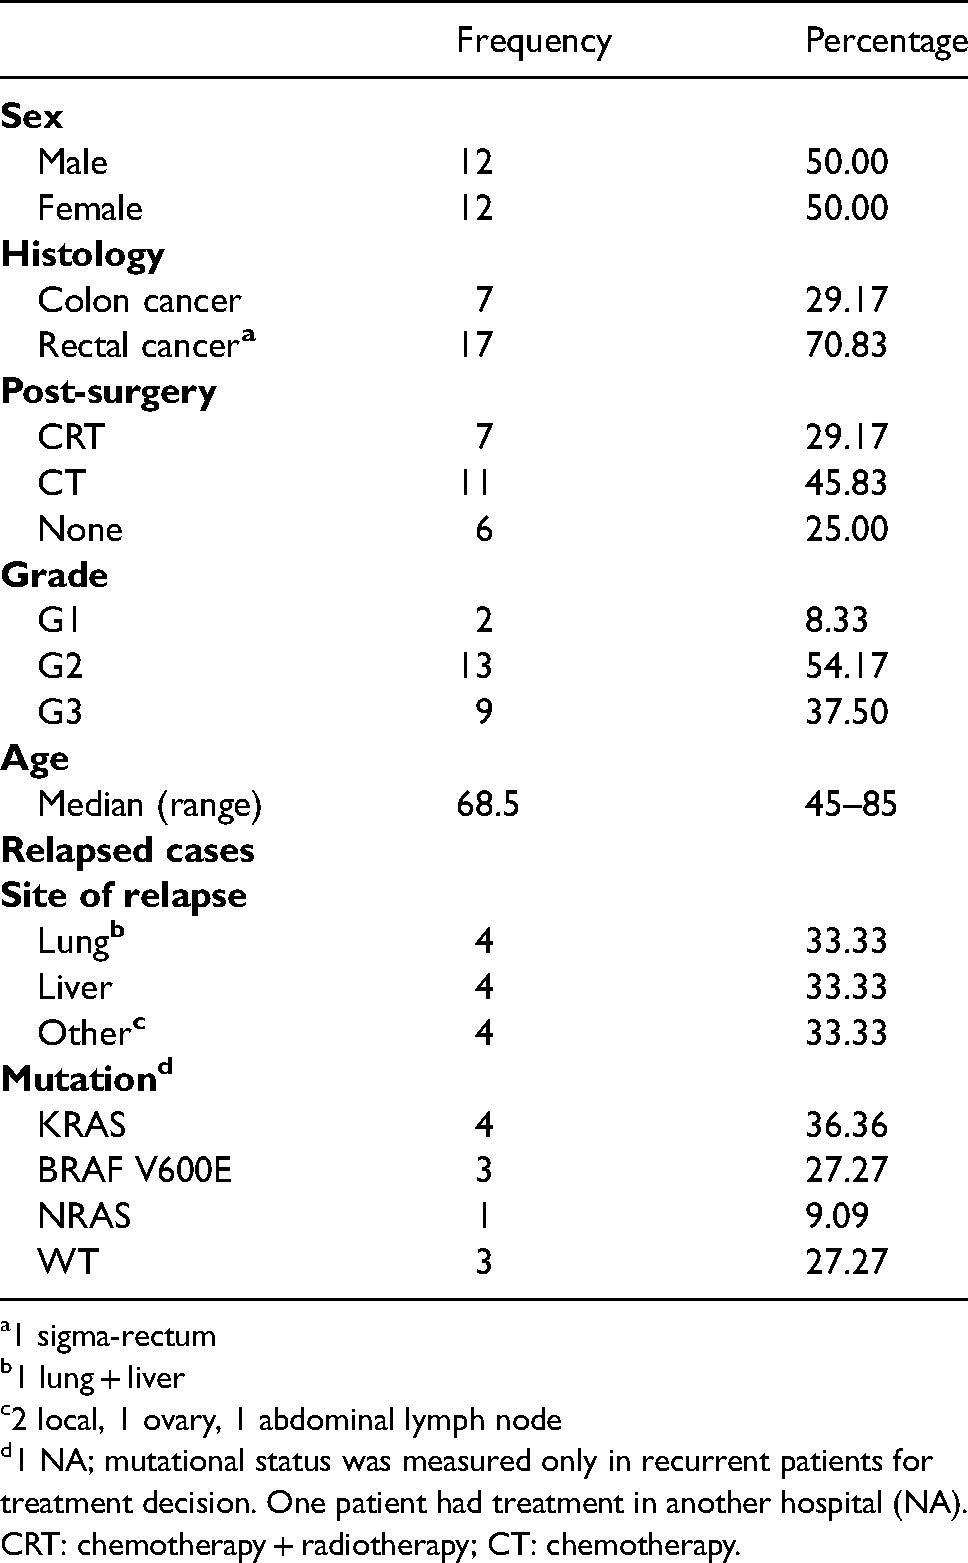
1 sigma-rectum
1 lung + liver
2 local, 1 ovary, 1 abdominal lymph node
1 NA; mutational status was measured only in recurrent patients for treatment decision. One patient had treatment in another hospital (NA).
CRT: chemotherapy + radiotherapy; CT: chemotherapy.
Sample separation and storage
Whole blood was collected using 4-mL BD Vacutainer tubes (BD-Becton Dickinson and Company, NJ) with ethylenediaminetetraacetic acid as anticoagulant. Plasma samples were isolated within 6 h from collection and centrifuged at 1700 × g at 4°C for 15 min. Then, plasma was transferred to 15-mL tubes and re-centrifuged again for 10 min. Finally, plasma samples were collected, divided into aliquots, and stored at −80°C until RNA extraction. 10 The level of hemolysis was determined as described by Pizzamiglio et al. 12
RNA extraction and miRNA analysis
Total RNA (including small RNAs) was extracted from 400 μL of plasma as in Zanutto et al. 11 The miRNA profile of each sample was analyzed using Custom TaqMan Array microRNA cards (ThermoFisher Scientific, Waltham, MA, USA) designed in the 12-assay format: seven candidate miRNA assays included in the CL (hsa-miR-378a-3p, and hsa-miR-342-3p) and HgA (hsa-miR-106b-5p, hsa-miR-483-5p, hsa-miR-323a-3p, hsa-miR-335-5p, hsa-miR-186-5p and hsa-miR-342-3p) signatures, the four normalizing miRNAs (hsa-miR-30c-5p, hsa-miR-345-5p, hsa-miR-150-5p and hsa-miR-296-5p), 11 and the small nuclear RNA U6 predefined control assay. qRT-PCR and data acquisition were conducted as in Zanutto et al. 11
Statistical analysis
The relative quantity (RQ) of each miRNA was computed using the comparative threshold cycle method following the formula 2−ΔCt, with ΔCt = Ct miRNA - Ct reference as in Zanutto et al. 11 Statistical analysis was performed considering miRNA expression (in terms of log2RQ = −ΔCt) of the CL signature and its two components pre-surgery (T0), with respect to the disease status assessed at 36 months (AWD vs. NED) using the Kruskal–Wallis Test (KW) (pre-surgery miRNA expression analysis). In addition, to provide a measure of predictive capability, the area under the receiver operating curve (ROC) was estimated by using a logistic regression model. Time trends of the miRNAs were assessed by comparing the T0 and T1 (i.e. within 12 months from surgical resection for both relapsed and not-relapsed patients) expression profiles (i.e. –ddCt values), and according to the disease status at T1 (T0 and T1 expression profiles analysis) and the pre- and post-surgery expression profiles analysis. For the latter analysis we considered the miRNA expression at first relapse, whenever it occurred within 36 months for the AWDs, or the data of the last medical control (at least at 36 months) for NEDs. For T0 and T1 expression profiles analysis and for pre- and post-surgery expression profiles analysis the Wilcoxon signed-rank test (WSR) was used due to the paired nature of the data. The same non-parametric approaches were used to explore the role of the HgA components. All the statistical analyses were performed considering a Type I error of 0.05.
Results
Pre-surgery miRNAs expression
In plasma samples collected pre-surgery (T0), the area under the curve (AUC) value of the CL signature was 0.606 (95% confidence interval 0.363–0.849) and no significant changes related to recurrence were observed (KW p-value = 0.389, data not shown). Similarly, the expression of each miRNA included in the CL signature was not statistically significant (miR-342-3p: KW p-value = 0.538; miR-378a-3p: KW p-value = 0.389). Analysis of the six miRNAs from the HgA signature showed that miR-335-5p (KW p-value = 0.019) and miR-483-5p (KW p-value = 0.097) were more expressed in AWD patients (Figure 1).
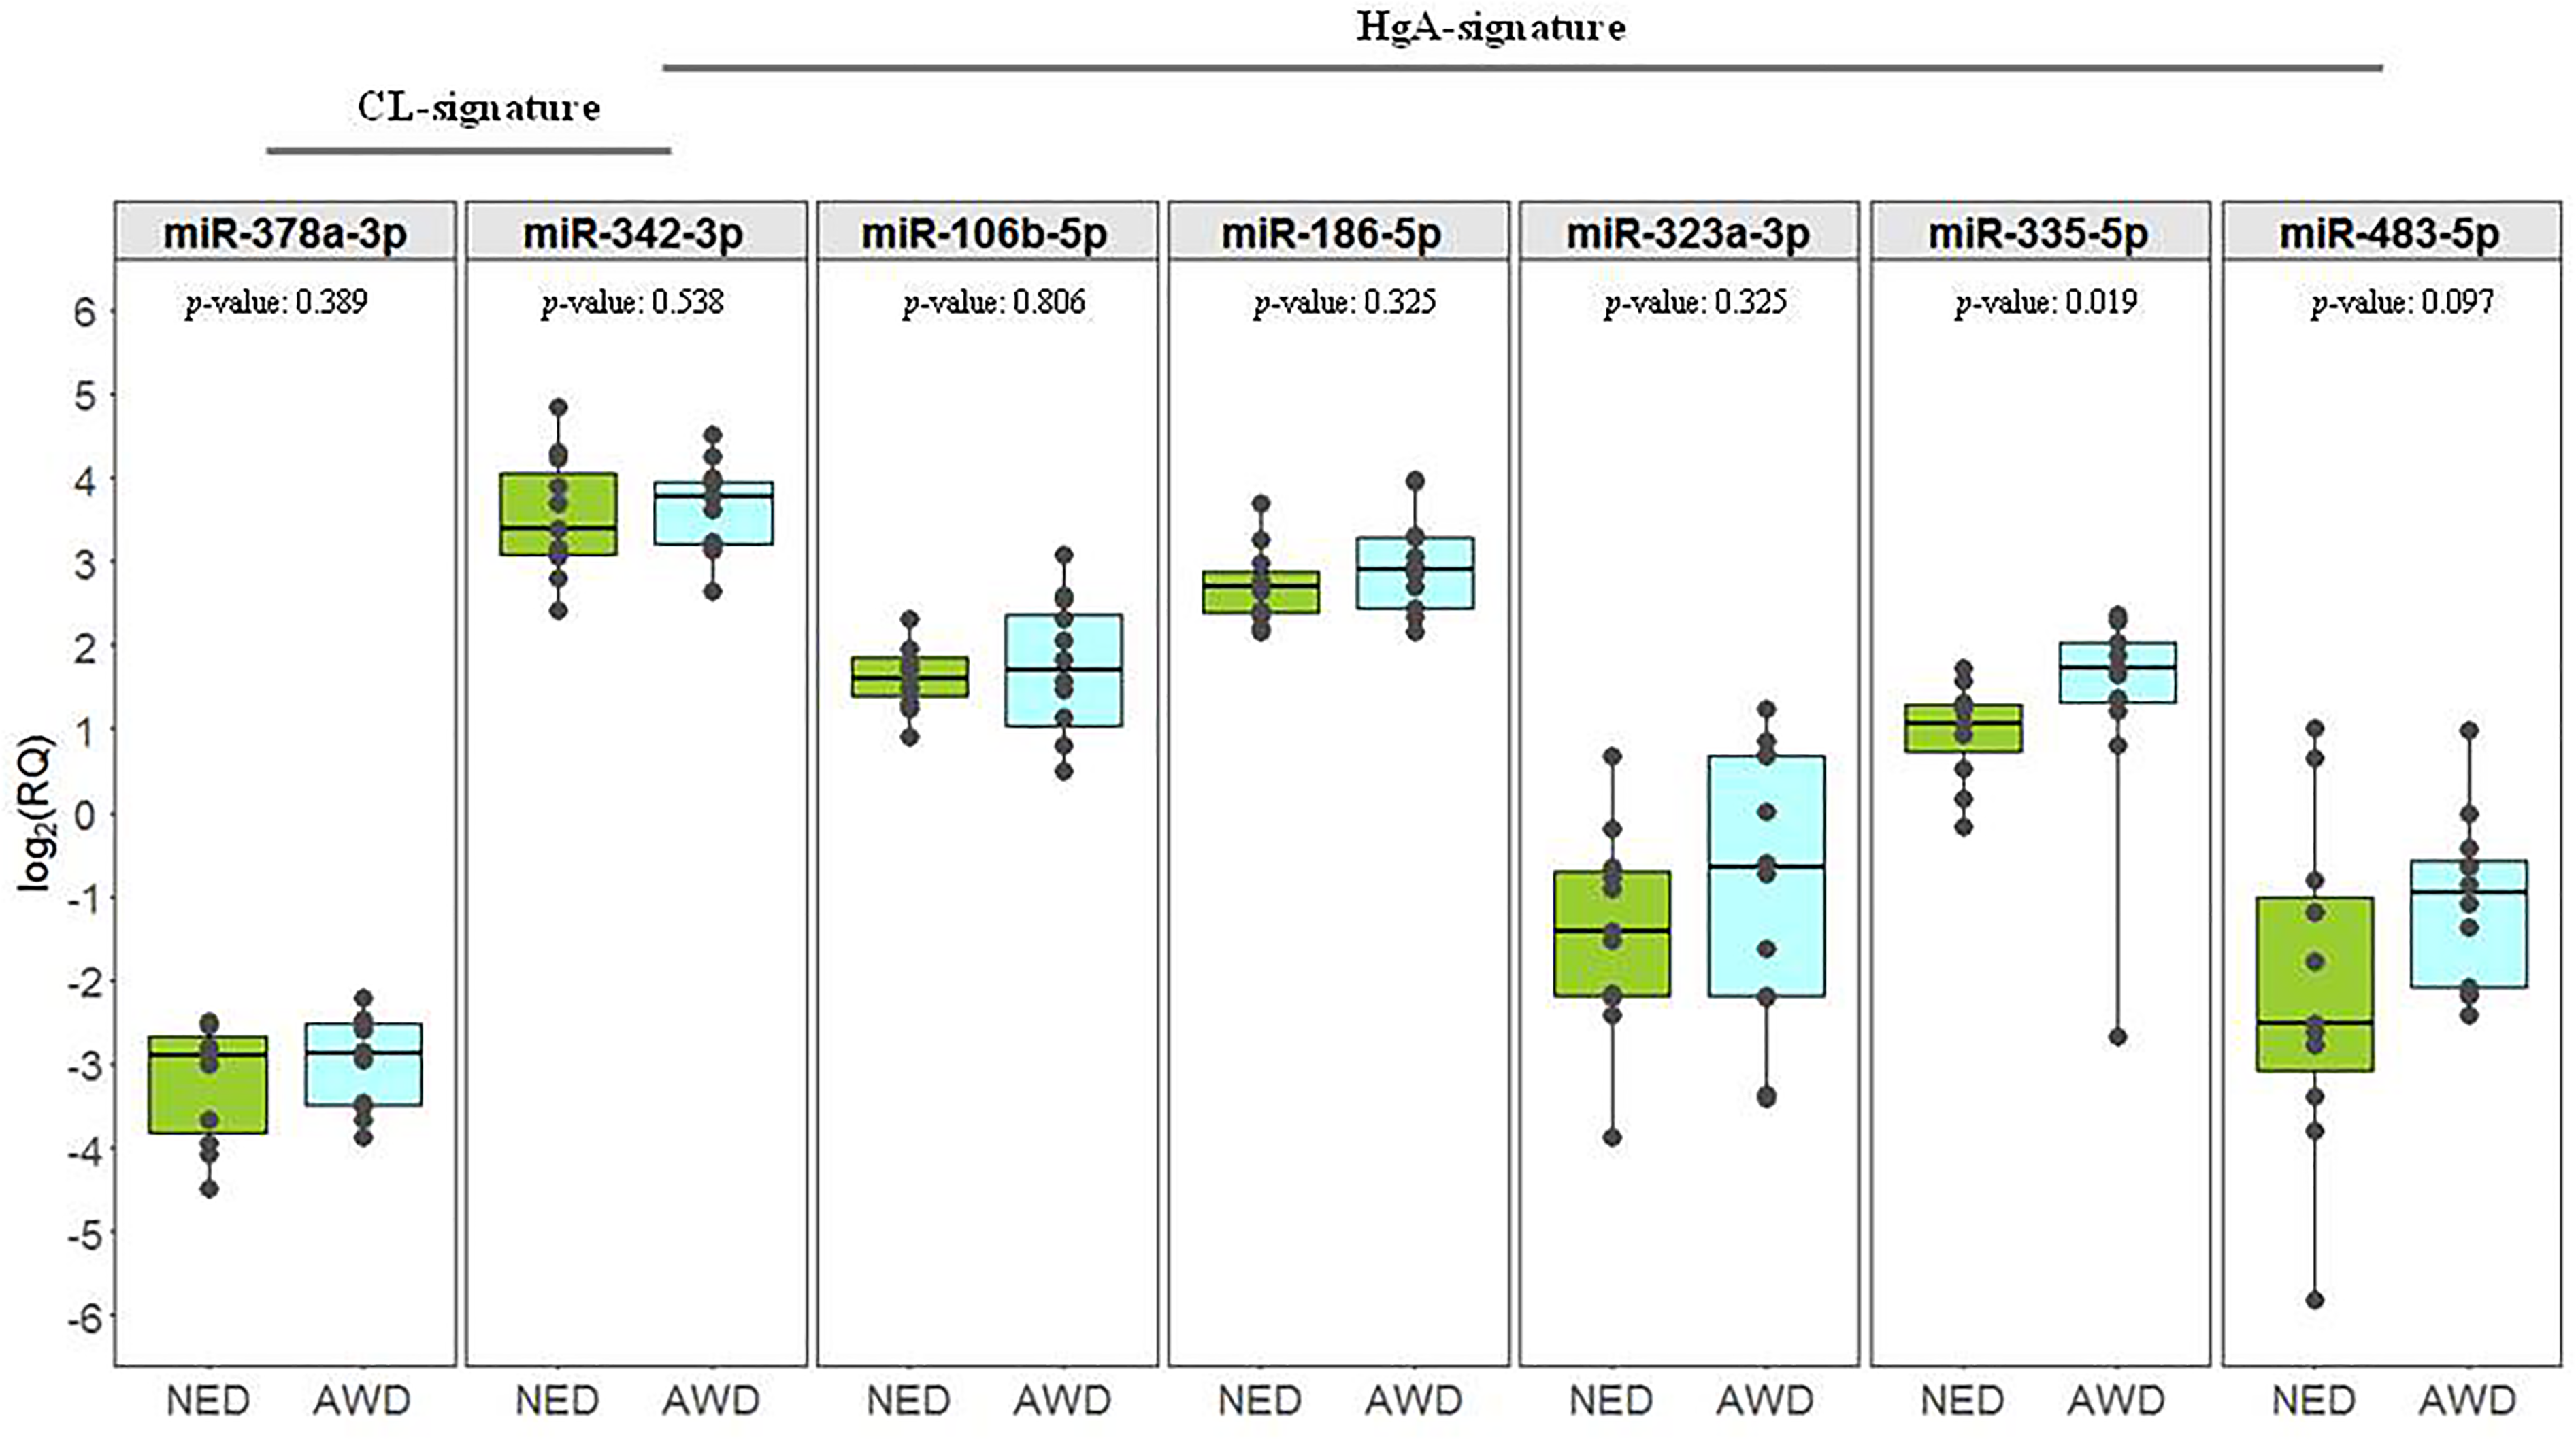
Expression profiles of the miRNAs from the CL (miR-378a-3p and miR-342-3p) and HgA (miR-342-3p, miR-106b-5p, miR-186-5p, miR-323a-3p, miR-335-5p and miR-483-5p) signatures pre-surgery. Boxplot representing the expression pre-surgery (T0) of the miRNAs in NED and AWD patients. Each box indicates the 25th and 75th centiles of the distribution. The horizontal line inside the box indicates the median and the whiskers indicate the extreme measured values; individual data are represented by dots. The reported p-values refer to the Kruskal–Wallis test.
T0 and T1 expression profiles
Comparison of the expression levels of the two miRNAs from the CL signature at T0 and at the first follow-up visit within 12 months of surgery (T1) on the overall data set (n = 13 patients) showed a reduction for both miRNAs in terms of log2 (RQ). This reduction was significant for miR-342-3p (WSR p-value = 0.048), while miR-378a-3p had a p-value of 0.094. When samples were evaluated according to their disease status assessed at T1 (six patients were AWD and seven NED) the trend observed for miR-378a-3p was retained in the NED subgroup (WSR p-value = 0.078), while no significant results were obtained for miR-342-3p (Figure 2). Regarding the miRNAs from the HgA signature, apart from the reduction of miR-342-3p (which is in common with the CL signature), only a trend of reduction for miR-323-3p (WSR p-value = 0.080) was observed on the overall set of data. No statistically significant differences were observed in the NED and AWD subgroups.
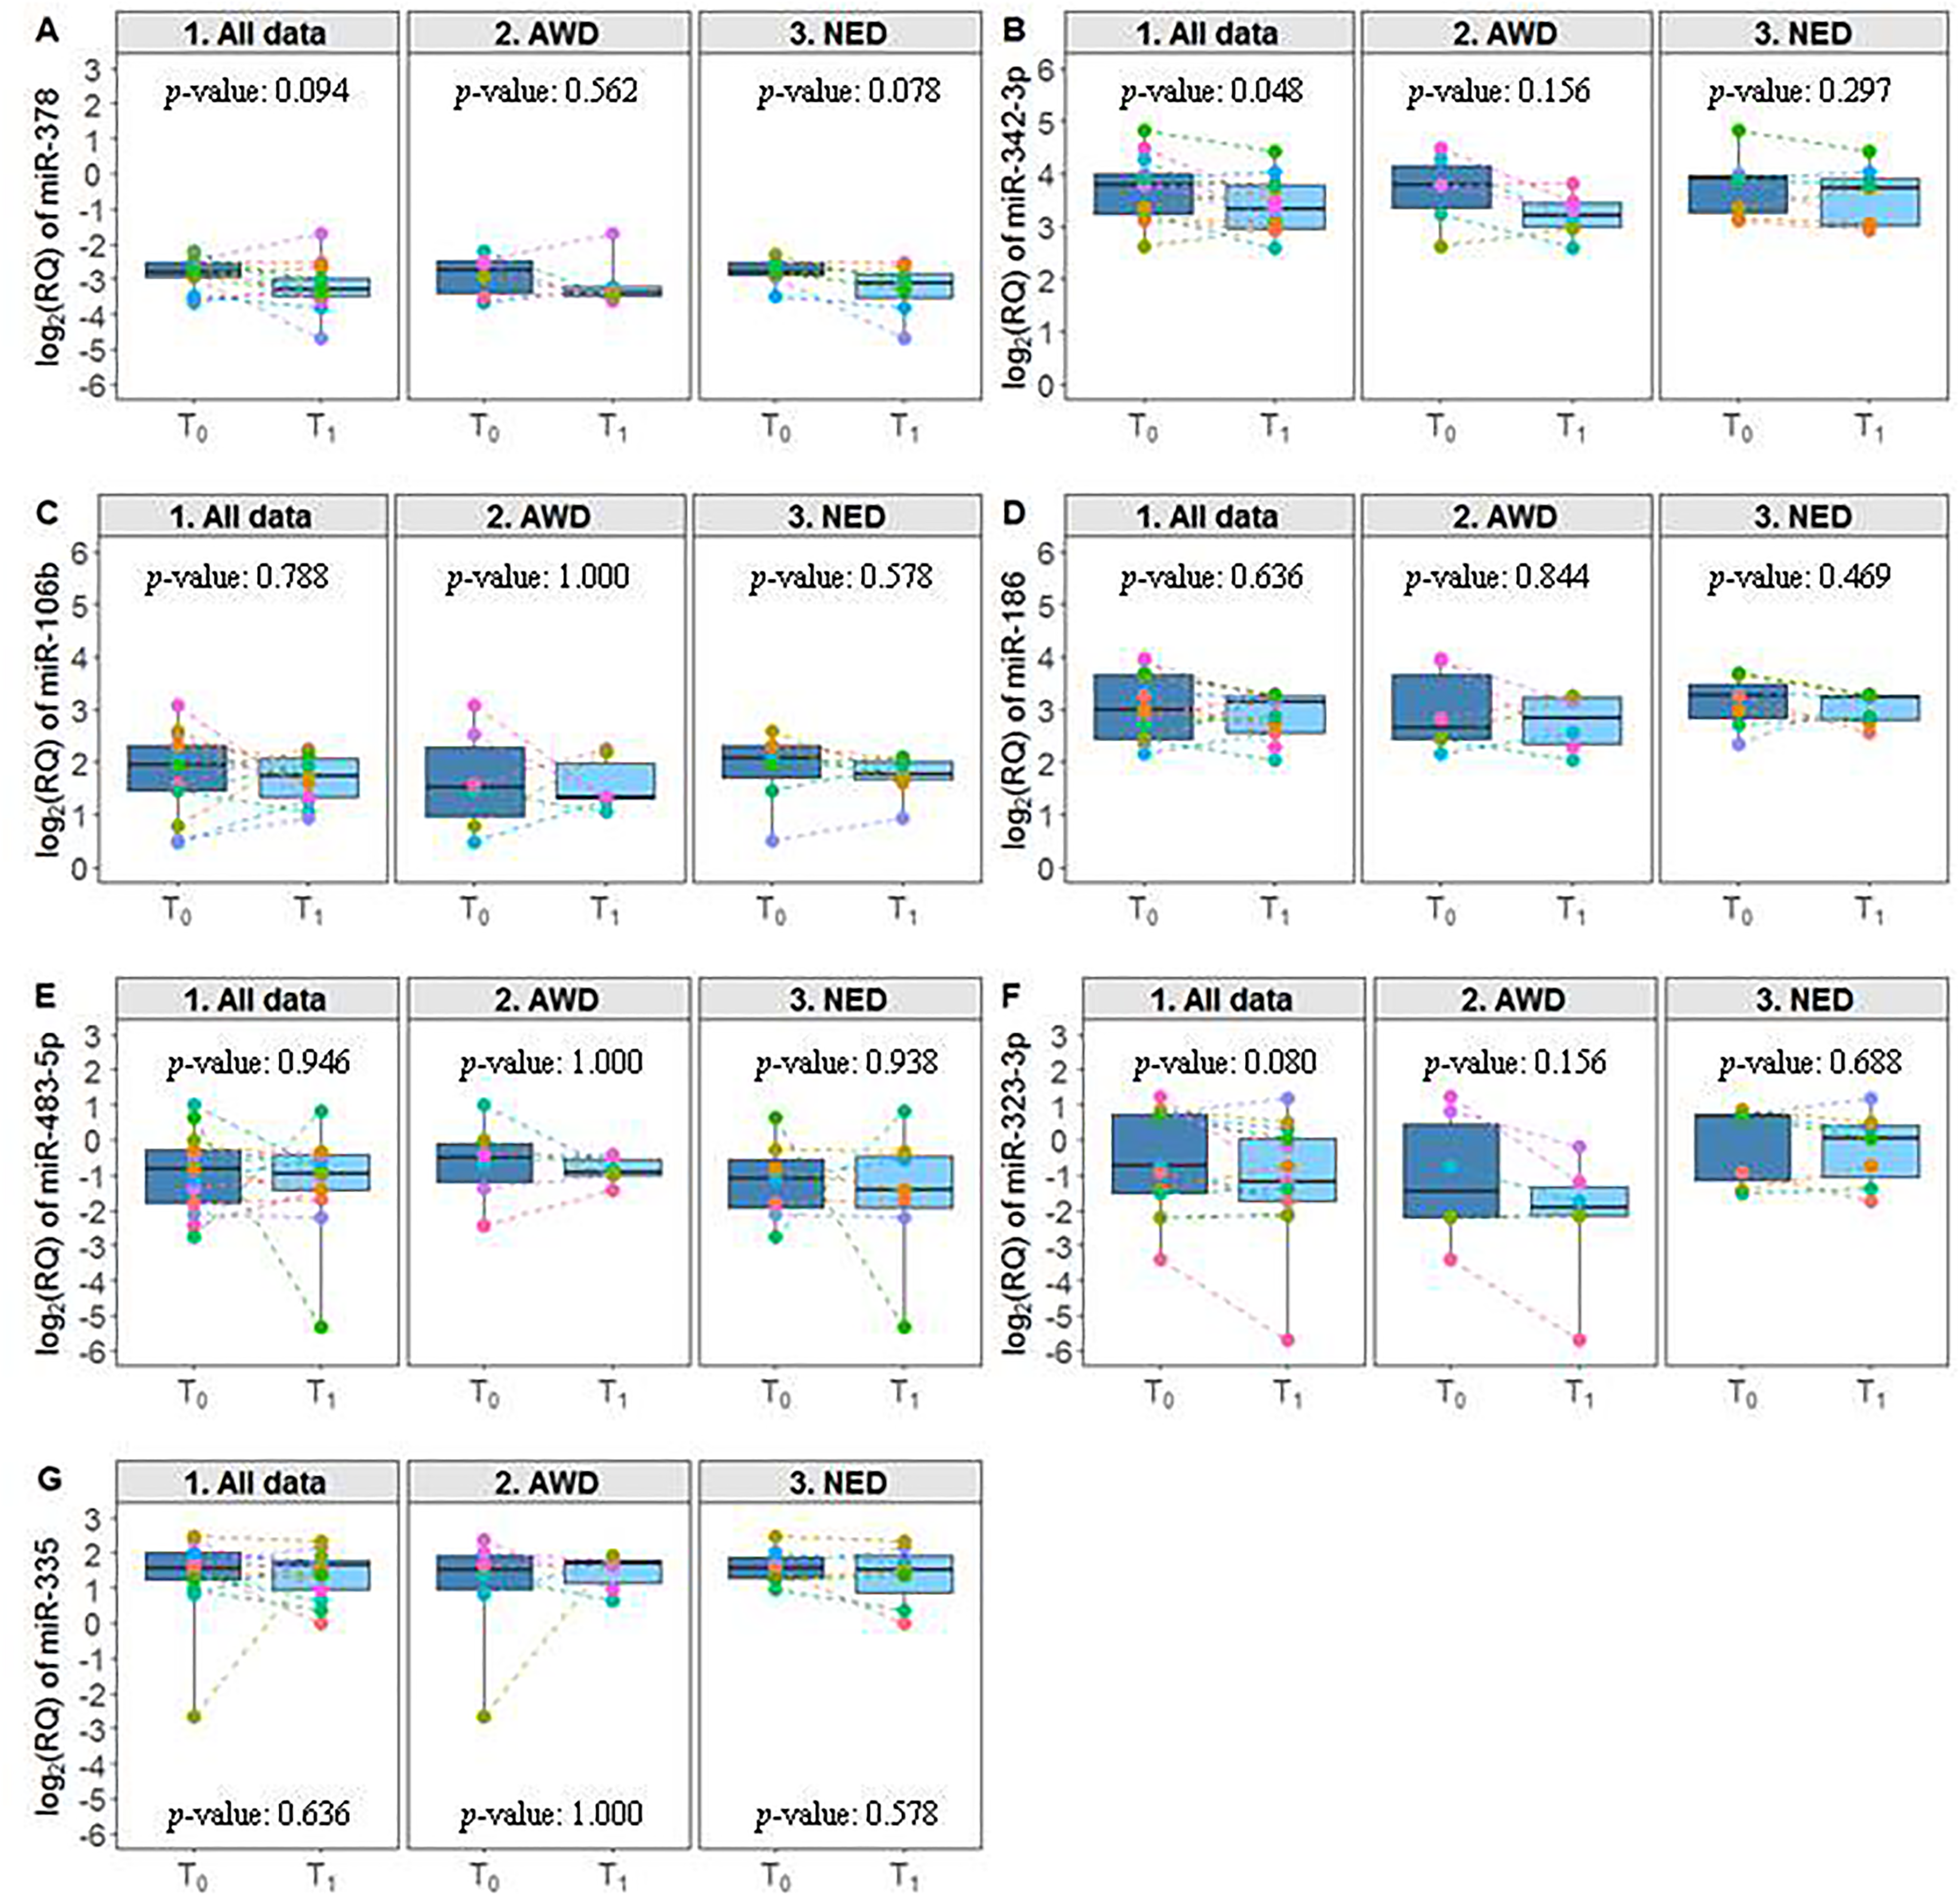
Expression profiles of the miRNAs at T0 and T1. Boxplot representing the expression at T0 and T1 of the miRNAs included in the CL and HgA signatures considering all available data (n = 13) and grouping patients according to their disease status at T1 (AWD, n = 6; NED, n = 7). Each box indicates the 25th and 75th centiles of the distribution. The horizontal line inside the box indicates the median and the whiskers indicate the extreme measured values; individual data are represented by dots. The reported p-values refer to the Wilcoxon signed-rank test.
Pre- and post-surgery expression profiles
Considering the overall cohort of patients, no significant trends of expression were observed for the miRNAs of both the signatures. The analysis performed on the AWD (n = 12) and NED (n = 11) subgroups showed a significant reduction after surgery of miR-323-3p (WSR p-value = 0.021) in the AWD subgroup, and an increase of miR-106b-5p in the NED subgroup (WSR p-value = 0.080) (Figure 3).
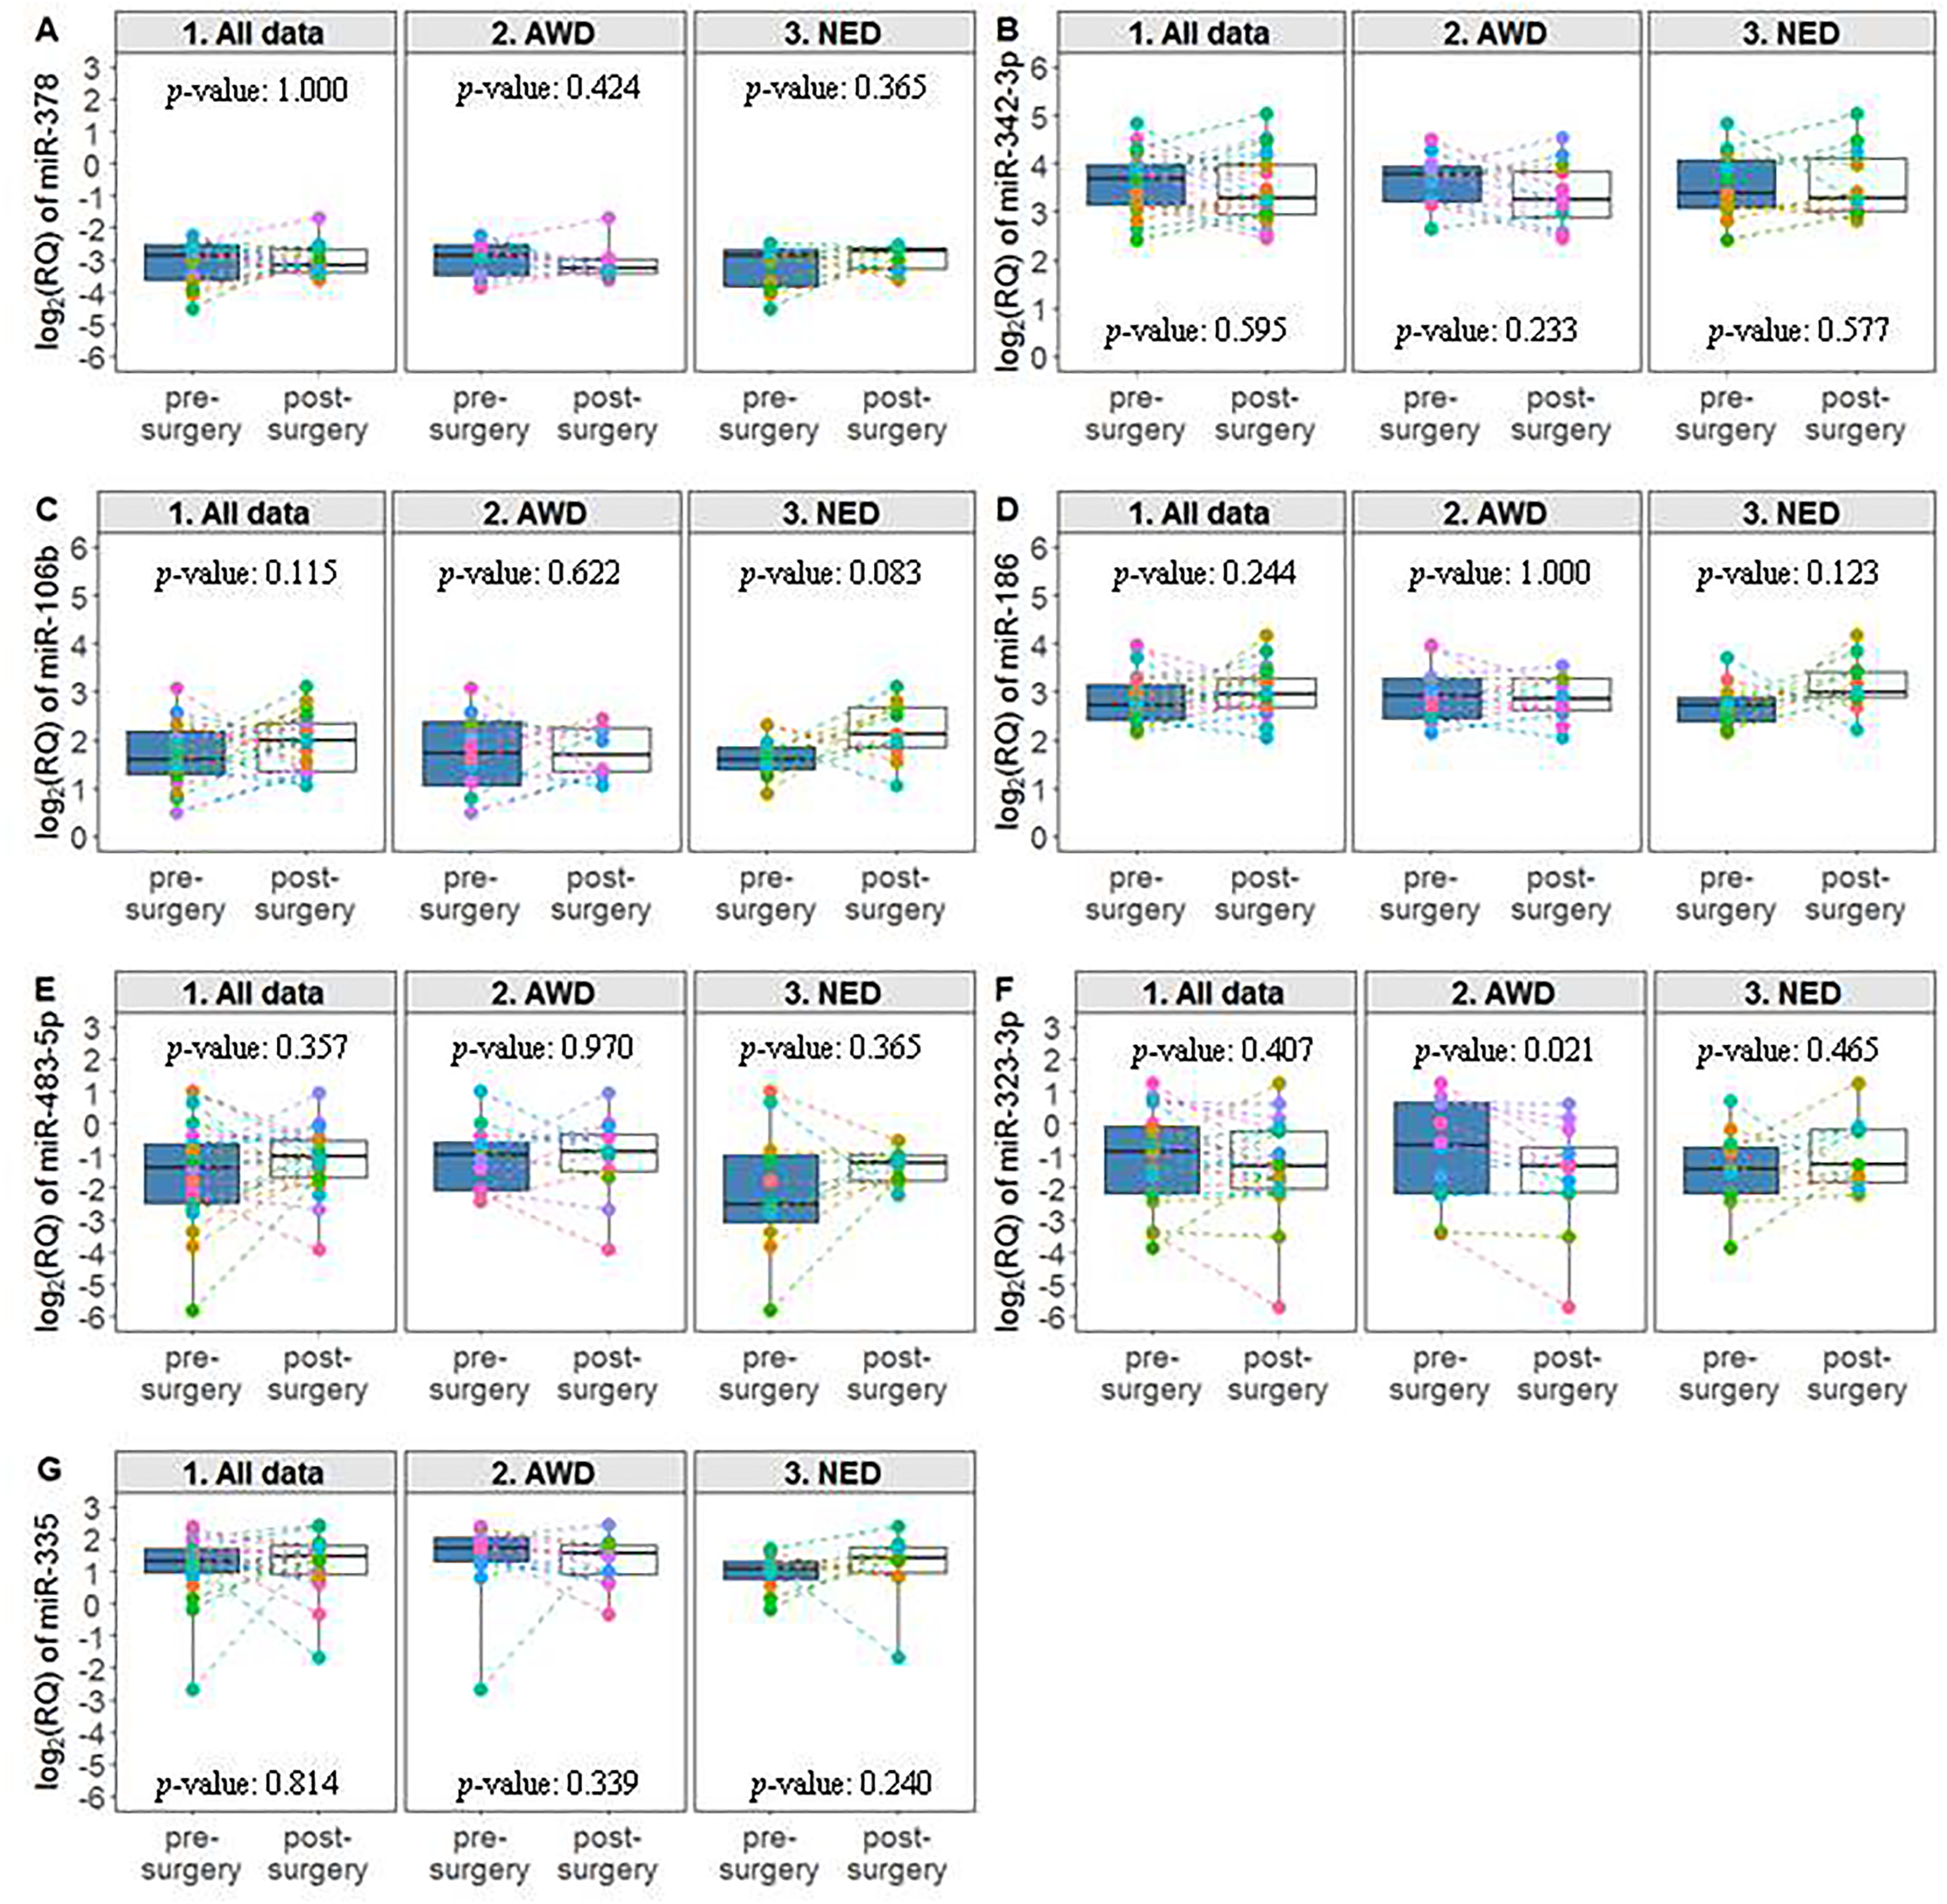
Expression profiles of the miRNAs pre- and post-surgery. Boxplot representing the expression of the miRNAs included in the CL and HgA signatures pre- and post-surgery (first relapse, whenever it occurred within 36 months, for the AWDs or data at least at the 36 months for the NEDs) considering all available data (n = 23) and according to their disease status (AWD, n = 12; NED, n = 11). Each box indicates the 25th and 75th centiles of the distribution. The horizontal line inside the box indicates the median and the whiskers indicate the extreme measured values; individual data are represented by dots. The reported p-values refer to the Wilcoxon signed rank test.
Discussion
We investigated the ability of predicting the recurrence of miRNAs from two plasma signatures that we identified as being linked to the presence of colon cancerous lesions in the context of a CRC screening program 11 when tested longitudinally in the plasma of patients with resectable CRC. The identification of new biomarkers for predicting recurrence is still an urgent clinical need in CRC as there are no reliable methods to discriminate patients who will relapse and who could benefit from adjuvant treatment, from those already cured with only surgery. As a result, some patients would go untreated, while others would receive unnecessary treatment-related toxicity. Several studies have shown that miRNA-based biomarkers have higher accuracy than currently available diagnostic tools. The results of our previous study in a large multicenter set of plasma samples from FIT + subjects also provided proof of concept that miRNAs are detectable and easily evaluable in plasma. Moreover, miRNAs have shown promise in identifying the presence of both pre-cancerous and cancerous endoscopic lesions. 11 We longitudinally structured a prospective collection of 180 CRC patients before surgery and during post-operative follow-up across 36 months. Among these 180 patients, the 12 who relapsed during follow-up were tested for the two signatures, along with an equal number of patients without relapse for at least 36 months. The signature predicting the presence of cancer in the FIT case study (CL signature) did not predict relapse in this considered case series, and before surgery the expression levels of its two miRNAs, miR-342-3p and miR-378a-3p, were similar in NED and AWD subjects. One year after surgery, both miRNAs had decreased: compared to levels pre-surgery, miR-342-3p was statistically significant and miR-378a-3p almost reached significance. This trend was retained by miR-378a-3p in the NED subgroup, confirming our previous results on another cohort of plasma samples from stage II–IV CRC patients, 10 and supporting the use of miR-378a-3p as biomarker for monitoring recurrence in CRC. miR-342-3p, which was not in the list of miRNAs we tested in the previous study, 10 may not have been validated due to the small size of the series analyzed.
Among the 180 patients enrolled, a small number had relapse, which probably prevented the validation of the results over the longest time. Despite these limitations, the results further support the role of the two miRNAs of the CL signature in detecting CRC presence and their potential development as biomarkers for this tumor. As discussed in Zanutto et al., 11 both miRNAs have been proposed as biomarkers for several cancers and have tumor suppressor functions in CRC.13–15
Based on the hypothesis that miRNAs present at the early stages of CRC development may also be expressed in cancerous lesions, we also analyzed the miRNAs of the HgA signature, predictive of the presence of high-grade adenomas in the FIT study. 11 This analysis highlighted a potential role of miR-335-5p in distinguishing patients who will relapse. Plasma levels of this miRNA were found to be significantly higher in CRC patients than in controls. 16 The presence of this miRNA in the plasma of CRC patients is supported by a recent paper showing that miR-335-5p is released, through exosomes, from CRC cell lines and that its levels are higher in exosomes released from metastatic cell lines than in less aggressive cells. 17 This finding could be related to its increased expression observed in relapsed patients and suggests further investigation into a possible role of miR-335-5p as biomarker of relapse. Another miRNA from the HgA signature, miR-323-3p, significantly decreased post-surgery in AWD patients who relapsed within 36 months from surgery. This miRNA also showed a trend of reduction on the overall dataset 1 year after surgery. Interestingly, miR-323-3p suppresses the expression of SMAD2 and SMAD3 in pancreatic cancer, leading to the inactivation of TGF-β signaling. 18 Its function in CRC and its potential use as biomarker for recurrence need further analyses.
Our results, although on a limited number of cases, confirm that some miRNAs from the signatures related to the presence of endoscopic lesions within FIT + subjects can detect CRC, supporting the use of plasma circulating miRNAs as biomarkers to identify the patients at higher risk of relapse or for monitoring recurrence. Further prospective studies in larger cohorts are needed, allowing the recruitment of a greater number of relapsing cases to confirm the performance of the three miRNAs identified and to fully assess their clinical utility, also respect to the known clinical pathologic factors related to the disease.
Footnotes
Acknowledgments
The authors wish to thank the research nurses Giulia Saba and Martina Stroscia at the Fondazione IRCCS Istituto Nazionale dei Tumori di Milano who looked after all the individuals enrolled in the study. The authors also acknowledge with much appreciation all the individuals who agreed to participate in the study.
Authors contributions
Conceptualization: SZ, MAP, PV, MG1 and MG2; methodology: SZ, CMC, AB, VD, LT, MG1 and MG2; software: CMC and PV; validation, SZ, CMC, VD and LT; formal analysis: CMC, MG1 and PV; investigation: SZ, CMC, PV, MG1 and MG2; data curation: MG1, LB and CMC; writing original draft: SZ, CMC, PV and MG2; writing, review, and editing: SZ, CMC, AB, VD, LT, LV, MAP, PV, LB, MG1 and MG2; visualization: SZ, CMC, AB, VD, LT, LV, MAP, PV, LB, MG1 and MG2; supervision: MAP, PV and MG2; project administration: SZ, CMC and MG2; funding acquisition: SZ and MG2. SZ and CMC are equally contributing co-first authors; PV, MG1, and MG2 are equally contributing co-last authors. All authors have read and agreed to the published version of the manuscript.
Declaration of conflicting interests
The author(s) declared no potential conflicts of interest with respect to the research, authorship, and/or publication of this article.
Funding
This research was funded by the Italian Association for Cancer Research (AIRC), Special Program “Innovative Tools for Cancer Risk Assessment and early Diagnosis,” 5 × 1000 (M. Gariboldi) grant number 12162 and by funds obtained through an Italian law that allows taxpayers to allocate 0.5 percent of their income tax to a research institution of their choice. The author(s) also disclosed receipt of the following financial support for the research, authorship, and/or publication of this article: This work was supported by funds obtained through an Italian law that allows taxpayers to allocate 0.5 percent of their income tax to a research institution of their choice.