
Abstract
Background
The clinical value of serum α-fetoprotein (AFP) to detect hepatocellular carcinoma (HCC) has been questioned due to its low sensitivity and specificity. Other than AFP, several new serum biomarkers including glypican-3 (GPC3), des-γ-carboxy prothrombin (DCP), α-L-fucosidase enzyme (AFU) and vascular endothelial growth factor (VEGF) have been identified as useful HCC markers.
Material and methods
A systematic search on PubMed, Web of Science and others was performed. Twenty-six case-control studies on HCC-related biomarkers published from 2000 to 2014 were included in this analysis. Data on sensitivity and specificity of tests were extracted and analyzed using the Meta-DiSc 1.4 statistical program. Fixed or random-effects models were used depending on the absence or presence of significant heterogeneity. Summary receiver operating characteristic (sROC) curves were obtained to evaluate the accuracy of the studied markers.
Results
The areas under the sROC curve of AFP, GPC3, DCP, AFU, VEGF and the combination of each of the last 4 markers with AFP were 0.869, 0.928, 0.832, 0.851, 0.834, 0.964, 0.972, 0.873 and 0.948, respectively. A combination of AFP+GPC3, AFP+DCP or AFP+VEGF was superior to AFP alone in detecting HCC. The area under the sROC curve of GPC3 alone was significantly higher than that of AFP, whereas the areas of DCP, AFU and VEGF were comparable to that of AFP.
Conclusions
GPC3, DCP, AFU and VEGF are suitable markers for HCC, and their determination with AFP may prove to be useful in the diagnosis and screening of HCC.
Introduction
Hepatocellular carcinoma (HCC) comprises nearly 6% of all incident cancer cases worldwide, with the overwhelming majority occurring in the developing world (1). HCC is the third most frequent cause of cancer mortality among men worldwide and the second in Egypt (2). HCC incidence is strongly linked to hepatitis B virus (HBV) and hepatitis C virus (HCV) (3).
α-Fetoprotein (AFP) is a marker widely used for diagnosis of HCC. At a cutoff value of 20 ng/mL, serum AFP shows 60%-80% sensitivity (4). In addition, a significant increase in serum AFP level (20-200 ng/mL) was detected in a considerable number of patients with chronic liver disease which decreases AFP specificity (5).
Glypican-3 (GPC3) is a heparin sulfate proteoglycan that interacts with several growth factors by binding to the cell membrane via glycosylphosphatidylinositol anchors (6). It plays an important role in cell growth, differentiation and migration (7). It has been detected in HCC cells but not in benign liver tissues (8). Some studies investigated the role of GPC3 as a marker for detection of HCC (9–10–11–12–13–14).
Prothrombin induced by vitamin K absence-II (PIVKA-II) is an abnormal protein that is increased in the serum of HCC patients as a result of an acquired defect in the posttranslational carboxylation of the prothrombin precursor in malignant cells (15). Many studies have shown that PIVKA-II has higher sensitivity and specificity compared with AFP in differentiating HCC from other chronic liver diseases (16–17–18).
α-L-Fucosidase (AFU) is a lysosomal enzyme present in all mammalian cells and hydrolyzes sugars containing L-fucose (19). AFU has been proposed as a tumor marker since many studies reported higher activity in serum of HCC patients compared with benign hepatic diseases (20–21–22–23–24–25).
Being a highly vascular tumor, HCC needs angiogenesis for its progression. Vascular endothelial growth factor (VEGF) is a potent angiogenic factor enhancing the growth of HCC (26). High serum levels of VEGF were recorded in patients with HCC (21, 27–28–29).
Meta-analyses have been reported regarding markers of HCC in many populations (30–31–32), but in fact no article about tumor markers of HCC in the Egyptian population is available until now. The aim of this work was to study the above-mentioned markers in Egyptian patients with HCC, as a first meta-analysis.
Materials and Methods
Literature search
A literature search was carried out using PubMed and Science Direct websites, restricted to articles in the period between 2000 and 2014. The search terms were as follows: hepatocellular carcinoma, HCC, liver cancer, AFP, des-γ-carboxy prothrombin, PIVKA-II, α-L-fucosidase, glypican, VEGF, tumor markers, diagnosis, early detection, Egyptian patients. All articles considered were in English. Additional studies were identified via a manual review of the reference lists of studies identified and review articles.
Inclusion and exclusion criteria
Studies were included if they met the following inclusion criteria: (i) they evaluated the performance of AFP for the diagnosis of HCC alone or combined with other biomarkers; (ii) the diagnosis of HCC was made based on histological examination or by the appropriate imaging characteristics as defined by accepted guidelines (33); (iii) they detected marker concentration in serum only; (iv) they were performed on Egyptian patients only and mainly on HCC but not other types of cancer. The following exclusion criteria were set: (i) markers were measured in urine, plasma or in tissues; (ii) the study investigated tumors other than HCC; (iii) the study was performed on a population other than Egyptians; and (iv) any study on animal.
Data Extraction
Two reviewers (the author and Prof. M. S. Ali, professor of cancer genetics, magdyaly@yahoo.com) independently assessed eligible articles for inclusion. Disagreements were resolved by discussion. The following data were collected from each study: authors, publication year, journal, publication type and language, number of cases (true positive + false negative) and controls (true negative + false positive), the cutoff values of markers, the method of assay and the characteristics of the control group. The main features of the trials included in the meta-analysis are shown in Table I. The study was designed according to Meta-analysis of Observational Studies in Epidemiology (MOOSE) guidelines (43).
Characteristics Of Studies Included
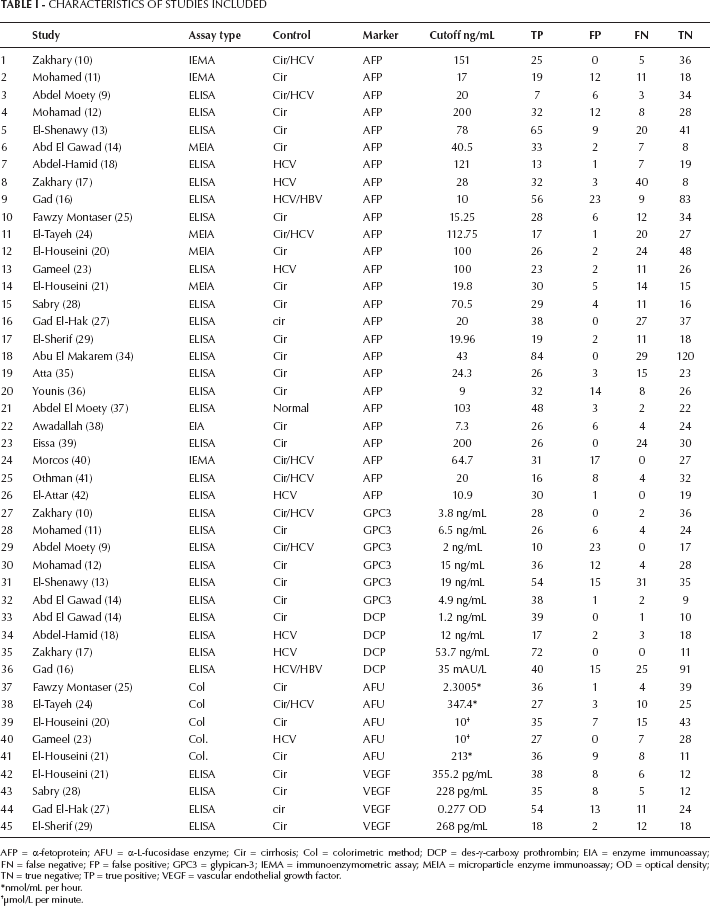
AFP = α-fetoprotein; AFU = α-L-fucosidase enzyme; Cir = cirrhosis; Col = colorimetric method; DCP = des-γ-carboxy prothrombin; EIA = enzyme immunoassay; FN = false negative; FP = false positive; GPC3 = glypican-3; IEMA = immunoenzymometric assay; MEIA = microparticle enzyme immunoassay; OD = optical density; TN = true negative; TP = true positive; VEGF = vascular endothelial growth factor.
nmol/mL per hour.
μmol/L per minute.
Statistical analysis
The statistical program Meta-DiSc 1.4 was used for analysis. Sensitivities and specificities of the studies included were logistically transformed according to the following formula:
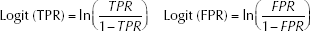
where TRP is the true-positive ratio and FRP, the false-positive ratio.
A linear regression line was fitted through the resulting points according to the following equation:
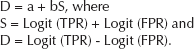
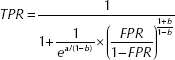
After obtaining the values of a and b from the regression line, the line was then back-transformed to obtain the summary receiver operating characteristic (sROC) curve, according to the method described by Moses et al (44) using the equation
A conventional ROC curve describes the impact of a threshold in a single patient population. The sROC curve, a compact description of the accuracy of the diagnostic test, describes the test in many populations.
As a potential cause of heterogeneity, any threshold/cutoff effect was tested with the Spearman correlation coefficient. Heterogeneity induced by factors other than threshold/cutoff effect was assessed by means of Cochran's Q method and by the test of inconsistency (I²). If the results of the Q test had no significant heterogeneity, the Mantel-Haenszel fixed-effect model was used for the combined data. If the results of the Q test had significant heterogeneity, the DerSimonian-Laird random-effects model was used for the combination of data (45). Pooled estimates including sensitivity, specificity, positive and negative likelihood ratios and diagnostic odds ratio (DOR) were presented as a standard plot with 95% confidence intervals (95% CIs). Potential publication bias was assessed with the Egger's and Begg's tests and represented graphically with funnel plots of the DOR versus its standard error (46, 47). All p values are 2-sided. A p value less than 0.05 was considered significant.
Results
Literature assessment
This meta-analysis included 26 case-control studies regarding AFP in addition to others as a marker of HCC in Egyptian population. The articles included 1,137 patients with HCC and 961 controls. The controls were mostly patients with cirrhosis, HCV or HBV, with a very small percentage of healthy persons (Tab. I). Six of the 26 studies included GPC3 studies in addition to AFP (235 patients, 206 controls). Four articles studied des-γ-carboxy prothrombin (DCP) as a marker in addition to AFP (197 patients, 147 controls). Five articles studied AFU (205 patients, 166 controls), and four articles studied VEGF (179 patients, 97 controls) in combination with AFP. The rest of the 26 articles (9 articles) studied other markers, but they could not be included in the present meta-analysis because fewer than 3 studies were available for the same marker, and thus the statistical analysis was not valid.
Analysis of the markers studied
AFP
After analysis using the random-effects model, the pooled sensitivity and specificity of AFP were 71% (95% CI, 69%-74%) and 85% (95% CI, 83%-87%), respectively; the pooled positive likelihood ratio (PLR) and negative likelihood ratio (NLR) were 4.57 (95% CI, 3.37-6.2) and 0.33 (95% CI, 0.28-0.41), respectively; and the pooled DOR was 18.6 (95% CI, 11.9-28.9) (Tab. II). Figure 1 shows the pooled estimates of AFP, and Figure 2 shows the sROC curve for the diagnostic accuracy of AFP, the area under the curve (AUC) was 0.869. The Q value was 0.801, at which TPR = 1-FPR. At this point, AFP showed a significant ln DOR (2.77, p=0.000), indicating the test's accuracy in discriminating cases from noncases (Tab. III).
Sensitivity, Specificity, Positive Lr, Negative Lr And Dor For Afp And Other Markers Alone And In Combination With Afp
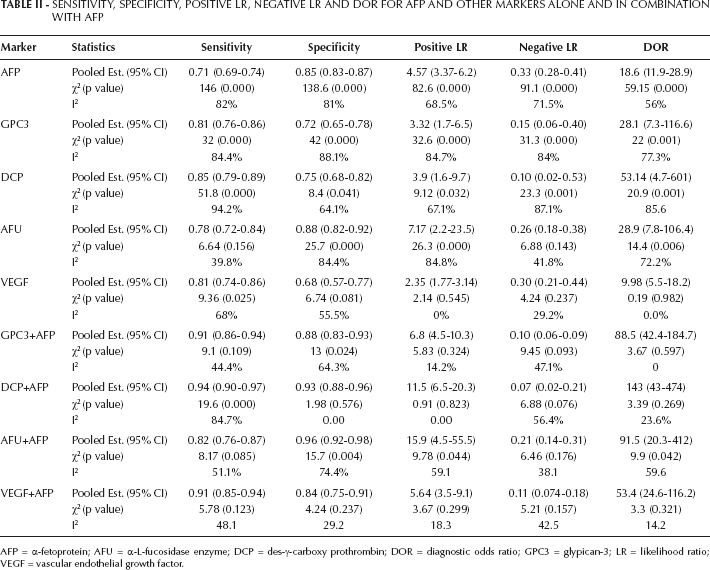
AFP = α-fetoprotein; AFU = α-L-fucosidase enzyme; DCP = des-γ-carboxy prothrombin; DOR = diagnostic odds ratio; GPC3 = glypican-3; LR = likelihood ratio; VEGF = vascular endothelial growth factor.
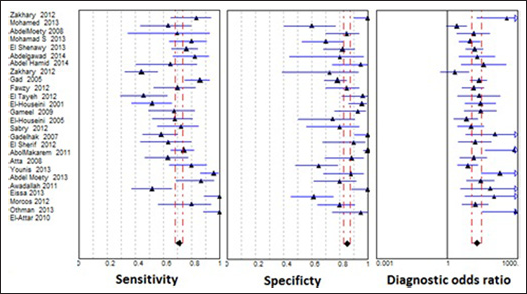
Forest plots of sensitivity, specificity and diagnostic odds ratio (DOR) of α-fetoprotein (AFP) as a marker of hepatocellular carcinoma (HCC). The two dashed lines represent the 95% confidence intervals.
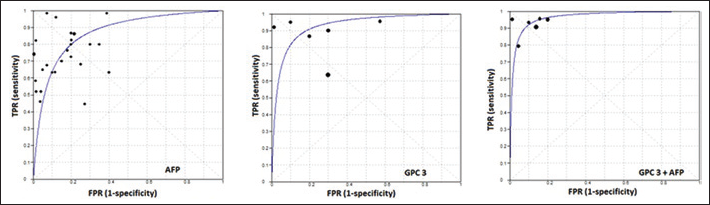
Summary receiver operating characteristic (ROC) curves for α-fetoprotein (AFP), glypican-3 (GPC3) and combination of AFP and GPC3. The points of intersection with the antidiagonal Q were 0.801, 0.863 and 0.911, respectively. The areas under the sROCs were 0.869, 0.928 and 0.964, respectively. FPR = false-positive ratio; TPR = true-positive ratio.
For heterogeneity testing, the Spearman correlation coefficient was 0.315, p=0.117, thus there was no effect of cutoff value. As analyzed with the heterogeneity Q method and the test of I², χ2=146, 138.6, 82.6, 91.1 and 59.15, respectively, with I² = 82%, 81%, 68.5%, 71.5% and 56%, for sensitivity, specificity, PLR, NLR and DOR, respectively, which suggested significant heterogeneity induced by factors other than the cutoff effect.
With respect to publication bias, both Begg's and Egger's tests indicated bias with AFP publications (p<0.01 in both). Figure 3 shows the funnel plot of AFP showing asymmetry, indicating publication bias since some points are outside the funnel.
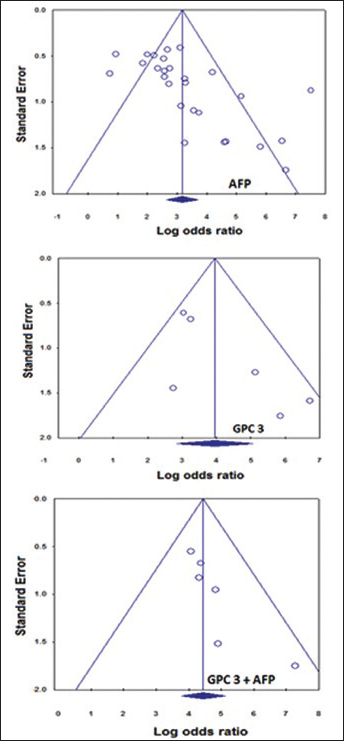
Funnel plots of α-fetoprotein (AFP; upper panel), glypican-3 (GPC3; middle panel) and both combined (lower panel). Publication bias was detected with AFP only and not with GPC3 or with their combination (p>0.05), according to Begg's and Egger's tests.
GPC3
The pooled sensitivity and specificity of GPC3 were 81% (95% CI, 76%-86%) and 72% (95% CI, 65%-78%), respectively; the pooled PLR and NLR were 3.32 (95% CI, 1.7-6.5) and 0.15 (95% CI, 0.06-0.40), respectively; and the pooled DOR was 28.1 (95% CI, 7.3-116.6). Figure 4 shows the forest plots of the pooled estimates of GPC3, and Figure 2 shows the sROC curve for the diagnostic accuracy of the marker, the AUC was 0.928. This area is significantly higher than that of AFP, indicating the superiority of GPC3 in diagnosis of HCC. The Q value was 0.863 at which GPC3 showed a significant ln DOR (3.69, p=0.000), indicating the test's accuracy in discriminating cases from noncases.
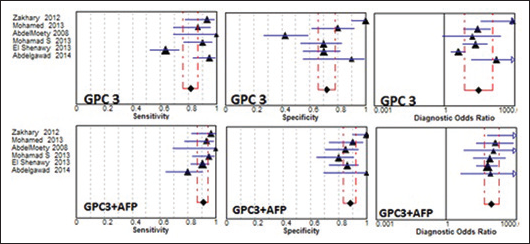
Forest plots of sensitivity, specificity and diagnostic odds ratio (DOR) of glypican-3 (GPC3; upper row) and GPC3 in combination with α-fetoprotein (AFP; lower row). The 2 dashed lines represent the 95% confidence intervals.
For heterogeneity testing, the Spearman correlation coefficient was 0.03, p=0.957, indicating no effect of cutoff value. For heterogeneity testing, χ2=32, 42, 32.6, 31.3 and 22, respectively, with I²=84.4%, 88.1%, 84.7%, 84% and 77.3% for sensitivity, specificity, PLR, NLR and DOR, respectively, which suggested significant heterogeneity induced by factors other than the cutoff effect, as seen with AFP.
With respect to publication bias, both Begg's and Egger's tests indicated no publication bias with GPC3 (p=0.06 and 0.07, respectively). Figure 3 shows the funnel plot for GPC3.
Combination of GPC3 and AFP had an improving effect on the pooled estimates, thus the sensitivity, specificity, PLR, NLR and DOR improved to 91% (95% CI, 86%-94%), 88% (95% CI, 83%-93%), 6.8 (95% CI, 4.5-10.3), 0.10 (95% CI, 0.06-0.19) and 88.5 (95% CI, 42.2-184.7), respectively. Heterogeneity chi square and I2values were also reduced, to 9.1, 13, 5.83, 9.45 and 3.67, respectively, and 44.4%, 64.3%, 14.2%, 47.1% and 0%, respectively. Nonsignificant heterogeneity was observed with all pooled estimates (p<0.05) except for the specificity of the combination of GPC3 and AFP (p=0.024) (Tab. II).
Figure 4 shows the forest plots of the pooled estimates of GPC3 combined with AFP, and Figure 2 shows the sROC curve for the diagnostic accuracy of both markers; the AUC was 0.964. This value is significantly higher than that of AFP, indicating the superiority of GPC3+AFP in diagnosis of HCC. The Q value was 0.911, at which there was a significant ln DOR (4.656, p=0.000), indicating the combined test's accuracy in discriminating cases from noncases.
DCP
The pooled sensitivity and specificity of DCP were 85% (95% CI, 79%-89%) and 75% (95% CI, 68%-82%), respectively; the pooled PLR and NLR were 3.9 (95% CI, 1.6-9.7) and 0.1 (95% CI, 0.02-0.53), respectively; and the pooled DOR was 53.14 (95% CI, 4.7-601). The area under the sROC curve for DCP was 0.832. This area was not significantly different from that of AFP. The Q was 0.762, at which DCP showed a significant ln DOR (2.31, p=0.01), indicating the test's accuracy in discriminating cases from noncases.
For heterogeneity testing, the Spearman correlation coefficient was -1.0, p=1.00, indicating a significant effect of cutoff value; χ2=51.8, 8.4, 9.12, 23.3 and 20.9, respectively, with I²=94.2%, 64.1%, 67.1%, 87.1% and 85.6%, for sensitivity, specificity, PLR, NLR and DOR, respectively, which suggested significantly heterogeneity induced by factors other than the cutoff effect.
With respect to publication bias, Begg's test indicated no publication bias with DCP (p=0.308), whereas Egger's test indicated a publication bias (p=0.028).
Combination of DCP and AFP had an improving effect on the pooled estimates and the ln DOR (4.98, p=0.008), as was the case with GPC3 (Tab. II). The area under the sROC was improved to 0.972 which was significantly higher than that of AFP.
AFU
With respect to the heterogeneity of AFU, it was not detected in the pooled sensitivity (78%, 95% CI, 72%-84%) where χ2=6.64 and p=0.156; the value of I2 was 39.8%, indicating no heterogeneity. The same result was obtained with the NLR (χ2=6.88, p=0.143), with a value of I2 = 41.8% (Tab. II). The other pooled estimates (specificity, PLR and DOR) showed heterogeneity. The area under the sROC was 0.851 which was comparable to that of AFP. Ln DOR was 2.59 (p=0.01), and Q=0.871. No publication bias was observed with AFU according to Spearman correlation coefficient (r=-0.2, p=0.747) and Begg's and Egger's tests (p>0.05 in both). Combination of AFU and AFP improved the area under the sROC to 0.873, but this was nonsignificantly higher than AFP.
VEGF
The pooled estimates for VEGF and its combination with AFP are present in Table II. Heterogeneity was observed with the sensitivity of VEGF alone (χ2=9.36, p=0.025, I2=68%) but neither with the other pooled estimates of the marker alone nor with the same estimates for a combination with AFP. The area under the sROC was 0.834 which improved significantly to 0.948 after combination with AFP. No publication bias was observed with VEGF (Tab. III).
Moses’ Model (D = A + Bs), Area Under The Sroc Curve And Spearman Correlation Of Markers Studied
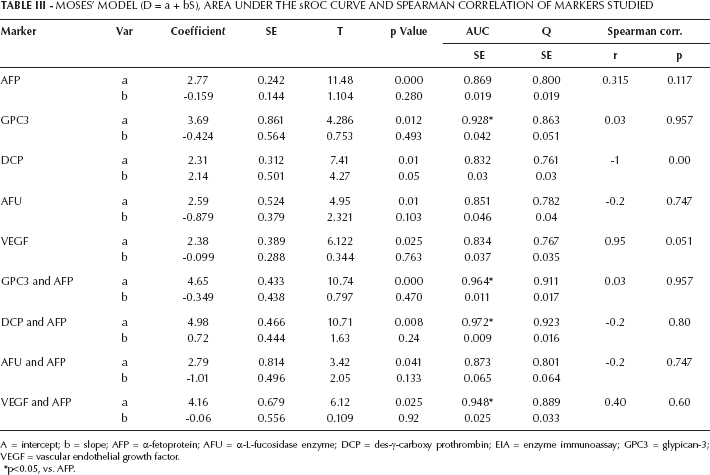
A = intercept; b = slope; AFP = α-fetoprotein; AFU = α-L-fucosidase enzyme; DCP = des-γ-carboxy prothrombin; EIA = enzyme immunoassay; GPC3 = glypican-3; VEGF = vascular endothelial growth factor.
p<0.05, vs. AFP.
Discussion
In the present meta-analysis, the overall sensitivity and specificity of the gold standard marker, AFP, was 71% (95% CI, 69%-74%) and 85% (95% CI, 83%-87%), respectively. This low sensitivity necessitates the use of other markers in addition to AFP to increase the sensitivity of HCC detection (14, 21, 24, 32), where nearly 30% of HCC patients studied had negative AFP results. Negative tests do not therefore mean absence of HCC, and patients with negative tumor marker results have a fairly high chance of having a malignancy.
The present meta-analysis showed that for GPC3, the pooled sensitivity and specificity were 81% (95% CI, 76%-86%) and 72% (95% CI, 65%-78%), respectively, in contrast with the results of Liu et al (8), who reported a low sensitivity, 53% (95% CI, 49%-57%), but a moderate specificity, 77% (95% CI, 74%-81%). For DCP, Gao et al (31) found that the pooled sensitivity and specificity were 67% (95% CI, 58%-74%) and 92% (95% CI, 88%-94%), respectively. A reverse picture was obtained in the present meta-analysis, where the sensitivity was higher, 85% (95% CI, 79%-89%) and the specificity was lower, 75% (95% CI, 68%-82%). This contrast between the sensitivity and specificity of Chinese patients (31) and white patients (in the present study) may be explained by the fact that DCP values are higher among white subjects without liver disease (48). In a recent meta-analysis regarding AFU, Gan et al (32) found that pooled sensitivity was 0.72 (95% CI, 0.69-0.76) and pooled specificity was 0.78 (95% CI, 0.74-0.81). The present meta-analysis showed more or less similar estimates: the sensitivity and specificity were 0.78 (95% CI, 0.72-0.84) and 0.88 (95% CI, 0.82-0.92), respectively. In both studies, AFU had a good value for the diagnosis of HCC as a serum marker. With respect to VEGF, no meta-analysis was available for sensitivity and specificity in patients with HCC. However, Zhan et al (49) found that VEGF overexpression indicated a poor prognosis for patients with HCC, based on a study of hazard ratios.
The sROC curve presents a global summary of test performance and shows the trade-off between sensitivity and specificity (50). The point of intersection of the sROC curve with the antidiagonal line represents the highest common value of sensitivity and specificity for the test (44). This point does not indicate the best combination of sensitivity and specificity for a particular clinical setting, but it represents an overall measure of the discriminatory power of a test. The present meta-analysis showed that the values of the maximum joint sensitivity and specificity of AFP, GPC3, DCP, AFU, VEGF and the combination of the last 4 markers with AFP were 0.800, 0.863, 0.761, 0.782, 0.767, 0.911, 0.923, 0.801 and 0.889, respectively. On the other hand, their areas under the sROC curve were 0.869, 0.928, 0.832, 0.851, 0.834, 0.964, 0.972, 0.873 and 0.948, respectively. These data suggest that the overall accuracy of tumor markers in diagnosing HCC is higher with the use of combined markers than with using a single marker alone.
The DOR is a single indicator of test accuracy that combines the data from sensitivity and specificity into a single number. The DOR of a test is the ratio of the odds of a positive test result in a subject with the disease relative to the odds of a positive test result in a subject without the disease. The value of a DOR ranges from 0 to infinity, with higher values indicating better discriminatory test performance (51, 52). A DOR of 1.0 indicates that a test does not discriminate between patients with the disorder and those without it. In the present meta-analysis, the pooled DOR values were all more than or equal to 10 indicating that the tumor markers used could be helpful in the diagnosis of HCC, with better results in combination with AFP.
In addition to the sROC curve and the DOR analysis, the present work also presented both PLR and NLR as important measures of diagnostic accuracy for the tumor markers studied. The clinical usefulness of a diagnostic test is largely determined by the accuracy with which it identifies its target disorder, and the accuracy measure relies on the likelihood ratios. Likelihood ratios of >10 or <0.1 generate large and often conclusive shifts from pretest to posttest probability; 5 to 10 or 0.1 to 0.2 generate moderate shifts in pretest to posttest probability; and 2 to 5 or 0.2 to 0.5 generate small changes in probability (53). Higher PLR values were detected in the present work. A PLR value of 7.17 for AFU, for example, suggests that the patients with HCC have an approximately sevenfold higher chance of a positive AFU test compared with non-HCC patients.
On the other hand, the pooled NLR is another indicator of diagnosis. For example, a patient negative for AFP only has a 33% probability of having HCC, but if he/she is negative for AFP or GPC3, the probability of having HCC will be only 10%. Also, if the patient is negative for AFP or DCP, the probability of having HCC will be only 7%, which is low enough to rule out HCC.
Heterogeneity is a potential problem when interpreting the results of all meta-analyses (31). Heterogeneity may come from clinical characteristics such as ethnicity, etiology, tumor diameter and methodological heterogeneity such as study design, methods of assay of markers and so on. In the present meta-analysis, both the Spearman correlation coefficient and Q tests were used to study heterogeneity source. The Spearman correlation indicates heterogeneity due to cutoff value, while Q indicates heterogeneity due to other reasons. In diagnostic tests, the threshold effect is the most important cause of heterogeneity (32). In the present meta-analysis, heterogeneity due to cutoff value was detected only for DCP, and not for its combination with AFP or with other tumor markers. This may be due to the limited number of studies regarding DCP. For AFP, heterogeneity was present in sensitivity, specificity, PLR, NLR and DOR. The same finding was observed with GPC3 and DCP. For AFU, heterogeneity was detected with specificity, PLR and DOR, whereas with VEGF, heterogeneity was detected in sensitivity only.
The combination of tumor markers in addition to AFP had a reducing effect on heterogeneity, where it was absent in most pooled estimates. In cases of combination of GPC3 with AFP, only the specificity showed heterogeneity. With DCP+AFP, only the sensitivity showed heterogeneity, whereas with AFP, heterogeneity was detected with specificity, PLR and DOR. Finally, with VEGF+AFP, no heterogeneity was detected. The present meta-analysis was carried out with regard to Egyptian patients only, so there was no effect of ethnicity or race, but heterogeneity may arise from other factors such as differences in the control group or from the assay of tumor markers.
Publication bias remains a problem in assessing the validity of research studies (54, 55). Publication bias was detected with AFP (p=0.0002, for Begg's test, and p=0.001, for Egger's). For GPC3, AFU and VEGF, no publication bias was observed, whereas for DCP, Egger's test only was significant (p=0.028), and Begg's was not (p=0.308). This contradiction between tests may be due to their limited statistical power and so; other tests such as the trim and fill method may be used more frequently in future studies to detect publication bias (56).
As a crucial part of any meta-analysis, its strengths and weaknesses must be considered (43). In this study, the diagnostic values of GPC3, DCP, AFU and VEGF compared with AFP were explored. To avoid substantial confounding factors in the comparisons, the author only selected studies that measured the markers and AFP in the same patients. And for increasing accuracy, data were only obtained for patients with chronic liver diseases. Also, the use of Egyptian studies only is a 2-sided issue in the author's opinion. Its advantage was that it considered results specific for Egyptian patients only, not affected by race or ethnicity. A weakness of this meta-analysis is the limited number of studies included. Also the meta-analysis could not be extended to other HCC markers, such as P53 (35), interleukins (41), osteopontin (34), talin I (36), lipocalin (37) and others (38–39–40, 42) due to the limited number of studies made on these markers. Of course, this meta-analysis had some limitations. First, the exclusion of conference abstracts, letters to journal editors and non-English language studies may have led to publication bias. Second, some issues were not addressed such as cost effectiveness, reliability, the incremental benefit of adding tumor marker assays to other tests and the net effect of tumor marker assays on clinical care and patient outcomes.
In conclusion, GPC3 is a valuable serum marker that is superior to AFP and can be useful in the diagnosis and screening of HCC. DCP, AFU and VEGF are also valuable markers for detection of HCC, but they are not superior to AFP. The combination of GPC3, DCP or VEGF with AFP increased the diagnostic accuracy of HCC detection in benign liver diseases patients.