
Abstract
Background
Circulating tumor DNA (ctDNA) offers a novel and minimally invasive approach to the detection of the KRAS oncogene mutation in colorectal cancer. This study was conducted to compare the prognostic value of ctDNA with that of the current gold standard tumor tissue analysis.
Methods
A systematic literature review was conducted to identify relevant articles published from inception to December 27, 2016; the PubMed, Web of Science, Embase, Wanfang and China National Knowledge Infrastructure databases were searched. Pooled specificity, sensitivity, positive likelihood ratio, negative likelihood ratio and diagnostic odds ratio (DOR) estimates and areas under summary receiver operating characteristic (AUSROC) curves were calculated. We also performed subgroup and sensitivity analyses.
Results
Twenty-three studies with 1,715 colorectal cancer patients were included. The overall sensitivity and specificity were 0.75 (95% confidence interval [CI], 0.66-0.82) and 0.98 (CI, 0.95-0.99), respectively. The positive likelihood ratio was 31.8 (95% CI, 14.8-68.3), and the negative likelihood ratio was 0.26 (95% CI, 0.19-0.36). In addition, the AUSROC and DOR were 0.96 (95% CI, 0.93-0.97) and 123 (95% CI, 52-291), respectively. Substantial heterogeneity was observed across studies (I2 = 95%, 95% CI, 91-99). None of the subgroups investigated, including those defined by blood sample type, study region, TNM stage, detection site and detection method, could indicate the source of the observed heterogeneity. The results of the sensitivity analysis indicated that the results of our meta-analysis were stable.
Conclusions
Circulating tumor DNA may serve as a viable alternative to tissue analysis for the detection of KRAS mutations in colorectal cancer.
Introduction
Colorectal carcinoma (CRC) is the third most commonly diagnosed cancer worldwide and the fourth most common cause of cancer-related mortality (1). Treatments for CRC have been improving rapidly. One of the most exciting breakthroughs in cancer treatment is the application of personalized chemotherapy tailored according to an individual's genetic background (2). Humanized monoclonal antibodies, cetuximab or panitumumab, which target the epithelial growth factor receptor (EGFR), have been reported to be effective treatment for metastatic CRC (3, 4). The most prominent example of the integration of molecular markers into clinical practice is the detection of KRAS mutations in patients with metastatic CRC (5). Mutations of the KRAS oncogene render affected cells unresponsive to treatment with anti-EGFR antibodies, thus lowering response rates from approximately 20% to almost 0% (6). Therefore, the detection of a KRAS mutation is essential to determine whether targeted therapy can be administered to patients with CRC (7).
Currently, tumor tissue analysis is the gold standard for the detection of KRAS mutations, which is usually facilitated by biopsy or surgery (8). However, assessing KRAS mutational status in tissue can be quite challenging. First, nucleic acids gradually degrade during the fixation procedures. Moreover, tumor samples may demonstrate genomic heterogeneity within a given tumor. Lastly, tissue analyses only provides a snapshot of the tumor lesion at a given time point (9). Therefore, noninvasive approaches to the detection of these mutations are of great interest to physicians.
With developments in detection techniques, cell-free tumor DNA that is released into the blood circulation by cellular necrosis and apoptosis can be extracted (10). Circulating tumor DNA (ctDNA) has been considered as a potential surrogate for tumor tissues in the identification of tumor-associated genetic and molecular alterations (11). Additionally, ctDNA can provide a noninvasive, easily accessible and repeatable source of biological material (12). Therefore, the use of ctDNA as a form of liquid biopsy may help to obtain the genetic follow-up data that are urgently needed (8, 13). Many studies have demonstrated the feasibility and predictive value of ctDNA in the detection KRAS mutation in CRC (14, 15). However, these studies were different in many aspects, such as in detection techniques, tumor tissue storage, mutation spectrum assessed and tumor stage. Unfortunately, no consistent criteria have been applied.
The results of a literature search revealed that only 1 meta-analysis had compared the accuracy of blood samples and tumor tissues in the detection of KRAS mutations in CRC (16). However, the study included 2 specimen types, circulating tumor DNA (ctDNA) and circulating tumor cells (CTCs), which were both compared with tumor tissue. These 2 specimen types have their respective advantages and disadvantages (17). Therefore, differences between their accuracy could not be differentiated.
Therefore, we performed this meta-analysis to compare the diagnostic value of ctDNA for KRAS mutation detection in the blood of CRC patients with that of the gold standard tumor tissue analysis.
Material and methods
Search strategy and selection criteria
We systematically searched the PubMed, Web of Science, Embase, Wanfang and the China National Knowledge Infrastructure (CNKI) databases for relevant studies. The search strategy included the use of the following keywords and medical subheadings: “colorectal cancer and/or carcinoma or Tumour or neoplasm,” “KRAS” or “KRAS gene,” “serum” or “plasma” or “circulating Tumour DNA.” The search was limited to human studies published in English or Chinese. We searched the databases to identify articles published from inception to December 27, 2016.
To obtain relevant publications, articles identified in the databases and reference lists were first screened by title, abstract and author information; then, full-text articles were further evaluated. We contacted the authors for further information if needed. Eligible studies were required to fulfill the following inclusion criteria: (i) focused on histologically or cytologically confirmed CRC; (ii) KRAS mutation status must be detected both by circulating free DNA and in tumor tissues; and (iii) sufficient information must be provided to construct 2 × 2 contingency tables. We also applied the following exclusion criteria: (i) tumor tissues and blood samples were unpaired; (ii) KRAS mutation status was not compared between circulating free DNA and tumor tissues; (iii) KRAS mutation could not be affirmed due to samples of insufficient volume; and (iv) quality assessment of eligible studies was completed using Quality Assessment of Studies of Diagnostic Accuracy Included in Systematic Reviews–2 (QUADAS-2) and the result was not “low risk.”
Data extraction
Two authors (M.T. and Z.D.) independently extracted relevant data from the selected studies. Any disagreements were resolved through discussion with the corresponding author (J.L). The following data were collected: first author, publication year, country, number of patients enrolled, blood sample type, TNM stage, mutation detection methods used for the blood sample, detection sites and true-positive (TP), false-positive (FP), false-negative (FN) and true-negative (TN) results.
Statistical analysis
STATA version 12.0 was used for the meta-analysis. We tabulated the TP, FN, FP and TN rates based on the selected studies. Then, we utilized these values to calculate pooled sensitivity, specificity, positive likelihood ratio (PLR), negative likelihood ratio (NLR) and diagnostic odds ratio (DOR) estimates and their corresponding 95% confidence intervals (95% CIs). Meanwhile, summary receiver operating characteristic (SROC) curves were generated and areas under the curve (AUC) were calculated to evaluate the overall diagnostic performance of ctDNA.
Heterogeneity was evaluated using the Q test and the inconsistency index (I2). When the p value was ≤0.05 and I2>50%, the level of heterogeneity observed across studies was considered statistically significant. Subgroup analyses were performed by blood sample type, study region, TNM stage, detection site and detection method. To determine whether the results were stable, we performed a sensitivity analysis. Deek's funnel plot asymmetry test was performed to ascertain the presence of publication bias. A p value <0.05 or asymmetric funnels indicated the presence of publication bias (18).
Results
Search results
A total of 947 records were retrieved in our initial database search. After reviewing the titles, abstracts and author information, we excluded 873 studies based on the inclusion criteria. After a full-text review, we further excluded 51 articles. Finally, 23 studies met the inclusion criteria and were included in this meta-analysis (Fig. 1).
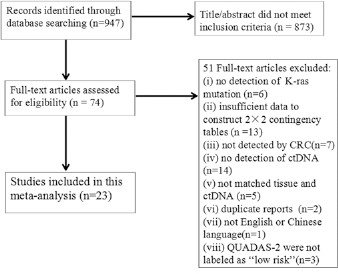
Flow chart describing the systematic literature search and study selection process for the meta-analysis. CRC = colorectal carcinoma; ctDNA = circulating tumor DNA; QUADAS-2 = Quality Assessment of Studies of Diagnostic Accuracy Included in Systematic Reviews–2.
Study characteristics
The main characteristics of the included studies are summarized in Table I. A total of 23 studies with 1,715 CRC patients were included in our meta-analysis. Nine studies (21, 25-27, 30, 32, 34, 39, 40) contained a predominantly Asian population, and 12 studies (19, 20, 23, 24, 28, 29, 31, 35-38, 41) contained a largely European population. Plasma was used for detecting KRAS mutation status in 19 studies (19, 22, 23, 25-29, 31-41). The remaining 4 studies (20, 21, 24, 30) tested for KRAS mutations in serum. Eleven studies (19-23, 27, 30, 32, 34-36) included patients with all stages of CRC, and 10 studies (24, 28, 29, 31, 33, 37-41) included only stage IV CRC patients. KRAS codons 12 and 13 point mutational hotspots were evaluated in 18 studies (21, 23-32, 34-40), and 3 studies (22, 33, 41) assessed KRAS codons 12, 13 and 61 point mutations. Various detection methods were reported, and polymerase chain reaction (PCR) was the most common approach.
Main characteristics of the eligible studies
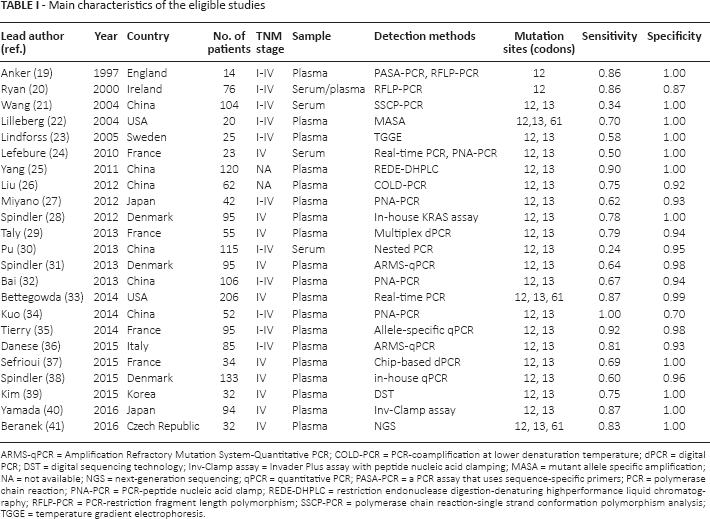
ARMS-qPCR = Amplification Refractory Mutation System-Quantitative PCR; COLD-PCR = PCR-coamplification at lower denaturation temperature; dPCR = digital PCR; DST = digital sequencing technology; Inv-Clamp assay = Invader Plus assay with peptide nucleic acid clamping; MASA = mutant allele specific amplification; NA = not available; NGS = next-generation sequencing; qPCR = quantitative PCR; PASA-PCR = a PCR assay that uses sequence-specific primers; PCR = polymerase chain reaction; PNA-PCR = PCR-peptide nucleic acid clamp; REDE-DHPLC = restriction endonuclease digestion-denaturing highperformance liquid chromatography; RFLP-PCR = PCR-restriction fragment length polymorphism; SSCP-PCR = polymerase chain reaction-single strand conformation polymorphism analysis; TGGE = temperature gradient electrophoresis.
Diagnostic accuracy analysis
We pooled the sensitivity, specificity, DOR, PLR and NLR data from the eligible studies. The overall diagnostic sensitivity and specificity were 0.75 (95% CI, 0.66-0.82) and 0.98 (95% CI, 0.95-0.99), respectively (Fig. 2). PLR, NLR and DOR are the other 3 indicators that are commonly used for diagnostic tests (42). The PLR and NLR were 31.8 (95% CI, 14.8-68.3) and 0.26 (95% CI, 0.19-0.36), respectively (Supplementary Figure 1, available online at www.biological-markers.com – Forest plot of positive likelihood ratio and negative likelihood ratio). The summary estimates for PLR and NLR were located in the right upper quadrant (Supplementary Figure 2, available online at www.biological-markers.com – The likelihood ratio matrix of ctDNA for the detection of K-ras mutation). In addition, the AUSROC and DOR were 0.96 (95% CI, 0.93-0.97) (Fig. 3) and 123 (95% CI, 52-291), respectively (Supplementary Figure 3, available online at www.biological-markers.com – Forest plot of diagnostic odds ratio).
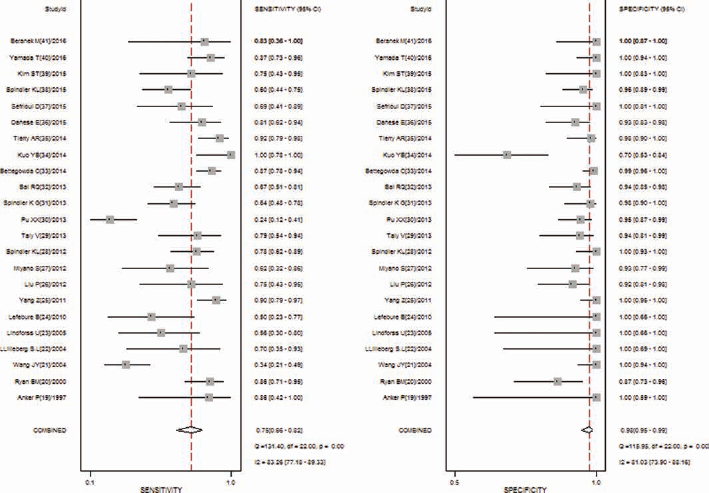
Forest plot of the pooled sensitivity and specificity.
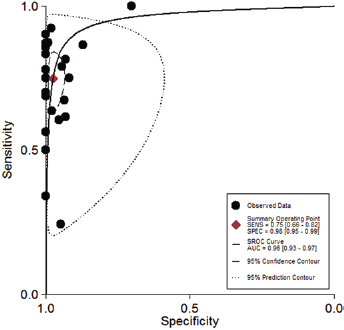
Summary receiver operating characteristic curve.
Heterogeneity analysis and subgroup analysis
A high level of heterogeneity was observed across studies (overall I 2 for the bivariate model 95%, 95% CI, 91-99 and p<0.1); however, we did not find any evidence of a threshold effect (tested using the STATA Midas module). To identify the source of heterogeneity, we conducted a subgroup analyses stratified by blood sample type, study region, TNM stage, detection site and detection method. No notable differences were identified in any patient characteristics (ethnicity, cancer metastasis status) or blood sample characteristics (detection sites, test method) in the subgroup analyses except blood sample type. Plasma samples were slightly more sensitive than blood serum samples (0.79; 95% CI, 0.72-0.84; vs. 0.50; 95% CI, 0.24-0.76, respectively) but had similar specificity (0.98; 95% CI, 0.95-0.99; vs. 0.95, 95% CI, 0.89-0.98, respectively) (Tab. II).
Subgroup analysis of included studies
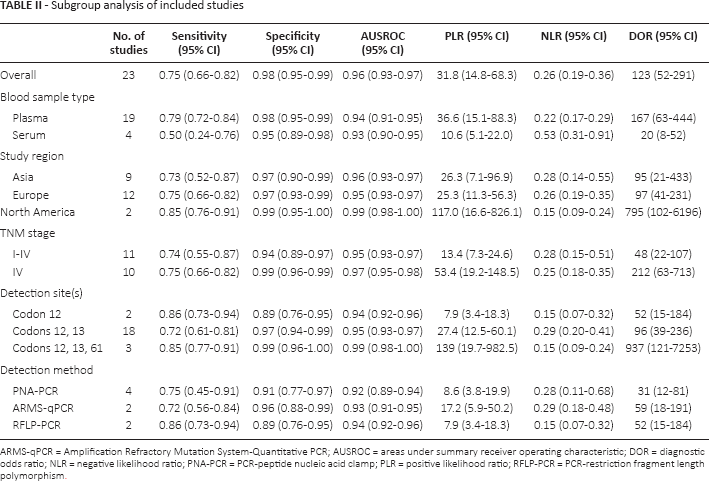
ARMS-qPCR = Amplification Refractory Mutation System-Quantitative PCR; AUSROC = areas under summary receiver operating characteristic; DOR = diagnostic odds ratio; NLR = negative likelihood ratio; PNA-PCR = PCR-peptide nucleic acid clamp; PLR = positive likelihood ratio; RFLP-PCR = PCR-restriction fragment length polymorphism.
Sensitivity analysis
To determine the degree to which each individual study affected the overall odds ratio (OR) estimates, a 1-way sensitivity analysis was performed by sequentially excluding 1 study at a time and recalculating the overall effect. As shown in Supplementary Figure 4 (available online at www.biological-markers.com – Sensitivity analysis of ctDNA for the detection of K-ras mutation), the significance of the pooled OR was not significantly affected by omitting any single study, which supported the stability of our results.
Publication bias
We performed the Deek's funnel plot asymmetry test to evaluate the presence of publication bias. As shown in Supplementary Figure 5 (available online at www.biological-markers.com – Deek's funnel plot assessment of potential publication bias), the shape of the funnel plots did not show evidence of asymmetry, and the statistical results also did not indicate the presence of any evidence of publication bias (p = 0.08). Hence, there was no obvious publication bias in our included studies.
Discussion
Based on our systematic review and meta-analysis, we found that the pooled diagnostic sensitivity and specificity estimates showed a high level of diagnostic accuracy for the detection of KRAS mutations (Fig. 2). In these analyses, greater PLR values indicate a greater likelihood that the test result was associated with the disease, while the lower NLR values indicated a greater likelihood that the test result was associated with the absence of the disease (43). And given the location of the PLR and NLR, ctDNA could be used as a diagnostic test to detect KRAS mutations (Supplementary Figure 2, available online at www.biological-markers.com – The likelihood ratio matrix of ctDNA for the detection of K-ras mutation). Areas under the ROC curve were used to evaluate diagnostic test accuracy. According to the recommended guidelines for the interpretation of the AUSROC values (44), ctDNA demonstrated relatively high diagnostic ability (AUC >0.9) to detect KRAS mutations (Fig. 3).
Although ctDNA was found to have significant prognostic value for assessing KRAS mutation status, no consistent conclusions were derived for some important covariates, such as the type of blood sample, study region, TNM stage, detection site and detection method. Thus, subgroup analyses were performed to determine whether any of these factors served as a significant source of heterogeneity (Tab. II). To assess the role of blood sample type in the use of ctDNA in CRC, we stratified the meta-analysis by type of blood sample and found that plasma samples had higher diagnostic accuracy than serum samples. However, Lecomte et al (45) hypothesized that high levels of free ctDNA in plasma or serum are not specific to malignant disease. The reason for this discrepancy is unknown, and possible explanations include differences in tumor type, testing method and detection site.
The results of the subgroup analysis indicated that North American populations had slightly higher KRAS mutation detection rates than other ethnicities. Given that the number of publications varied widely, we believe this result may not be reliable due to a lack of sufficient statistical power; thus, additional studies should be conducted to confirm our results.
Additionally, patients with stage IV CRC had higher AUSROC and DOR values. Lim et al (46) suggests that the amount of ctDNA was associated with metastatic status. Therefore, patients with advanced stage CRC may have high quantitative levels of ctDNA. And Yamada et al (40) also argues that the detection of KRAS mutations in ctDNA is an attractive approach for predicting both treatment response and acquired resistance to EGFR blockade, and for detecting disease recurrence in advanced CRC patients.
The included studies used various testing methods, such as CR-peptide nucleic acid clamp (PNA-PCR), Amplification Refractory Mutation System-Quantitative PCR (ARMS-qPCR), PCR-restriction fragment length polymorphism (RFLP-PCR) and sequencing. Our meta-analysis results showed that PNA-PCR was the most frequently used method and demonstrated high diagnostic performance. In addition, as indicated by specificity, ARMS-qPCR was the best diagnostic method. As the numbers of publications in which each of these methods was applied were low, further studies are warranted.
According to the above review and analysis, ctDNA had a high prognostic value for the detection of KRAS mutations in CRC; however, some limitations of this study should be taken into consideration. First, although we tried to collect all relevant data, some data were missing. The studies included in our meta-analysis were restricted to only articles published in English or Chinese, and the number of included studies and samples sizes within each study was relatively small. Second, a high level of heterogeneity was observed. Heterogeneity was often attributed to the use of varying test protocols and lack of standardized methods. Therefore, the variety of detection methods, sample types, neoplasm stages and mutation sites may have led to the observed heterogeneity. Unfortunately, we did not identify the exact source of the heterogeneity. Third, although we observed no evidence of publication bias via the Deek's funnel plot asymmetry test, publication bias may have been inevitable, as studies are more likely to be published if they report positive results than if they report negative results. Thus, the pooled results may be overestimated, and more prospective studies are needed to validate our results.
Conclusions
The available evidence showed that ctDNA serves as a form of liquid biopsy that is effective for the detection of KRAS mutations in CRC.
Footnotes
Financial support: This study was supported by the international cooperation project from the Department of Science and Technology of Sichuan Province (2017HH0105).
Conflict of interest: None of the authors has any financial interest related to this study to disclose.