
Abstract
Objective
To identify microRNAs (miRNAs) that are overexpressed in renal cell carcinoma (RCC) and characterize the functional role of miR-21.
Materials and Methods
The miRNA expression profiles between RCC tissue and adjacent normal tissue were compared using microarray analysis. The differential expression of miR-21 was validated by real-time polymerase chain reaction (RT-PCR). 786-O RCC cells were transfected with miR-21 mimic, miR-21 inhibitor, or negative controls and cell proliferation, apoptosis and cell cycle were examined by MTT assay and flow cytometry. The expression of programmed cell death 4 (PDCD4) and tropomyosin 1 (TPM1) was detected by RT-PCR and Western blot analysis.
Results
Compared to adjacent normal tissue, 10 human miRNAs were significantly upregulated and 7 were downregulated in RCC tissue. RT-PCR confirmed that miR-21 was significantly overexpressed in RCC tissue. In vitro expression of miR-21 mimic promoted the growth of 786-O cells, whereas miR-21 inhibitor inhibited cell growth by inducing apoptosis and cell cycle arrest at S phase. Furthermore, miR-21 mimic or inhibitor significantly reduced or increased the expression of PDCD4 and TPM1.
Conclusions
MiR-21 is overexpressed in RCC tissue and modulates the growth, apoptosis and cell cycle progression of RCC cells and regulates the expression of PDCD4 and TPM1.
Introduction
Renal cell carcinoma (RCC) accounts for about 2%-3% of adult cancer. Each year about 102,000 people die of kidney cancer worldwide (1). The biological behavior of RCC is changeable and its cause is still not clear. Due to the absence of a specific biomarker for early diagnosis and therapy at present, the prognosis of RCC patients is quite poor. In recent years, several biomarkers of RCC have been proposed, including p21, fibroblast growth factor receptors, and B7-H1, which are mainly implicated in the regulation of apoptosis and cell cycle progression, angiogenesis, and immune function (2-4). However, the prospects of the application of these biomarkers in the clinical setting remain unclear. Therefore, it is urgent to identify novel biomarkers of early diagnosis, clinical stage and treatment to improve the survival rate of RCC.
MicroRNAs (miRNAs) are a class of small molecule RNA with 19 to 25 nucleotides that regulate the expression of target genes via mediating mRNA degradation or translational repression. According to bioinformatics analysis, about 30% of the protein coding genes are regulated by miRNAs in mammals and miRNAs are frequently located at fragile sites and genomic regions involved in cancer (5). It is generally accepted that miRNAs are key players in carcinogenesis by acting as oncogenes or tumor suppressor genes to regulate tumor cell proliferation, apoptosis, invasion and angiogenesis (6).
In this study, we performed miRNA expression profiling of RCC using miRNA microarray and verified the differentially expressed miRNAs using real-time polymerase chain reaction (RT-PCR). Especially, we focused on miR-21 that was overexpressed in RCC and investigated its functional role in RCC cells.
Material and Methods
Patients and Tissue Samples
This study was approved by the Ethics Committee of the First Affiliated Hospital of Sun Yat-sen University, and was registered at ClinicalTrials.gov (http://clinicaltrials.gov/). RCC tissue and adjacent normal tissue samples from the same kidney were obtained from patients with kidney masses who underwent nephrectomy at the First Affiliated Hospital of Sun Yat-sen University. Specimens were preserved in liquid nitrogen. All tumor types were clear cell renal cell carcinoma (CCC). RCC histological subtypes and stage were classified based on the 2004 WHO classification and the 2002 American Joint Committee on Cancer (AJCC) staging system. Nuclear grading was based on the Fuhrman system.
Extraction of total RNA
Total RNA was extracted with the mirVana miRNA isolation kit (Applied Biosystems, Foster City, CA, USA). RNA quality was examined by agarose gel electrophoresis. The RNA was visualized as clear bands and the ratio of 28S/18S was about 2. The RNA yield was determined with a NanoDrop 1000 Spectrophotometer (NanoDrop Technologies, Montchanin, DE, USA).
MiRNA microarray and data analysis
Four kidney tissue sample pairs (malignant and nonmalignant tissue samples from the same kidney) were used for microarray. Microarrays were purchased from CapitalBio Corporation (CapitalBio Corp., Beijing, China), which included 1,198 human miRNAs of humans as well as mice and rat miRNAs from the Sanger database v12.0. All miRNA probe sequences were designed to be complementary to the full-length mature miRNAs. Each probe was printed in triplicate with a SmartArray™ microarrayer (CapitalBio Corp.). The low-molecular-weight RNA was isolated using a PEG solution precipitation method (7). The T4 RNA ligase labeling method was adopted according to the modified Thomson protocol (8). Hybridization was performed under LifterSlip™ (Erie Company, Portsmouth, NH, USA) and the hybridization chamber was laid on a 3-phase tiling agitator BioMixer™ II (CapitalBio Corp.) The array was hybridized at 42°C overnight and washed twice with washing solution (0.2% SDS, 2×SSC at 42°C for 5 minutes, and 0.2% SSC for 5 minutes at room temperature). Arrays were scanned with a confocal LuxScan™ scanner (CapitalBio Corp.). Data were extracted from the TIFF images using LuxScan™ 3.0 software (CapitalBio Corp.).
Low-intensity spots were removed for which less than 30% of the signal pixels exceeded the median background plus 2 times its standard deviation. For each sample 1 hybridization was carried out and each miRNA probe had 3 replicate spots on a microarray. Significance analysis of microarrays (SAM, version 2.1) was performed using 2-class paired comparison. A q-value <0.05 was considered statistically significant. The mean intensity value of each probe was used for cluster analysis. The raw data was log2-transformed and the median was centered by arrays and genes using the adjust data function of the CLUSTER 3.0 software. Hierarchical clustering with average linkage was conducted for further analysis.
miRNA quantitative RT-PCR
A total of 17 kidney tissue sample pairs were subjected to quantitative RT-PCR for the detection of miR-21. Stemloop RT was performed with a Taqman microRNA RT kit (Applied Biosystems), and then quantitative PCR for mature miRNAs was performed with Taqman microRNA assay kit (Applied Biosystems) on an ABI PRISM 7000 instrument. Experiments were done in triplicate (3 wells per sample) and the average was calculated. miR-21 was normalized to the expression of the endogenous reference gene snRNA RNU6 (Applied Biosystems). δCt values were calculated using the Ct values of the miRNA probes and the RNU6 for each individual sample. δδCt values were calculated using the δCt values of the malignant tissue and the nonmalignant tissue for each miRNA probe.
Cell culture and transfection
The renal cell carcinoma cell line 786-O (ATCC, Manassas, VA, USA) was cultured in RPMI1640 medium (Invitrogen, Grand Island, NY, USA) supplemented with 10% fetal bovine serum. Cells were transfected with miR-21 mimic, miR-21 inhibitor, miRNA negative control, or miRNA inhibitor negative control (Dharmacon, Lafayette, CO, USA) at a final concentration of 50 nM, using Lipofectamine LTX and Plus Reagent (Invitrogen) according to the manufacturer's instructions. Cells were harvested at 72 hours after transfection.
Cell growth assay
After transfection, 786-O cells were seeded into 96-well plates at 3,000 cells/well. After adding 20 μL 0.5% MTT (Sigma, St Louis, MO, USA) to each well, the cells were incubated for 4 hours. Then 150 μL DMSO (AMRESCO, Solon, OH, USA) was added to each well and the plate was low-speed oscillated for 10 minutes. The absorbance at 490 nm was measured on an ELISA reader (Molecular Devices, Sunnyvale, CA, USA).
Analysis of DNA content by flow cytometry
After transfection, media containing the floating cells was collected and the attached 786-O cells were trypsinized. The samples were centrifuged at 1,000g at 4°C for 5 minutes and washed with PBS. Then the cells were fixed in 70% cold ethanol overnight. After being washed with PBS, the cells were suspended in PBS with propidium iodide (PI) and RNase A (Sigma) at a concentration of 50 μg/mL. Analysis of DNA content was performed with a ELITE flow cytometry (Beckman Coulter Ltd., Luton, United Kingdom). Cell cycle was determined according to the result.
Apoptosis assay
Apoptosis was detected using a Calbiochem Annexin V-FITC Apoptosis Detection Kit (EMD Chemicals, Gibbstown, NJ, USA) according to the manufacturer's instructions. In the 2-variable flow cytometry scatter plot, the living cells were presented as FITC- PI-. The cells of late apoptosis were presented as FITC+ PI+, and the early apoptotic cells were presented as FITC+ PI-.
Quantitative RT-PCR for PDCD4 and TPM1
The cDNA synthesis was performed with RevertAid™ H Minus First Strand cDNA Synthesis Kit (Fermentas, St Leon-Rot, Germany) according to the manufacturer's protocol. PCR was performed using SYBR̄ Premix Ex Taq™ (Takara, Dalian, China) in accordance with the manufacturer's protocol. The sequences of the primers were listed as follows: PDCD4 TGGTGGGCCAGTTTATTGCTAGA (forward), GAAGCACGGTAGCCTTATCCAGAG (reverse); TPM1 AGTTGGATCGTGCCCAGGAG (forward), GTCGGCATCTTCAGCAATGTG (reverse). GAPDH was used as an internal control to normalize the expression of the target genes.
Western blotting analysis
SDS-PAGE and Western blotting analysis were performed according to standard procedures. The primary antibodies used were anti-PCDC4 (Abcam, Cambridge, MA, USA), anti-TPM1 (Abcam) and anti-GAPDH (Sigma). GAPDH was used as the loading control. Antimouse and antirabbit secondary antibodies were purchased from CST (Danvers, MA, USA). Signal intensity was determined by the Fluorchem 8900 image analysis system (Alpha Innotech, Miami, FL, USA).
Statistical analysis
Data were analyzed with the PASW statistics 18 software (SPSS Inc., Chicago, IL, USA). Values were expressed as means ± SE. Differences between groups were calculated with the Mann-Whitney U-test or Wilcoxon paired rank test. Spearman's rank correlation test was used. P values <0.05 were considered statistically significant.
Results
Differential expression of miRNAs between normal and tumor tissues
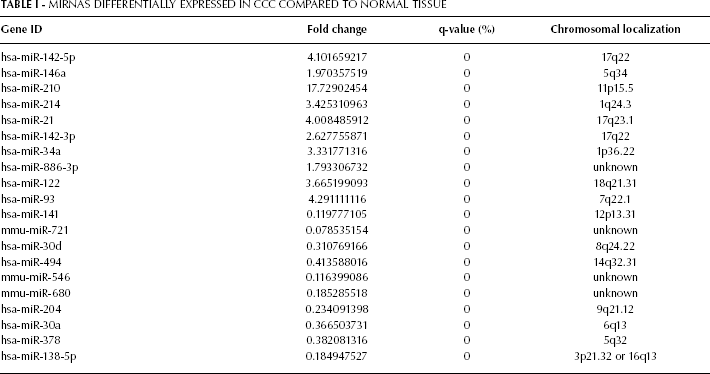
miRNA microarray analysis showed that 20 differentially expressed miRNAs, including 17 human miRNAs, were detected in CCC tissue, compared to adjacent normal tissue (Tab. I). The most significantly changed miRNAs included hsa-miR-210 (17.73 fold), hsa-miR-141 (-8.35 fold), has-miR-138-5p (-5.41 fold), hsa-miR-93 (4.29 fold), hsa-miR-204 (-4.27 fold), hsa-miR-142-5p (4.10 fold), and hsa-miR-21 (4.01 fold). Based on the 20 differentially expressed miRNAs, a tree with clear distinction between CCC tissue and normal tissue was generated by the cluster analysis (Fig. 1).
Mirnas Differentially Expressed IN CCC Compared to Normal Tissue
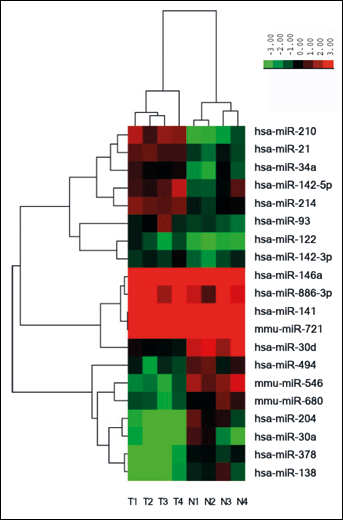
Hierarchical cluster analysis of miRNAs differentially expressed in RCC and normal tissue samples.
miR-21 is significantly upregulated in CCC tissue
miR-21 is upregulated in a variety of malignant tumors (9). Therefore, we chose miR-21 for further analysis of its expression in CCC. Quantitative RT-PCR analysis showed that the fold change of miR-21 in cancer versus normal tissue was 10.98±9.48 (1.69-36.25, median 7.41) (p<0.001) (Fig. 2). There was no significant correlation between tumor nuclear grade or TNM stage and miR-21 relative expression fold change (p>0.05).
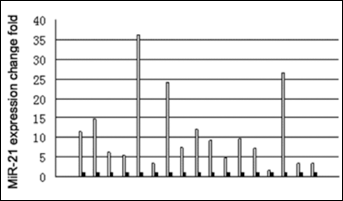
MiR-21 expressed in CCC compared to normal tissue. The fold change of miR-21 expression in cancer tissue was 1.69-36.25 times of that in normal tissue, Wilcoxon paired rank test, p<0.001 (n=17). □ cancer tissue, ▪ normal tissue (n=17).
miR-21 modulates the proliferation, apoptosis and cell cycle of 780-O cells
To investigate the functional role of the upregualtion of miR-21 in CCC, we transfected mimics or inhibitors of miR-21 into 780-O cells and examined their biological behaviors. As shown in Figure 3A, miR-21 mimic significantly promoted the growth of 780-O cells (p=0.004), while miR-21 inhibitor significantly inhibited the growth of 780-O cells (p=0.004).
Next we examined the cell cycle profiles and found that miR-21 inhibitor significantly increased the apoptosis of 780-O cells (p=0.043) (Fig. 3B), which was associated with a significant increase in the proportion of S phase cells and a reduction in the proportion of G1 phase cells (p=0.043) (Fig. 3C). Taken together, these results suggest that miR-21 promotes the proliferation of 780-O cells.
(A) In vitro 780-O cell proliferation was determined with MTT assay as described in Materials and methods. Values were means ± SE of 3 independent experiments. (B) The percent of apoptotic cells was determined with flow cytometry. Each bar represents means ± SE of 5 independent experiments. (C) The percentages of cells in the S, G1 and G2 phases were measured with flow cytometry and plotted as means ± SE of 5 independent experiments.
miR-21, miR-21 mimic; NC, miRNA negative control; in-21, miR-21 inhibitor; in-NC, miRNA inhibitor negative control. *, p<0.05.
miR-21 regulates the expression of PDCD4 and TPM1
To investigate the potential mechanism by which miR-21 modulates the biological behaviors of 780-O cells, we predicted the target genes of miR-21 based on bioinformatics analysis using TargetScan, miRanda and Pic Tar programs. Among the predicted target genes, programmed cell death 4 (PDCD4) drew our attention. As a tumor suppressor gene, PDCD4 could upregulate apoptosis-related proteins (10) and it has been shown that PDCD4 is regulated by miR-21 in colorectal cancer (11), breast cancer (12, 13) and glioma (14) cells. Tropomyosin 1 (TPM1) is another tumor suppressor gene that has been identified as a target of miR-21 to regulate the invasion and metastasis of breast cancer (13, 15) and prostate cancer (16) cells. Therefore, we examined the expression of PDCD4 and TPM1 in RCC cells. RT-PCR analysis showed that miR-21 inhibitor or mimic produced no significant change in TPM1 mRNA expression (Fig. 4A). However, miR-21 mimic or miR-21 inhibitor significantly reduced or increased the mRNA level of PDCD4, respectively (Fig. 4B). Furthermore, Western blot analysis showed that miR-21 mimic or miR-21 inhibitor reduced or increased the protein expression of TPM1 and PDCD4, respectively (Fig. 4C, 4D).
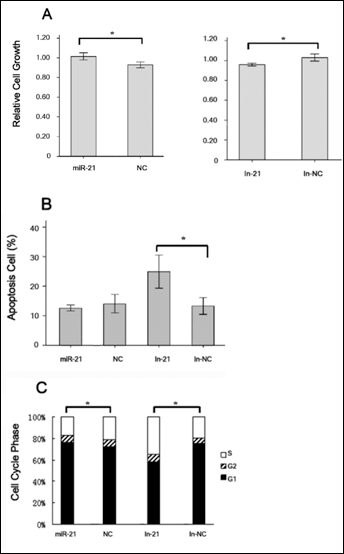
MiR-21 regulates the proliferation, apoptosis and cell cycle of 780-O cells.
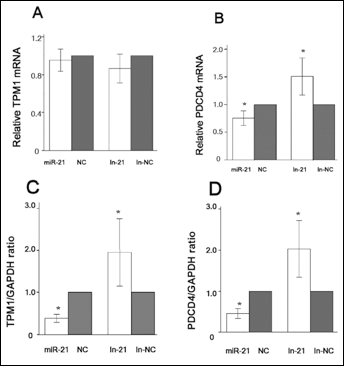
miR-21 regulates the expression of PDCD4 and TPM1 in 786-O cells.
Discussion
In the present study we found that miR-21 was significantly upregulated in RCC by microarray analysis, which was consistent with previous studies (17-19). MiR-21 is upregulated in many solid tumors such as colon cancer, lung cancer, pancreatic cancer, breast cancer, prostate cancer, esophageal cancer, gastric cancer, malignant glioma and uterine smooth muscle tumors, suggesting that it may play an oncogenic role in different tumors. However, the role of miR-21 in RCC is unclear. miR-21 regulates cell proliferation or apoptosis in breast cancer (20), glioblastoma (21) and liver cancer (22). In our study we found that miR-21 modulated the proliferation, apoptosis and cell cycle of RCC cells. Our results showed that miR-21 inhibitor could significantly increase the apoptosis of 780-O cells and induce cycle arrest at S phase of 780-O cells. Thus we conclude that miR-21 promotes the proliferation of RCC cells by inhibiting the apoptosis and cell cycle arrest of RCC cells.
As a key factor of the miRNA regulation network, miR-21 plays an important role in tumor cells through modulating a variety of target genes (21, 23). We predicted PDCD4 as a potential target gene of miR-21 based on the bioinformatics analysis using 3 different programs: TargetScan, miRanda and Pic Tar. PDCD4 is known as a tumor suppressor gene that could upregulate apoptosis-related proteins (10). In our study, miR-21 could significantly reduce the expression of PDCD4 at both mRNA and protein levels in 786-O cells, indicating that miR-21 regulates PDCD4 expression at the transcriptional level. Notably, another tumor suppressor gene, TPM1, has been identified as a target gene of miR-21 to regulate the invasion and metastasis of cancer cells (13, 15, 16). TPMs integrate with the actin and stabilize filaments to inhibit cell transformation (24, 25). Our study showed that miR-21 could significantly reduce the TPM1 protein level in 786-O cells, although the miR-21 mimic and inhibitor had no significant effects on the TPM1 mRNA level in the cells. These results suggest that miR-21 regulates TPM1 expression at a post-transcriptional level. Taken together, our data provide evidence for the oncogenic role of miR-21 in RCC by demonstrating that miR-21 inhibits the expression of the tumor suppressors PDCD4 and TPM1.
However, our study could not exclude the possibility that miR-21 regulates other targets to play an important role in tumorigenesis of RCC. Recently, Zhang et al identified Fas ligand and metalloproteinase inhibitor 3 (TIMP3) as targets of miR-21 and reported that miR-21 modulated the apoptosis of RCC cells by regulating their expression (26). Furthermore, Dey et al recently identified PTEN as a novel target of miR-21 and found that miR-21 suppressed PTEN expression to activate the canonical oncogenic Akt/TORC1 signaling to promote the proliferation and invasion of renal cancer cells (27).
RCC is known to develop resistance to radiotherapy and chemotherapy, and biological therapy becomes an increasingly important alternative approach for RCC treatment. Given that miRNAs can regulate multiple oncogenes or tumor suppressor genes simultaneously, genetic therapy targeting at miRNAs may be more effective than the treatment targeting at 1 single oncogene or tumor suppressor gene. Indeed, miR-21 has been proposed as a novel therapeutic target for human cancer (28). In this study we demonstrated that miR-21 was overexpressed in RCC tissue, modulated the growth, apoptosis and cell cycle progression of RCC cells, and inhibited the expression of tumor suppressors PDCD4 and TPM1. These data suggest that miR-21 functions as an oncomir in RCC and is a promising molecular biomarker and therapeutic target for RCC.
Footnotes
Acknowledgments
The authors thank Qingyu Kong, Xiuqing Dong, Yi Zhou, Xiaohong Wang, Shu Li and Ning Luo for their assistance in the experiment. We thank Professor Yueqin Chen and Hua Zhang for their helpful suggestions.