
Abstract
An evidence-based approach, such as those developed in clinical and veterinary medicine, was applied to the detection of Plum pox virus (PPV) during the dormant period. A standardized methodology was used for the calculation of parameters of the operational capacity of DASI-ELISA and RT-PCR in wintertime. These methods are routinely handled to test the sanitary status of plants in national or international trading and in those cases concerning export-import of plant materials. Diagnosis often has to be performed during the dormant period, when plant material is commercialized. Some guidelines to interpret diagnostic results of wintertime are provided in an attempt to minimize risks associated with the methods and over-reliance on the binary outcome of a single assay. In order to evaluate if a complementary test increased the confidence of PPV diagnosis when discordant results between DASI-ELISA and RT-PCR are obtained, NASBA-FH also was included. Likelihood ratios of each method were estimated based on the sensitivity and specificity obtained in wintertime. Subsequently, a Bayesian approach was performed to calculate post-test probability of PPV infection in spring. Results of evidence-based approach show that different PPV prevalences require different screening tests. Thus, at very low PPV prevalence levels DASI-ELISA should be used as the election method, whilst at the highest PPV prevalence levels RT-PCR should be performed. NASBA-FH could be used at medium prevalences to clarify discordances between DASI-ELISA and RT-PCR.
Introduction
Plum pox virus (PPV) is the causal agent of sharka disease (García and Cambra, 2007), the most serious viral disease affecting Prunus species. Worldwide losses associated with the management of sharka in the last 30 years have been estimated at over 10,000 million euros (Cambra et al. 2006a). The main cause of PPV spreading over long distances is the exchange of propagative plant material. Nursery plants and plant materials in general are commercialized during the dormant period. Serological and molecular assays have to be performed during the winter to assess PPV-free status before trading, which is the most problematic season for detection (Olmos et al. 2007). Validated reagents, methods and protocols are available for PPV detection and identification (EPPO 2004). PPV can be detected using: i) biological tests based on the graft inoculation of GF305 or Nemaguard peach seedlings, or Prunus tomentosa (Damsteegt et al. 1997; Desvignes et al. 1999; Gentit, 2006), ii) ELISA serological tests with the specific monoclonal antibody 5B-IVIA or with polyclonal antibodies (Cambra et al. 2006b), and iii) molecular techniques based on different PCR assays (Olmos et al. 2006). The most commonly used techniques included in this protocol for routine detection are DASI-ELISA (5B-IVIA) (Cambra et al. 1994) and RT-PCR (P1-P2 primers) (Wetzel et al. 1991) and for this reason they were selected in this study. In addition, a novel thermal cycler-free molecular method for sensitive PPV detection (Olmos et al. 2007) also was used as a complementary test. To evaluate the reliability of winter diagnostics, interpretation of serological and molecular results requires the estimation of post-test probability of PPV infection. Diagnostic methods may be interpreted as a function of several parameters, permitting calculation of likelihood ratios, which along with Bayes’ theorem allow post-test probability calculations (Deeks and Altman, 2004). Likelihood ratios express how much more probable it is to find a positive result in an infected tree than in a healthy one. It has been reported to be the best measure of the usefulness of a diagnostic test (Fletcher et al. 1996). Likelihood ratios of different tests can be associated with Bayesian methodology to evaluate the use of techniques association. Bayes’ theorem shows how the diagnostic hypothesis based on the test result is modified as a function of new information such as the prevalence of PPV, which can be estimated with previous data of PPV incidence obtained in surveys in the same area. The post-test odds of there being PPV infection is calculated by multiplying the pre-test odds by the likelihood ratio value (Jaeschke et al. 2002), considering the pre-test probability as the prevalence of PPV.
The main objective of this study was to assess the contribution of parameters of DASI-ELISA and RT-PCR methods to the probability of diagnosing PPV in the dormant period, considering the previous probability of disease. A decision scheme is suggested based on post-test probability of PPV infection during the dormant period in wintertime.
Material and Methods
Material
Evidence based approach to PPV diagnosis in wintertime was performed using the results of DASI-ELISA, RT-PCR and NASBA-FH obtained over a total of 262 Prunus (184 plums, 69 apricots and 9 peaches) (Olmos et al. 2007). Stone fruit trees were analyzed in wintertime (dormant period) in Liria, Valencia, Spain. Samples consisted in 5 to 8 spurs or dards with dormant or swelling buds collected at the beginning of February 2006 from each branch at the internal structure of the tree. In the following spring (mid May 2006) the same trees were analyzed to verify their sanitary status according EPPO protocol (EPPO 2004) testing 5 to 8 spurs or shoots per tree with fully expanded leaves. A stone fruit tree was considered to be PPV infected: i) when all methods tested positive in early springtime, and ii) in those infrequent cases where only two methods tested positive and two different operators recorded visualization of typical symptoms in leaves.
Methods
Diagnostic Techniques
DASI-ELISA
DASI-ELISA based on the specific monoclonal antibody 5B-IVIA (Durviz-Real) was performed according manufacturer's instructions and EPPO (2004) protocol.
RT-PCR
The one step RT-PCR protocol described by Wetzel et al. (1992) was used, according EPPO (2004) amplification protocol.
NASBA-FH
NASBA-FH reactions were performed according to Olmos et al. (2007).
Evidence Based Approach
Analyses of diagnostic data were performed with 2 × 2 contingency tables, enabling indicators of the operational capacity of each technique to be calculated. Sensitivity and specificity were calculated according to Altman and Bland (1994a). Sensitivity was the proportion of true positives that were correctly identified by the method. Specificity was the proportion of true negatives that were correctly identified by the method. Positive and negative predictive values were estimated according to Altman and Bland (1994b). Predictive values targeted data in the direction of the analyses results. Positive predictive value was the proportion of plants with positive results given by the method, correctly diagnosed. Negative predictive value was the proportion of plants with negative results by the method, which were correctly diagnosed. Confidence intervals (95%) were calculated for these indicators, which represents a simple proportion. Confidence interval for a simple proportion, p drawn from a normal distribution is:
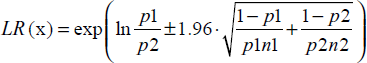
When specifying the negative likelihood ratio (LR (x) = likelihood ratio -), p1 = 1-sensitivity, p2 = specificity, p1n1 = false negatives, and p2n2 = true negatives.
Likelihood ratios based on a ratio of sensitivity and specificity were used to quantify the probability of disease for any individual plant. Bayes’ theorem was used to translate the information given by the likelihood ratios into a probability of disease. Bayes’ theorem states that the pre-test odds of disease multiplied by the likelihood ratio yields the post-test odds of disease. Post-test probabilities using likelihood ratios were calculated as follows:
Pre-test probability = prevalence
Pre-test odds = prevalence/(1-prevalence)
Post-test odds = pre-test odds × likelihood ratio Post-test probability = post-test odds/(1+post-test odds)
Likelihood ratios of several methods were sequentially combined in the formula: post-test odds = pre-test odds × likelihood ratio 1 × likelihood ratio 2 × likelihood ratio 3 (Neves et al. 2004).
Results
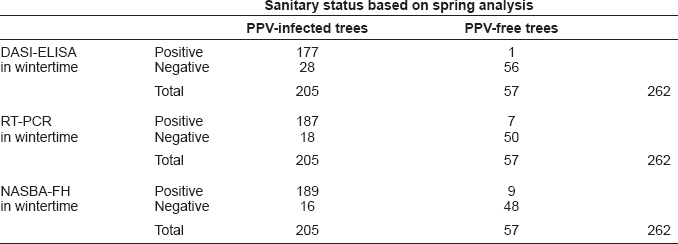
Results for all methods in wintertime (according previous tests by Olmos et al. 2007) are summarized below considering the true sanitary status of a tree that one diagnosed in early springtime because infection does not occur during the dormant period. Diagnosis was based on coincidental results of the three diagnostic methods (259 out of 262 trees). In those scarce cases (3 out of 262 trees) tested positive only by two methods, visualization of symptoms confirmed PPV infection.
A total of 205 out of 262 trees were considered PPV infected: DASI-ELISA, RT-PCR and NASBA-FH tested positive in 202 out of 205 trees (176 out of 184 plums and 26 out of 69 apricots), and RT-PCR, NASBA-FH and visualization of symptoms in springtime were positive for 3 out of 205 trees (all of them in apricots trees):
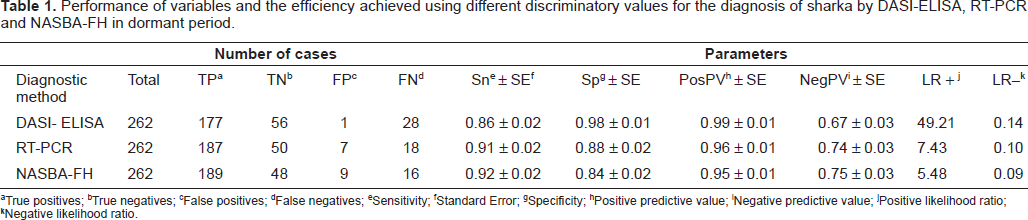
Parameter results of the dormant period for the different diagnostic methods assayed are listed in Table 1. The highest sensitivity was obtained by NASBA-FH 0.92 (95% CI: 0.89–0.96), followed by RT-PCR 0.91 (95% CI: 0.87–0.95) and DASI-ELISA 0.86 (95% CI: 0.82–0.91). The method with the highest specificity was DASI-ELISA 0.98 (95% CI: 0.95–1.01), followed by RT-PCR 0.88 (95% CI: 0.79–0.96) and NASBA-FH 0.84 (95% CI: 0.74–0.94). The prevalence of PPV detection was 78%, where the highest positive predictive value was obtained by DASI-ELISA 0.99 (95% CI: 0.98–1.01) followed by RT-PCR 0.96 (95% CI: 0.94–0.99) and NASBA-FH 0.95 (95% CI: 0.93–0.98). In the case of negative predictive value the highest value was obtained by NASBA-FH 0.75 (95% CI: 0.64–0.86), followed by RT-PCR 0.74 (95% CI: 0.63–0.84) and DASI-ELISA 0.67 (95% CI: 0.57–0.77).
Sanitary status based on spring analysis
Performance of variables and the efficiency achieved using different discriminatory values for the diagnosis of sharka by DASI-ELISA, RT-PCR and NASBA-FH in dormant period.
True positives;
True negatives;
False positives;
False negatives;
Sensitivity;
Standard Error;
Specificity;
Positive predictive value;
Negative predictive value;
Positive likelihood ratio;
Negative likelihood ratio.
Positive likelihood ratios were: 49.21 (95% CI: 7.05–343.67), 7.43 (95% CI: 3.71–14.89) and 5.48 (95% CI: 3.20–10.65) for DASI-ELISA, RT-PCR and NASBA-FH, respectively. Negative likelihood ratios were: 0.09 (95% CI: 0.05–0.15), 0.10 (95% CI: 0.06–0.16) and 0.14 (95% CI: 0.10–0.20) for NASBA-FH, RT-PCR and DASI-ELISA, respectively.
Results of the post-test probability of PPV infection based on the diagnostic results of only one method (DASI-ELISA or PCR), two methods, as recommended by EPPO protocol (EPPO, 2004) and three methods including NASBA-FH for discordant results, considering different prevalence values are listed in Table 2. The graph of the post-test probabilities illustrates the discriminatory power of applying a single method, two or three methods (Fig. 1). This figure shows the post-test probabilities of PPV detection as a function of the pre-test probabilities. The pre-test probabilities range from 0% to 90%. In this graph plotting post-test probability against pre-test probability, the effect of the test result is described by two curves, one for a positive result and the other for a negative one (Lamb, 2007). The vertical distance between a point on the line shows the post-test probability and the equity line indicates the size of the difference between pre-test and post-test probabilities as well as the direction of the decision making. After post-test probability was determined, decision analysis was performed deciding whether the probability was high enough to confirm diagnosis, sufficiently low to exclude diagnosis, or intermediate in which case a further diagnostic method was required. The design of a practical work plan for PPV diagnosis in dormant periods involved critical appraisals: i) evaluation of sensitivity and specificity of methods to select the most sensitive to discard the presence of PPV because it supplies an accurate diagnosis of healthy plants and the most specific method to confirm the presence of PPV because it gives an accurate and reliable diagnosis of true infected plants; ii) evaluation of cost per analysis, estimating 0.75 euros per DASI-ELISA analysis, 1.5 euros per RT-PCR and 3.5 euros per NASBA-FH; iii) post-test probability of disease; and, iv) different scenarios with various PPV prevalences.
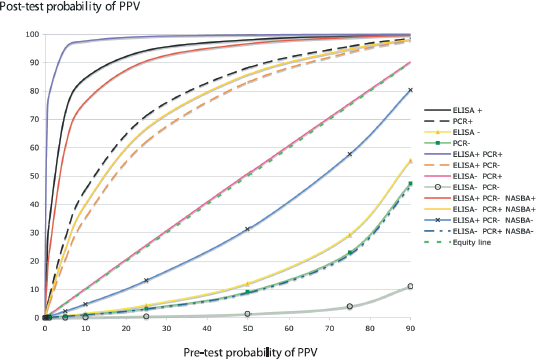
Simultaneous plot of post-test probabilities for both positive and negative test results as function of pre-test probability.
Probability of PPV infection scores for results of DASI-ELISA, RT-PCR and NASBA-FH assays performed in wintertime.
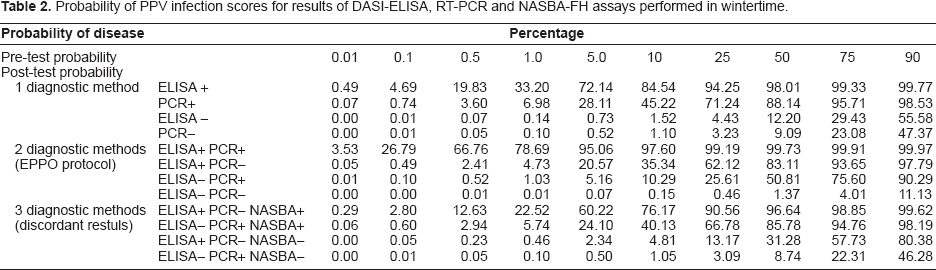
Figure 2 suggests a practical work plan for PPV diagnosis in dormant periods considering cost per analysis, sensitivity and specificity of tests and the information provided regarding the probability of disease for a positive and a negative test result.
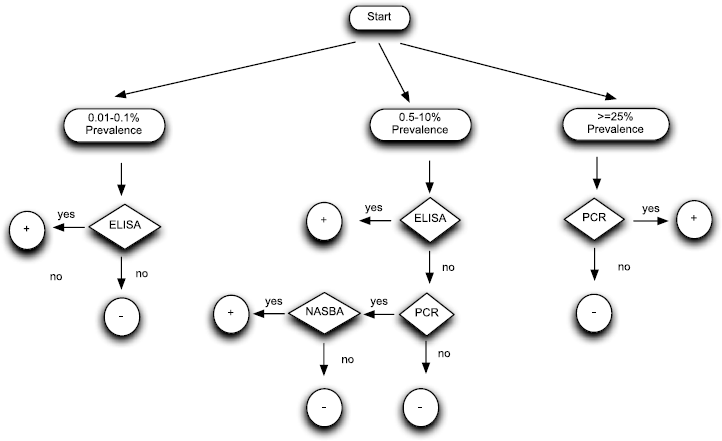
Decision scheme for wintertime diagnosis. Integration into an algorithm of the properties of diagnostic methods and their application through Bayesian theory.
Discussion
PPV detection in the dormant period has important drawbacks due to false negative (sensitivity) but also false positive (specificity) results by conventional serological and molecular methods with high proportion of non-coincidental results between DASI-ELISA and RT-PCR. However, there are cases, which testing plant material in such problematic season is a necessity, emerging a professional demand to improve the accuracy of PPV diagnosis by routine diagnostic methods in dormant periods. In this study, an evidence-based approach was used, estimating the sensitivity, specificity and likelihood ratios for wintertime of DASI-ELISA and RT-PCR.
The comparison between DASI-ELISA and RT-PCR results of the dormant period shows that the most sensitive was the molecular method. RT-PCR detected PPV in 91% of trees with PPV infection confirmed in early spring, whilst DASI-ELISA detected PPV in only 86% infected trees. The most specific test resulted DASI-ELISA correctly identifying 98% of PPV-free trees, while RT-PCR made only an accurate diagnostic of 88% of PPV-free trees. Based on these results it appears that the screening method for wintertime should be RT-PCR. However, in large-scale surveys, false-positive PPV-infected trees might be diagnosed. Consequently, for an accurate diagnosis, all positive test results should be confirmed by DASI-ELISA that on the other hand it has lower sensitivity. NASBA-FH could solve discordances but this method is new (Olmos et al. 2007) and to be widely accepted it would require a validation by ring tests assays and a period of time used as routine test in large-scale analysis. At this point, an evidence-based approach can be performed in order to facilitate PPV diagnostics because the results of any method are not considered in isolation but are interpreted in conjunction with all other information that is available such as likelihood ratios and prevalence. Likelihood ratios are parameters that do not vary with prevalence or PPV incidence. Applying a Bayesian approach, such as that performed in medical practice (Gross, 1999; Sonis, 1999; Sackett et al. 2000), likelihood ratios can be combined with a prevalence of PPV and a test result in wintertime to estimate the probability of a tree of testing positive for PPV by DASI-ELISA and RT-PCR in springtime. Likelihood ratios are useful in assessing the potential utility of a test and those >10 or <0.1 generate large changes in post-test probability whilst likelihood ratios ranging from 0.5 to 2 have little effect (Sackett et al. 2000). The likelihood that a result correctly indicates the sanitary state of a plant in springtime is the post-test probability of PPV infection. In plant pathology Bayesian inference and methodology also is used increasingly (Garrett et al. 2004; Mila and Carriquiry, 2004; Mila and Michailides, 2006). In this study, this methodology focused on diagnostic tests that can be defined as procedures that change the estimate of the probability of a tree to be PPV infected in springtime. Pre-test probability of PPV or prevalence might modify the interpretation of a diagnostic result because post-test probability of PPV could vary. After the post-test probability has been estimated, the next step is to decide if it confirms or rejects diagnosis or an additional diagnostic method is necessary (Aldington et al. 2006).
Evidence-based approach modifies the previous criterion obtained only by sensitivity and specificity to use RT-PCR as screening test and DASI-ELISA as confirmation test. For instance, the probability of a negative result in wintertime by DASI-ELISA given a prevalence value ranging from 0.01 to 0.1%, confirms in practice PPV-free status of a tree in springtime, with similar post-test probability than that afforded by RT-PCR. A positive result by DASI-ELISA in wintertime provides much more post-test value than RT-PCR. Thus, the information that evidence-based approach offers is that DASI-ELISA should be used as screening test at very low levels of PPV incidence (0.01–0.1). In the case of prevalence level ranging from 0.5 to 10% post-test probability of negative results by DASI-ELISA are a little higher than RT-PCR. This information suggests that in general DASI-ELISA could be used as screening test in wintertime surveys but if a more accurate PPV status of a tree was required RT-PCR for negative results should be performed and confirmed. However, a positive result by DASI-ELISA gives a much higher post-test probability of PPV infection, not requiring confirmation by RT-PCR. The last scenario is that one with PPV prevalences ranging from 25 to 90%. Evidence-based approach suggest that RT-PCR should be used as screening test due to its lowest pos-test probability of negative results, not requiring confirmation for positive results due to its high post-test probability of PPV infection. Alternatively, when test accuracy is a priority, the cases where DASI-ELISA and PCR give discordant results a third complementary test such as NASBA-FH can be very helpful because improves diagnostic accuracy and consequently improves the assessment of the sanitary status of a plant, so this strategy is justified in such cases.
Some guidelines to interpret diagnostic results of wintertime by routine tests are suggested in an attempt to minimize risks associated with the methods and over-reliance on the binary outcome of a single assay
This study substantiates the difficulty in ascertaining wintertime diagnosis. In most critical cases concerning export-import of plant materials, incorrect analysis could be the cause of the introduction of PPV into new areas. In fact, most protocols for PPV diagnosis only focus on positive results that can be confirmed by two methods (EPPO 2004). In the event of a negative result by one method (DASI-ELISA or RT-PCR) these protocols do not require confirmation, implying that the disease is not present in a tree and consequently it can be traded. However, post-test probability analysis demonstrates that this assessment has to be clarified because at low, medium or high levels of prevalence, the selection of diagnostic method is different. The use of a third method such as NASBA-FH also clarifies diagnosis when discordant results are obtained by DASI-ELISA and RT-PCR and consequently it should be included for those critical cases where PPV-free material is essential.
Footnotes
Acknowledgements
This work was supported by GV05/198 (IVIA, 8508) and CICYT AGL2005-01546 projects. E. Bertolini is recipient of a Juan de la Cierva contract from Ministerio de Educación y Ciencia of Spain. English text revised by F. Barraclough.