
Abstract
Wilms tumor is the most common malignant tumor in the pediatric kidney. Anaplasia, focal or diffuse as defined by histological criteria, is the most important parameter to guide the clinical treatment plan. We sought to identify and characterize potential useful biomarkers associated with anaplasia and provide insight into the peculiar molecular biology of Wilms tumor with unfavorable histology.
Utilizing isobaric tagging technology for relative and absolute quantitation, coupled with tandem mass spectrometry, we identified proteins that are differently regulated in different Wilms tumor histologies. Four Wilms tumor specimens were selected, including two with classic favorable histology, one with focal anaplasia, and one with diffuse anaplasia. A total of 256 proteins with a Protein Score >1.0 are identified from all samples (proteins with >90% confidence).
Compared with classic favorable morphology: in the focal anaplasia group, we identified a total of 26 proteins of which six were underexpressed and 20 were overexpressed; in the diffuse anaplasia group, we identified a total of 20 proteins of which eight were underexpressed and 12 were overexpressed. With a total of 39 involved proteins, seven were common to both the focal and diffuse anaplasia cases, and clearly seemed to have a similar regulation. The newly identified potential markers for Wilms tumor with unfavorable histology include ENO1, GAPDH, ALDOA, SLC25A6, LDHA, PGAM1, MIF, RBP1, HBA, HP, COL1A1, CFL1, and FSCN1 etc. In Wilms tumors, though there are unfavorable histology differences (focal or diffuse anaplasia), the protein expression seems to be similarly dysregulated compared with the favorable histology group. The newly identified potential markers may provide insights into the molecular biology of Wilms tumor and may have practical implications.
Keywords
Introduction
Wilms tumor is the most common malignant pediatric kidney tumor; the incidence is approximately one in every 8,000 children with about 400 to 500 new cases diagnosed per year in United States.1,2 Although the prognosis of the Wilms tumor has improved remarkably, from a survival of 8% at the turn of 19th century, to about 50% in the 1960s and greater than 90% in 2000,2–4 the outcome is still quite dependent on the specific type of tumor histology. Most important is nuclear anaplasia, which often dictates the individualized treatment plan. Other important prognostic factors include age of presentation, stage, and loss of heterozygosity for chromosome 1p and 16q. However, hitherto, anaplasia remains the single most important histological predictor of response and survival of Wilms tumor patients. The molecular biology of Wilms tumor with its different histology variants is an intriguing and challenging area of biomedical research.
Nuclear anaplasia, defined by histological criteria, refers to the presence of multipolar polyploid mitotic figures and marked nuclear enlargement and hyperchromasia; in simpler terms, the tumor has foci with more pleomorphic features than usual. There are specific histologic criteria to define anaplasia; however, these definitions are complex, quite strict, and continuously evolving. 5 Despite the strict criteria, there are certain degrees of subjectivity in evaluating them. To complicate the issue even more, anaplasia can be so focal that it can be totally missed even by seasoned pathologists. Furthermore, when sampling of the tumor is not extensive enough, the presence of anaplasia may not be recognized. The exact molecular basis of anaplasia is presently unknown, although some data have shown that p53 mutation is involved.6,7
From a genomic profiling approach, some useful but limited studies have been accomplished. Preliminary profiling of Wilms tumor gene expression by cDNA has been attempted. One study revealed differential expression pattern of 96 genes among 588 genes tested, compared with both normal mature and fetal kidneys. 8 In another cDNA array study, 97 clones among 9240 clones tested that can separate Wilms tumor with favorable histology and anaplasia were identified. 9
A disadvantage of the genomic approach is that only known genes can be studied. From a proteomic perspective, though some attempts have been made to identify tumor markers for Wilms tumor, to this date there has been limited success. 1 Few attempts have been made to identify tumor markers that are unique to Wilms tumors with unfavorable histology (anaplasia). One study demonstrated with classical comparative 2D Gel analysis that Wilms tumor has a unique protein expression pattern comparing with other kidney tumors such as clear cell renal cell carcinoma, papillary carcinoma, and oncocytoma, and identified some unique zinc finger proteins as potential tumor markers that have been isolated and identified with capillary LC-MS/MS. 10
Mass spectrometry based proteomics is a very promising technology, and has been shown to have great potential in identifying and characterizing biomarkers for different diseases and provide help in diagnosis and management.11–13 In recent years, many studies have elucidated protein biomarkers in a wide array of diseases, 14 including many new biomarkers discovered for cancer.14–16 However, hitherto, the application of this technology to pediatric solid tumors studies is limited, and no study to our knowledge has been published on proteomic profiling of Wilms tumor with unfavorable histology. The initiating point of this study was to lay down some framework in improving diagnosis of pediatric kidney tumor, and in particular, to identify and characterize potential new protein biomarkers to facilitate the detection of the presence of anaplasia in Wilms tumor.
Most recently, tandem mass spectrometry based isobaric tagging technology for relative and absolute quantitation (iTRAQ) protein profiling technology has been instrumental in measuring changes in protein expression levels, enabling researchers to compare proteins from up to eight samples via isobaric labeled tags.17,18 The individual protein samples are first reduced and alkylated to block cysteine cross linkage in proteins and are digested to then be labeled with the isobaric tags. All iTRAQ reagent-labeled samples are then combined into one sample mixture for LC-MS/MS analysis. The chemical tags consist of a reporter group, a balance group, and a peptide reactive group. The protein reactive group uses amine-reactive chemistry to specifically label all N-terminal peptides and lysine side-chains. The balance group changes in concert with the reporter group with stable isotopes to maintain a constant total mass while also providing a neutral loss fragment in MS/MS scans. The reporter group gives up to eight different signature ion signals in MS/MS spectral mode at nominal masses 113 to 119 in single mass step intervals and at 121. The intensity ratios of the reporter ions are used to determine the ratios of the trypsin digested peptides from the corresponding proteins of the eight different samples. Potential losses during analysis occur equally and the ratios allow comparative quantification to be carried out efficiently.17,18 In this study, we utilized iTRAQ-labeling technique followed by multidimensional LC-MS/MS analysis to study the changes in protein expression levels in Wilms tumor with different histology.
The aims of the present study were to: (1) Compare the proteomic profiles of Wilms tumor with unfavorable histology (those with focal or diffuse anaplasia) and Wilms tumor with favorable classic triphasic histology. (2) Compare the proteomic profiles of Wilms tumor with focal anaplasia and diffuse anaplasia. (3) Screen for possible biomarkers that could potentially help with the diagnosis of anaplasia and possibly stratify treatment options. (4) Explore the new insights of the molecular biology of Wilms tumor with unfavorable histology.
Material and Methods
Case selection and tissue processing: tumor tissues are from nephrectomy specimens of patients diagnosed with Wilms tumor and treated at Riley Hospital for Children, Indianapolis, Indiana. All the diagnoses were confirmed by Children's Oncology Group central review. The specimens were received from surgery fresh and tumor samples were frozen in -80 °C within a half hour of removal. The study was approved by IRB of Indiana University School of Medicine.
Four patient samples in duplicates are compared, including two Wilms tumor with favorable triphasic histology, one patient with focal anaplasia, and one patient with diffuse anaplasia. The key relevant patient information is as follows:
Patient A was a 3-year-old female with a left sided blastema predominant Wilms tumor with focal anaplasia. The tumor was treated with resection, chemotherapy, and stem cell transplant. Despite intensive treatment, the tumor recurred and metastasized within 6 months.
Patient B was a 1-year-old male, with a left sided classic triphasic Wilms tumor without anaplasia. The tumor was resected and there has been no recurrence with 3 years followup.
Patient C was a 2-year-old male with a left sided classic triphasic Wilms tumor without anaplasia. The tumor was resected and there has been no recurrence with 4 years followup.
Patient D was a 4-year-old female with bilateral Wilms tumors with lung metastasis. Bilateral partial nephrectomy followed neoadjuvant chemotherapy. The right sided tumor had good response to chemotherapy. The tumor on the left side upper pole showed no response to chemotherapy and histology revealed diffuse anaplasia. The specimen for proteomic study was from this part. Other treatment included radiation therapy to the lung and abdomen. The patient was doing well at 2-year followup.
iTRAQ sample labeling and LC-mass spectrometry analysis: the four tissue samples destined for iTRAQ analysis were dissolved in 20 μl of 8 M urea, 300 mM triethylammonium bicarbonate prior to reduction (2 μl of 45 mM DTT and incubation at 37 °C for 20 minutes) and alkylation (4 μl of 100 mM Iodoacetamide and incubation at ambient temperature for 20 minutes). To determine protein content of the individual samples, amino acid analysis was performed while the samples were stored frozen at -20 °C. After amino acid analysis, the samples were treated for dual digestion (approximate protein:enzyme ratio of 100:1) by bringing the urea sample solution concentration to 2 M and by adding 10 μl of 1 mg/ml endopeptidase Lys-C, incubated at 37 °C for 5–16 hours, followed by the addition of 10 μl of 1 mg/ml trypsin incubated at 37 °C for 16 hours. All four samples at this point were doubled into 50 μg aliquots, labeled with the appropriate eight plex tag, and were incubated at ambient temperature for 2 hours in 50 μl isopropanol. After the incubation, the tagged samples were combined, acidified (2 μl 1 M phosphoric acid), and fractionated off line by cation exchange chromatography on an Applied Biosystems Vision workstation. A 2.1 mm x 200 mm PolySULFOETHYL A™ column (PolyLC Inc.) with a linear 118 minute gradient (buffer A: 10 mM potassium phosphate, 25% acetonitrile pH 3.0 and buffer B: 10 mM potassium phosphate, 25% acetonitrile pH 3.0, plus 1M potassium chloride) was used to collect 19 fractions. Each of the cation exchange fractions was dried and resuspended in 5 μl 70% formic acid, diluted to 15 μl with 0.1% trifluoroacetic acid prior to loading onto an Applied Biosystems QSTAR Elite mass spectrometer interfaced with the Dionex Ultimate LC workstation. This setup allowed the preconcentration and the desalting of the samples on a 5 mm C18 Dionex PepMap trap column. The reversed phase high performance liquid chromatography separation was carried out at a flow rate of 400 nl/min on an inline 100 μm x 15 cm Waters Atlantis C18 column. Initial high performance liquid chromatography conditions were 95% buffer A and 5% buffer B with the following linear gradient: 3 min, 5% B; 43 min 37% B; 75 min 75% B; and 85 min 95% B. Buffer A consisted of 98% water, 2% acetonitrile, 0.1% acetic acid, and 0.003% trifluoroacetic acid. Buffer B contained 80% acetonitrile, 20% water, 0.09% acetic acid, and 0.003% trifluoroacetic acid. The QSTAR Elite QTOF tandem mass spectrometer was run in a data dependent mode with a single 0.5 second long precursor ion spectral scan (400–1500 m/z range) followed by the three fragment ion scans (80–1600 m z range) at 1.5 second each for each of the 3 highest intensity precursor ions selected for collisional induced activation (CID). Protein identification on the resulting LC/MS and MS/MS datasets is accomplished using Paragon algorithms (Applied Biosystems, Toronto, Canada) on a database that combines both normal and decoy sequences so as to determine false positive rates. Protein quantitation is performed using the Applied Biosystems ProteinPilot (v2.0) software, which separately integrates the reporter ion peak areas and combines the Paragon protein identification producing a table with both the identifications and ratios. The Matrix Science MASCOT Server 2.2 (Linux, Cluster) database search was also used as a complementary identification platform, but only ProteinPilot results are reported here. Protein identification lists from both search engines are exported and uploaded into Yale Protein Expression Database, 19 which can be made publicly available for viewing of the results.
Data Analysis
iTRAQ data analysis with ProteinPilot was performed using human Celera protein sequence database, which contains 178,239 protein sequences from many databases including NCBI's nr, refseq, Swiss-Prot, TrEMBL, and Celera. ProteinPilot approaches sequence identity with Paragon algorithm. To reduce redundancy of proteins identified, an “unused score” that is to reflect uniqueness of each peptide is assigned; the cutoff of unused score is 1.0, which corresponds to 90% confidence level. Relative quantitation of proteins is obtained from the MS/MS data and is the ratio of the areas under the duplicate reporter ion peaks corresponding to a focal anaplasia (m/z 113, 114), two favorable histology (m/z 115, 116; 117, 118) and a diffuse anaplasia (m/z 119, 121) samples. To evaluate the statistical significance of the protein expression ratios that were run in duplicates, the reporter ion area values from the ProteinPilot were exported to an Excel spreadsheet and the statistical evaluations were performed manually. Only the peptides with very stringent criteria were chosen for quantitation. This included all the peptides that had better than 90% identification confidence level, and peptides corresponding to average reporter ion intensities of 30 and above.
Results
Of the total 256 proteins with a Protein Score > 1.0 identified from the 19 LC-MS/MS runs that correspond to false discovery rates of less than 1% calculated by the ProteinPilot data, 152 proteins with 1103 peptides were used for iTRAQ quantitation (see Supplemental Table 1S).
All of the ratio values are derived from the reporter ion intensities in the MS/MS spectra corresponding to the individual precursor peptide ions. A representative mass spectrum for one of the eight quantitated peptides for SERPINA3 protein is shown in Figure 1. The data, with eight different reporter ions compared the ratios of a single focal and a single diffuse anaplasia patient sample to two different favorable histology Wilms tumor patient samples in technical duplicates. With rare exceptions, the differential protein expression pattern is highly repetitive (ie, the proteins upregulated in one comparison showed downregulation in another).
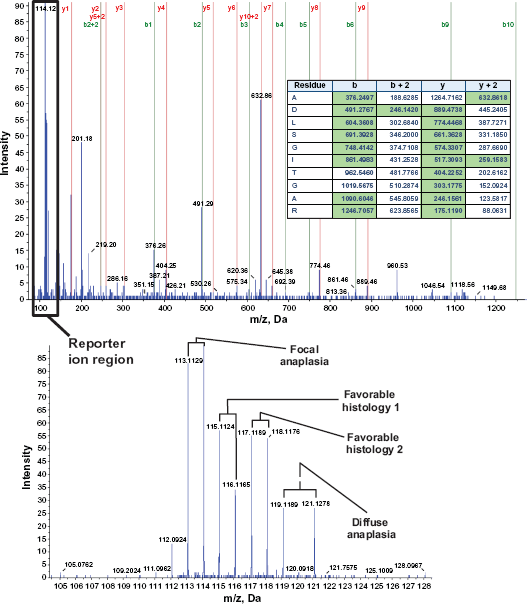
Representative mass spectrum. MS/MS Spectrum of doubly charged 632.9++ Precursor Ion identified as ADLSGITGAR trypsin digested peptide from SERPINA3 Protein (top). Series b and y fragment ion assignments that match the theoretical fragment ions within 0.2 Da are labeled on the spectrum. The corresponding matching theoretical m/z values are also highlighted in green on the table inside the spectrum. Zoomed reporter ion m/z region with eight of the corresponding ion peaks for all the iTRAQ reagent labeled patient samples can be seen in the lower spectrum.
The reporter ion intensity ratios for all the filtered peptides were calculated and were converted to log2 values so statistical averaging can be done between the ratios of case (focal anaplasia, diffuse anaplasia) over control (favorable histology) and the replicate samples. Since it is expected that all the technical and biological replicates (between the two favorable histology samples) should be 1:1, all the log2 ratio values were normalized accordingly. Figure 2 shows an example of the resulting normalized focal anaplasia/ favorable histology and diffuse anaplasia/favorable histology calculated ratio values and the ratios of all the reporter ions from duplicate samples that are supposed to have log2 ratios of zero for four identified peptides in isoform 1 of L-lactate dehydrogenase A chain (LDHA) protein. As the figure shows, this protein is found to be upregulated by an average value of 2.2x only in the focal anaplasia sample corresponding to an average P value well below 10-3 (see also upper left panel on Fig. 3B). Plots as shown in Figure 2 represent how proteins are selected and calculated as being up- or downregulated in Wilms tumor samples from the 152 quantified proteins. For each peptide, eight of the focal anaplasia/favorable histology (red circles) and eight of the diffuse anaplasia/favorable histology (blue circles) ratio groups were compared to the replicate sample ratios including the replicates from the two favorable histology samples (solid circles). Only if the resulting P values between the case/control and the replicate ratio groups were below 0.01 indicating 99% confidence levels (-log10 P > 2), that these proteins were considered to be up- or downregulated.
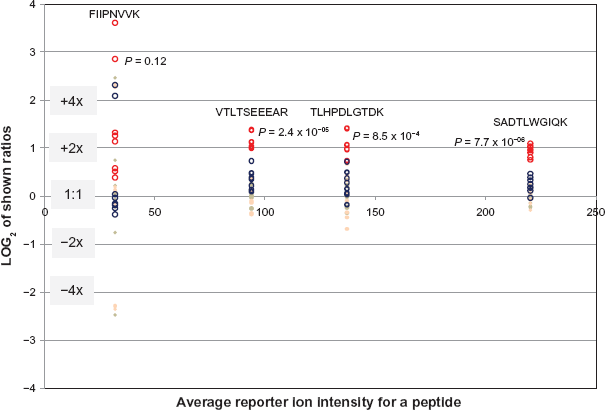
Log2 plot of the reporter ion ratios for four detected peptides for LDHA (Isoform 1 of L-lactate dehydrogenase A chain) protein. The ratios on the vertical axis are plotted against the average signal of the 8 reporter ions shown on the horizontal axis. The red circles indicate the ratios of the focal anaplasia (FA) reporter ions (113, 114) over the four favorable histology (FH) sample reporter ions (115–118). The blue circles indicate the ratios of the Diffuse Anaplasia (DA) reporter ions (119, 121) over the same favorable histology sample reporter ions. The 8 beige solid circles for each peptide are the technical repeat ratios of the reporter ion signals (113/114, 114/113, 115/116, 116/115, … etc.) which should be 1:1, and the 8 pink solid circles are the ratios of the two Favorable Histology (FH) samples to each other (113/117, 113/118, 114/117, 114/118, 119/117, … etc.). The red circle plots in this figure show the significant upregulation (average = 2.2x) of the LDHA protein in Focal Anaplasia tumor over the favorable histology samples. The indicated P values are calculated between the FA/FH ratio distribution and the combined distribution of the technical and the two biological replicate ratios (open vs. solid circles). The plots suggest significant upregulation of LDHA in focal anaplasia, but not in diffuse anaplasia.
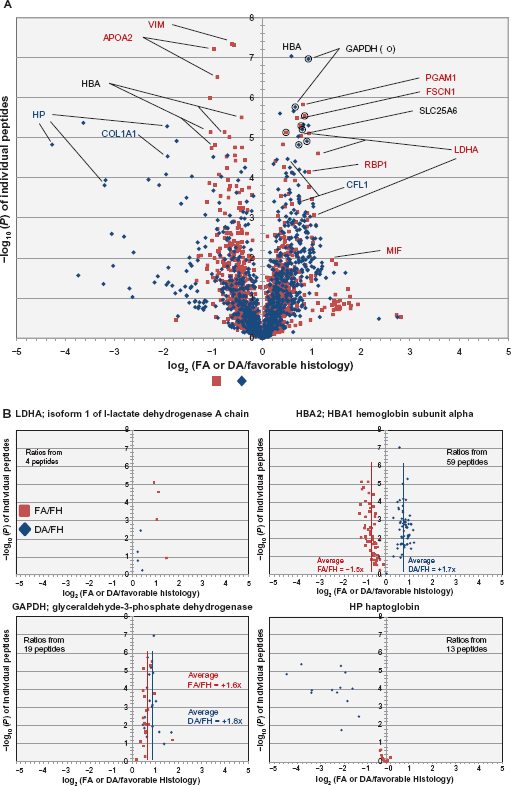
Volcano plots showing the average iTRAQ reporter ion signal ratios of FA/FH (red squares) and DA/FH (blue diamonds) samples in log2 scale (doubling units) graphed against the -log10(P) values of each of the observed and identified peptides (A). log10(P) values for the ratios that are larger than or equal to 2 (P < 0.01) are considered significant to be included in the overall selection of over expressed and under expressed proteins. Some of the gene names for the proteins are highlighted in red text (significant change in FA/FH), blue text (significant change in DA/FH) and black text (significant change in both FA/FH and DA/FH) for a few of the representative peptides in graph 3A. For clarity, full distribution of all the peptides for four of the selected proteins are individually plotted in figure (B) in four separate panels. These panels show for example, how LDHA is predominantly upregulated only in FA cases (upper left), HP is predominantly down regulated only in DA cases (lower right), GAPDH is upregulated in both the FA and DA cases (lower left), and how HBA2 and 1 are upregulated in DA but down regulated in FA (upper right) when compared to Favorable histology cases. For each of the four proteins, the number of peptides quantitated is indicated in the individual panels. Average FA/Fh and DA/FH ratios for all the peptides are also highlighted for two of the proteins (HBA and GAPDH) by vertical red and blue lines, respectively.
Figure 3A shows the average values of eight focal anaplasia/favorable histology and eight diffuse anaplasia/favorable histology ratios plotted against the -log10(P) values of all the individually quantitated peptides. The resulting volcano plot for the distribution of all the focal anaplasia/favorable histology (red squares) and diffuse anaplasia/favorable histology (blue diamonds) values are overlaid into a single graph for all the quantitated peptides. Some of the peptides in this figure are annotated in different colors as representatives of proteins that are found to be significantly up- or downregulated in focal (red), diffuse (blue), or both focal and diffuse (black) anaplasia cases, respectively. A more detailed plot of some of these peptides is shown in Figure 3B for four of the proteins. These proteins are shown to exemplify the different categories of expression changes found in this study between the two different anaplasia cases. For example, LDHA is upregulated only in focal anaplasia, haptoglobin (HP) is downregulated only in diffuse anaplasia, glyceraldehyde-3-phosphate dehydrogenase (GAPDH) is upregulated in both focal and diffuse anaplasia, and hemoglobin subunit alpha (HBA1 and 2) is reversely regulated between the two anaplasia cases.
After all peptide ratios and the -log (P values) for each of the proteins were averaged, the qualified proteins for underexpression and overexpression with P values <0.01 (-log10 > 2) are listed in Tables 1A–C. The table also shows the number of peptides used in calculations for deriving the average values. Table 1A lists all of the proteins that show differential expression in Wilms tumor with focal anaplasia compared with classic favorable histology. Likewise, Table 1B shows proteins that demonstrate differential expression in Wilms tumor with diffuse anaplasia compared with classic favorable histology. The proteins in these two tables are sorted according to their highest to lowest -log10(P) values. Of the total of 39 differentially expressed proteins, we identified six proteins underexpressed and 20 proteins overexpressed for the focal anaplasia samples that ranged from -1.7x to +2.2x, and eight proteins underexpressed and 12 proteins overexpressed for the diffuse anaplasia samples ranging from -5.1x to +2.3x. There were five proteins that commonly overexpressed and one that commonly underexpressed for both of the anaplasia samples (see Table 1C). One exception to this was the HBA protein for which the expression pattern clearly seems to have gone in the different direction, -1.5x for focal anaplasia and +1.7x for diffuse anaplasia (see also Figure 3B upper right panel). The calculated average -log10(P) values for all the proteins in Table 1 ranged from the cutoff value of 2.0 (P = 0.01) to as high as 4.1 (P < 10-4).
List of Proteins showing statistically significant expression changes in focal anaplasia/favorable histology sample ratios (A), Diffuse anaplasia/favorable histology ratios (B) averaged from the shown number of detected peptides in the third column from left. All ratio values that meet P < 0.01 criteria are shown both in log2 and normal ratio format. The tables are sorted according to highest to lowest -log10(P) values in the last column. Proteins that show up or down regulation for both the focal anaplasia/favorable histology and diffuse anaplasia/favorable histology ratios that meet P < 0.01 criteria are listed in (C).
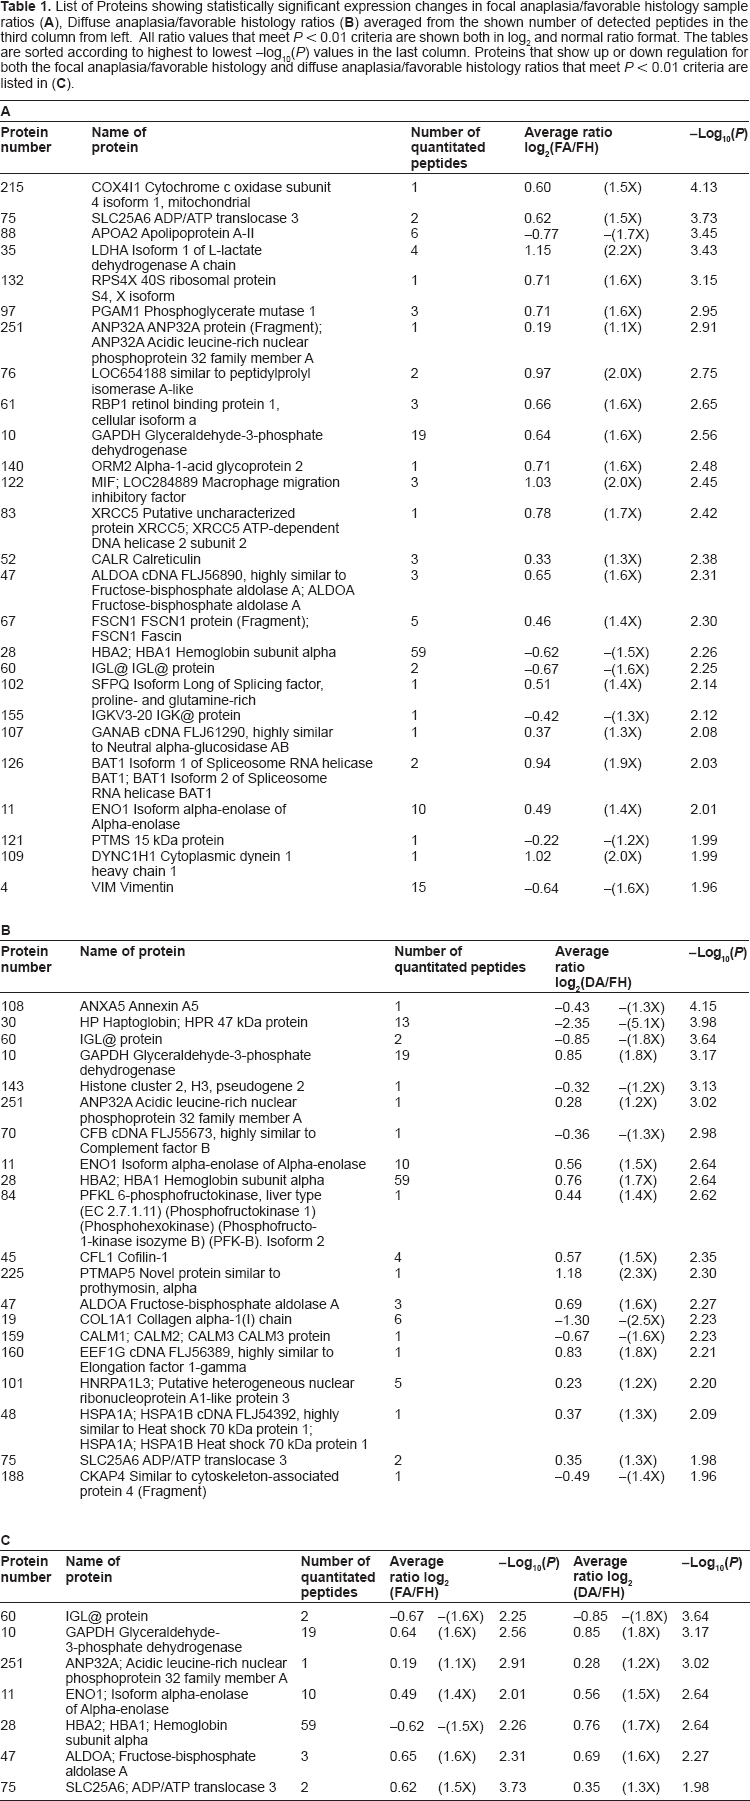
When another stricter criteria of two or more peptides is applied, compared with classic favorable morphology: in the focal anaplasia group, we identified four proteins underexpressed and 12 proteins overexpressed; in the diffuse anaplasia group, we identified three proteins underexpressed and seven proteins that are overexpressed. With the total of 20 proteins involved, six were common to both the focal and diffuse anaplasia cases. With these strict criteria, many interesting candidate biomarkers have emerged, including alpha enolase isoform 1 (ENO1); Glyceraldehyde-3-phosphate dehydrogenase (GAPDH); fructose-1,6-bisphosphate aldolase A (ALDOA); solute carrier family 25 (mitochondrial carrier; adenine nucleotide translocator), member 6 (SLC25A6); isoform 1 of L-lactate dehydrogenase A chain (LDHA); phosphoglycerate mutase 1 (PGAM1); macrophage migration inhibitory factor (MIF); retinol-binding protein 1 (RBP1); Hemoglobin subunit alpha (HBA); Haptoglobin (HP); collagen, type I, alpha 1 (COL1A1); cofilin1 (CFL1); fascin homolog 1, actin-bundling protein (FSCN1); etc. Some of these will be discussed in more detail in the next section.
Discussion
With Wilms tumor of unfavorable histology, either focal anaplasia or diffuse anaplasia, when compared with favorable histology, the protein expression profiles are very similarly dysregulated. Proteins upregulated or downregulated in focal anaplasia are dysregulated in the same direction and magnitude as in Wilms tumor with diffuse anaplasia. This underscores the important belief that Wilms tumor with focal anaplasia and diffuse anaplasia are potentially in the same biological behavior group and share the same biomarkers. However, the data also shows that there are substantial differences in the up- and downregulated proteins that potentially give rise to different mechanisms that are reflected in the histological differences for the two unfavorable Wilms tumor types.
Some extremely interesting biomarkers have been identified, including GAPDH, ENO1, ALDOA, SLC25A6, LDHA, PGAM1, MIF, RBP1, HBA, HP, COL1A1, CFL1, FSCN1, etc., and they provide new insights into the puzzling biology of Wilms tumor with unfavorable histology. Of the many proteins observed, GAPDH, ENO1, ALDOA, and SLC25A6 are the striking proteins, demonstrating expressions upregulated in both focal anaplasia and diffuse anaplasia Wilms tumors.
The observation of upregulation of GAPDH in both unfavorable histology Wilms tumors is noteworthy. Previously known as abundant glycolytic enzyme, it recently emerged as a major intracellular messenger involving the so-called GAPDH mediated cell death cascade. 20 This immediately suggests a novel therapeutic approach, which is to use cytoprotective agents that will intervene via this pathway. The increased expression of GAPDH has also been observed in a proteomic study of renal cell carcinoma. 21
ENO1 is another glycolytic enzyme, well-known to be involved in basic energy metabolism, as well as plasminogen binding and activation. It has widespread tissue distribution and expression in the early stages of embryonic development; its elevation has also been documented in proteomic studies of clear cell carcinoma, 10 nonsmall cell lung cancer, 22 and hepatocellular carcinoma. 23 Another recent interesting study suggested that ENO1 autoantibodies can serve as a prognostic marker in advanced cancer patients, the serum level of which decreases in higher stage cancer patients. 24
ALDOA, another glycolytic enzyme, has been found to be elevated in human lung adenocarcinoma 25 and hepatocellular carcinoma, 23 and it is thought to be associated with the aggressiveness of the latter. The pattern observed in these glycolytic enzymes seems to be unmistakable–-increased level of glycolysis is a hallmark of cancers.
To our knowledge, the elevated SLC25A6 (ADP/ATP translocase 3) expression in both unfavorable Wilms tumor specimens has not been observed in any previously studied tumor setting. However, it is interesting to note that the gene is known to be X-linked 26 and both of patients with unfavorable Wilms tumor happened to be female. It could be argued that X chromosome inactivation may overcome the gene product imbalance, but a study published in Nature, in the year 2005, pointed out extensive variability in X-linked gene expression in females; it has also been shown that about 15% of X-linked genes in humans escape this inactivation. 27 The elevation of SLC25A6 in these two samples gives us perhaps good evidence to support the power of this comparative proteomic study with the planned future targeted proteomics approach (multiple reaction monitoring) to perform the validity of this protein biomarker.
A few of the examples of proteins that were significantly upregulated in only focal anaplasia Wilms tumor are PGAM1, MIF, orosomucoid 2 (ORM2), LDHA, FSCN1, and RBP1. All of these proteins or their genes have been previously described in other cancers and seem to have some basic biological mechanisms laid out.
Investigation into PGAM1 reveals overexpression of this protein is associated with about two-thirds of hepatocellular carcinoma and correlated strongly with poor differentiation and decreased survival rates, and shRNAs-mediated repression resulted in significant inhibition in liver cancer cell growth both in vitro and in vivo; 28 it is also claimed to be a highly prognostic hypoxia metagene after a large meta-analysis of multiple cancers. 29
MIF is a multifunctional cytokine that has been associated with inflammation and tumorigenesis.30–32 In lung cancer, it is shown to induce expression of angiogenic CXC chemokines; a recent study suggested that it regulates proliferation of gastric cancer cells via the PI3K/Akt pathway, 33 and it has also be explored as a serum biomarker 34 or a therapeutic target for ovarian cancer. 35
The dysregulation of a variant of ORM, also known as alpha-1-acid glycoprotein, in unfavorable versus favorable Wilms tumor is of interest. ORM2 (and ORM1) are also acute phase reactants, previously found in a variety of cancer types. ORM2 expression was only significantly elevated in focal anaplasia Wilms tumor. It is important to note that human ORM is a major binding protein for basic drugs 36 and their genetic pleomorphism may well be involved in the chemotherapy drug-resistance that characterizes unfavorable Wilms tumor.
FSCN1 is overexpressed in many kinds of tumors and typically is associated with progression and aggressiveness.37–40 The most interesting discovery about this protein is that it is increasingly linked to migration and invasiveness, not proliferation,41,42 and in a canine study was directly linked to metastasis. 43 It is perhaps more than a coincidence that in this study our patient with diffuse anaplasia also presented with distant metastasis. A recent study also seems to suggest that the oncogenic features of FSCN1 can be specifically targeted for tumor suppression. 44
RBP1 was first identified as a cellular protein that interacts with the pocket of pRB (retinoblastoma gene product). 45 The RBP1 gene has been found to be upregulated in cervical cancer and correlated with its invasion behavioral in a microarray study. 46 This family of proteins exhibit SUMOylation-dependent transcriptional repression and they are thought to induce cell growth inhibition. 47
HP, COL1A1, and CFL1 are a few of the examples of proteins of which the expressions were found to be significantly dysregulated only in the diffuse anaplasia Wilms tumor specimen. As an actin-modulating protein, CFL1 belongs to the ADF/cofilin family; it is instrumental for the regulation of actin polymerization and depolymerization during cell migration. CFL1 mRNA expression was positively correlated with regional lymph node metastasis and pathological staging in a study of esophageal squamous cell carcinoma; 48 a similar result was also observed in breast cancer. 49 The elevated expression of cofilin seems to be involved in activation of the Rho signal pathway to aggressively form disorganized actin filaments. 50 The increased CFL1 expression has also been observed in renal cell carcinoma. 51 HP, as an acute phase reactant that in diffuse anaplasia Wilms tumor has been shown to be significantly downregulated (average of 2.35 doubling or -5.1x), compared with favorable histology Wilms tumor levels. Whereas, in focal anaplasia, this protein exhibited no change whatsoever compared to the favorable histology samples (see Figure 3B lower right panel). This difference between the two unfavorable Wilms tumor cases is quite interesting and needs to be explored and verified further as a possible significant differentiating biomarker for the diffuse unfavorable tumor type.
A protein that is also noteworthy is HBA1 (and 2) since its expression went in different directions in two types of unfavorable Wilms tumor cases–- focal or diffuse anaplasia. Elevated HBA2 and HBA1 levels in diffuse anaplasia but not in focal anaplasia Wilms tumors could be correlated with the fact that in a diffuse Wilms tumor specimen there was significant tumor hemorrhage as a result of previous chemotherapy. But another, perhaps more plausible theory can be constructed that decompensation under hypoxia stress may be a factor leading to diffuse anaplasia as well as other more aggressive biological behaviors.
Upon further examination of the data, comparing the two favorable cases separately, it is interesting to note that there are a few proteins (not in Table 1) found to be significantly up- or down regulated when compared only to one of the two favorable histology samples. For example, the focal anaplasia or diffuse anaplasia samples showed remarkably different ratio groupings between the two favorable histology samples for SERPINA3, FGG and FGB proteins (Supplemental Figure 1A and 1B). It is known that favorable histology samples themselves can be categorized into different biological or histological subtypes; therefore, protein expression would be expected to be slightly different between different cases. It is our intent to further study many of the proteins identified here using a targeted proteomics approach where 20 to 50 proteins can be simultaneously monitored for a large number of patients and samples using the multiple reaction monitoring acquisition method with triple quadrupole mass spectrometers as a verification method and as a means to show how these proteins can be classified and verified with the observed histology.
In conclusion, two general observations on potential Wilms tumor biomarkers may be emphasized here. One is that many of them seem to be acute phase reactants and their discovery in a wide spectrum of cancers and inflammatory conditions is expected. Two, the upregulated expressions of glycolytic enzymes are part of Warburg Effect, which is also expected in many types of cancers. It is speculated that some more specific initiating proteomic level changes may be the ones not frequently turning up in the current approach. Some innovative strategies or combination of them may help in this direction. 12
This study also consolidated the notion that, with the exception of a few significant proteins like HBA, Wilms tumors with focal anaplasia and diffuse anaplasia are essentially the same in view of their molecular biology. The study identified significant numbers of new potentially useful biomarkers characterizing Wilms tumor with unfavorable histology as well as highlighted many interesting and previously unknown aspects of the molecular biology of this tumor. This study should help to bridge us into further exploration of a more extensive and more exciting territory of Wilms tumor research; in particular, these newly identified proteins seem to have provided valuable candidates of biomarkers for differential diagnosis, disease monitoring, prognosis, and novel therapeutic approaches. Some of the implications of the findings are summarized in Figure 4. As mentioned above, the future studies will be expended to many patients and will be targeted for proteins that are found to be significant from this discovery phase of the Wilms tumor research.
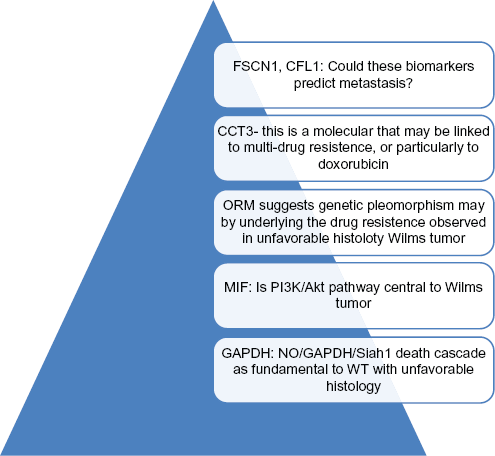
Some interesting proteins emerged after comparative proteomic studies of WT with different histologies. All the newly identified proteins can be potential useful biomarkers for diagnosis, prognosis, disease monitoring. In addition, proteomic studies of WT suggested many insights into the molecular biology and even treatment options of WT with unfavorable histology. Within the pyramid, there are many more potentials to be discovered.
Disclosures
Author(s) have provided signed confirmations to the publisher of their compliance with all applicable legal and ethical obligations in respect to declaration of conflicts of interest, funding, authorship and contributorship, and compliance with ethical requirements in respect to treatment of human and animal test subjects. If this article contains identifiable human subject(s) author(s) were required to supply signed patient consent prior to publication. Author(s) have confirmed that the published article is unique and not under consideration nor published by any other publication and that they have consent to reproduce any copyrighted material. The peer reviewers declared no conflicts of interest.
Footnotes
Acknowledgement
Authors want to thank the Department of Pathology, Indiana University School of Medicine for providing funding for this project. We also would like to thank Ms. Kathrin Wilczak for her iTRAQ treatment and running of the samples in the LC-MS platform and Dr. Chris Colangelo for his valuable advice on the analysis of the data. Finally, we thank Tracey Bender for secretarial research support throughout.