
Abstract
Femoral head necrosis (FHN) is a skeletal problem in broiler chickens, where the proximal femoral head cartilage shows susceptibility to separation from its growth plate. The selected birds with FHN showed higher body weights and reduced plasma cholesterol. The proteomic differences in the plasma of healthy and FHN-affected chickens were explored using matrix-assisted laser desorption ionization time of flight mass spectrometry (MALDI-TOF-MS) and liquid chromatography/electrospray ionization-tandem mass spectrometry (LC-MS/MS) to prospect for protein biomarkers. We isolated two differentially expressed low molecular weight proteins and identified them by MALDI peptide mass fingerprinting as fibrinogen- and fetuinderived peptides, respectively. These peptides were reduced in birds susceptible to femoral head problems. Quantitation of LC-MS/MS spectra showed elevated levels of gallinacin-9, apolipoprotein A1, and hemoglobin and reduced levels of alpha-1-acid glycoprotein, albumin, and SPINK7 proteins in FHN. These results suggest that the bodyweight and the lipid profiles along with the above proteins can be useful as noninvasive biomarkers of FHN.
Introduction
Femoral head separation (FHS) is a skeletal problem that affects the proximal femur in broiler chickens and renders them lame, compromising their walking ability and wellbeing.1,2 The separation of growth plate (GP) from its articular cartilage (AC) can lead to femoral head necrosis (FHN).3–6 A weak adhesion between GP and AC, likely, causes their separation in certain population of rapidly growing poultry. 4 Bacterial infection has also been implicated in the pathogenesis of FHN.7,8 The diagnosis of FHN is not possible until the late stages of the disease when the external symptoms such as poor posture and walking abnormality are evident. The current methods of diagnosis such as gait assessment are inadequate and subjective, whereas the assessment at necropsy is invasive and terminal.9,10 Hence, for the genetic selection of breeding population, there is a need for minimally invasive identification of birds with subclinical problems of FHN. Biomarkers such as blood metabolites, proteins, and enzymes have been used for the diagnosis of health problems, disease progression, and genetic selections. Although proteomic methods are widely used to explore for biomarkers associated with femoral head problems in human beings,11–13 they are seldom utilized to determine FHN-affected chickens.3,14,15 Hence, the objective of this study is to identify potential biomarkers of the disease by comparing the plasma protein profiles of healthy and FHN-affected chickens. Here, we employed both direct matrix-assisted laser desorption ionization time of flight mass spectrometry (MALDI-TOF-MS; top-down proteomics) and liquid chromatography and tandem mass spectrometry (LC-MS/MS; bottom-up proteomics) to elucidate protein differences to identify possible biomarkers of FHN in chickens. The MALDI analysis was used to compare the low molecular weight (<10 kDa) proteins that could be masked in the total proteome comparison using LC-MS/MS. The results of the studies are presented in this report.
Methods
Animals and blood collection
The animal procedures were approved and carried out in accordance with the University of Arkansas, Institutional Animal Care and Use Committee (IACUC) guidelines. Cobb broiler chickens intended for genetic selection were grown in farms using Standard Industry Practice. A random group of five-week-old chickens, were bled through wing vein and the blood was collected in EDTA-coated (BD Vacutainer®) tubes. The birds were killed subsequently to verify the separation of GP from AC in their proximal femurs. 15 The necropsy information was used to classify the chickens into two groups based on the propensity of the femur to separate or remain intact. When the GP showed severe damage and/or separation, the samples were classified as FHN. The samples from chickens with intact femur were classified as healthy (HLTH). Plasma samples obtained by centrifugation of blood were pooled in each group mixing in equal volumes from three birds/sample and stored at −20 °C until further analyses. The workflow of experiments is given in Figure 1.
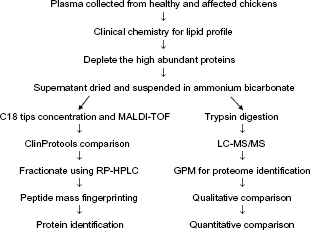
A workflow chart.
Clinical chemistry
Pooled samples from HLTH and FHN were analyzed for their cholesterol (CH), high-density lipoprotein (HDL), and triglyceride (TG) concentration using an express plus automated clinical chemistry analyzer (Ciba-Corning Diagnostics Corp.). Low-density lipoprotein (LDL) concentrations were calculated using the following formula: LDL = TC –HDL – TG/5.0 (mg/dL). 16
Plasma protein analysis
The pooled plasma samples from HLTH and FHN were depleted of their high-abundance proteins by acetonitrile (ACN) precipitation. ACN containing 0.1% formic acid (FA) was added to the individual tubes (3 HLTH and 3 FHN) to a final concentration of 60% ACN, sonicated for 10 minutes (Branson 3200), and kept at −20 °C for 24 hours.17,18 Supernatants containing the high-abundance protein-depleted (HAPD) fractions were dried using a CentriVap vacuum concentrator (Labconco) and suspended in 50 mM ammonium bicarbonate (AMBIC) solution with pH 7.8 for subsequent analyses.
Low molecular weight (1–10 kDa) protein analysis by direct MALDI
One hundred microliters of HLTH and FHN samples (n = 9 each) from previous step were dried, reconstituted in the same volume of 0.1% FA, and desalted using reverse-phase (RP) C18 tips (NT1C18; Glygen) as per the manufacturer's protocol with some minor modifications. The binding and washing steps were repeated five times before final elution. One microliter of each sample was spotted on a MALDI 384 target plate and dried, and the spots were overlaid with an equal volume of sinapinic acid (10 mg/mL in 0.1% FA in 50% of ACN) and analyzed using Ultraflex II MALDI-TOF/TOF instrument (Bruker Daltonics) in positive ion linear mode. The instrument was calibrated using a 5–17.5 kDa protein standard (Bruker Daltonics), and the MALDI spectra were collected in a range between 1 and 10 kDa in a fully automated mode using Bruker Flex control software with a constant laser power and 800 laser shots per spot.
ClinProTools analysis
The MALDI-TOF mass spectra from HLTH and FHN samples were compared using ClinProTools software™ (CPT, version 2.2, Bruker Daltonics). 19 A quick classifier algorithm was used to automatically pick and integrate peaks with a signal to noise ratio ≥10, and a threshold intensity of at least 5%, relative to the largest peak. 20 Anderson-Darling test was used to establish the data distribution, and the statistical differences and significance were calculated using t- and Wilcoxon tests. Low molecular weight protein peaks with P ≤ 0.05 were considered significant.
HPLC fractionation of differentially expressed low molecular weight proteins
To purify the low molecular weight proteins, shown as differentially expressed by CPT in the previous step, equal volumes of HAPD supernatant from HLTH and FHN samples were pooled, dried, and dissolved in 0.1% FA. HPLC purification was performed using a Supelco C18 column (15 cm × 4.6 mm, 5 μm particle size, 300 å pore size; Sigma-Aldrich) attached to a Hewlett 1100 HPLC system. The HPLC was coupled online to a quadrupole ion trap Electrospray ionization (ESI) mass spectrometer (ESI-MS; Bruker Esquire 2000, Bruker) operated in a positive ion mode with a dry gas temperature of 300 °C, a flow rate of 12 mL/minute, and a nebulizing N2 pressure of 2.1 × 10⁵ Pa (30 psi). HPLC was operated at a solvent flow rate of 0.7 mL/minute using 0%-100% gradient of 0.1% FA (solvent A) and ACN (solvent B) over a 150-minute period similar to a method described earlier. 3 Multiple charged ion ESI mass spectra were used to identify the appropriate fractions of interest prior to their collection. The mass spectrometer was optimized at m/z 1000 with low skimmer voltage to avoid ion fragmentation and charge stripping. The HPLC fractions were collected and verified by MALDI-TOF-MS. Relevant fractions collected from several runs were pooled, dried, and reconstituted in 50 mM AMBIC before proceeding to the identification step.
MALDI peptide mass fingerprinting
The isolated low molecular weight proteins in 50 mM AMBIC were reduced with 10 mM dithiothreitol (DTT) for one hour at 60 °C, alkylated with 40 mM iodoacetamide (IAA) (MP Biomedicals) for one hour in the dark at room temperature. Excess IAA in the samples were neutralized with DTT, the samples were digested with trypsin (Promega) at 37 °C for 24 hours and desalted using C18 tips (NT1C18; Glygen). One microliter of the eluted peptide was mixed with an equal volume of α-cyano-4-hydroxycinnamic acid matrix (10 mg/mL in 0.1% FA in 50% of ACN), and spotted on a MALDI 384 target plate for peptide mass fingerprinting (PMF) analysis. The instrument was calibrated using Bruker peptide calibration standard spotted adjacently. Bruker Biotools 3.1 was used to combine PMF and LIFT-TOF/TOF (MS/MS) data and searched with MASCOT 2.1 search engine (Matrix Science). The peptides were identified using the following parameters: single miscleavage, fixed carbamidomethylation of cysteine, variable methionine oxidation, parent ion mass tolerance, and fragment ion mass tolerance of 0.6 Da in the NCBI Gallus gallus protein database. Peptides with fragmentation ion scores of 10 or higher were considered for protein identification.
In-solution digestion for LC-MS/MS
The protein concentration of HAPD samples were measured by BCA protein assay method (Pierce) and adjusted to a concentration of 1 μg/μL with 50 mM AMBIC, pH 7.8 (n = 3 samples/group). The samples were reduced, alkylated as described earlier, and digested with 2 μg of trypsin (Promega) for 48 hours at 37 °C.
LC-MS/MS
The trypsin-digested samples were subjected to LC-MS/MS using an Agilent 1200 series microflow HPLC coupled to a Bruker Amazon-SL quadrupole ion trap ESI mass spectrometer, capable of performing data-dependent acquisition. ESI mass spectrometer was operated in a positive ion mode with a dry gas temperature of 150 °C, with a flow rate of 7 mL/minute, and a nebulizing N2 pressure of ~105 Pa (12 psi). LC-MS/MS data were acquired in the Auto MS(n) mode with optimized trapping condition for the ions at m/z 1000. MS scans were performed in the enhanced scanning mode (8100 m/z/second), while the collision-induced dissociation or the MS/MS fragmentation scans were performed automatically for top ten precursor ions for one minute in the UltraScan mode (32,500 m/z/second). Tryptic peptides were separated by reverse-phase high-performance liquid chromatography (RP-HPLC) using a Zorbax SB C18 column, (150 × 0.3 mm, 3.5 μm particle size, 300 å pore size, Agilent Technologies), with a solvent flow rate of 6 μL/minute, and a gradient of 0%-40% consisting of 0.1% FA (solvent A) and ACN (solvent B) over a time period of 2000 minutes.
Data analysis
The mzXML files exported from Data analysis 4.0 (Bruker) were submitted to global proteome machine (GPM; http://www.thegpm.org), with the following parameters for X!Tandem 21 : Gallus gallus organism, fragment mass error of 0.6 Da, fixed carbamidomethylation, variable methionine oxidation, trypsin as enzyme, semistyle cleavage, and ion trap as the predefined method. Proteins with at least one unique peptide and upto an acceptable e-value and a false positive rate <5%, as displayed in the corresponding results page, were considered true for protein identifications. The results were downloaded as *.xml files for Skyline software and excel files for qualitative comparison.
Qualitative analysis
The common proteins present in all three biological replicates of the HLTH and FHN samples were selected using an online excel comparison program (www.xlcomparator.net). The list of proteins were mapped to their ensemble gene ID using Biomart 22 and analyzed for relative enrichment, clustering, and GO annotations using DAVID (www.david.abcc.ncifcrf.gov) 23 with a default EASE score of 0.1. The proteins unique to FHN or HLTH were considered relevant to identify biomarkers for the disease-affected group.
Label-free quantitation
The spectral files (*.mzXML) and the corresponding protein results from GPM, *.xml files, were imported into the Skyline software (http://proteome.gs.washington.edu/software/skyline), and label-free quantitation was performed using an external tool “MSstats”. 24 The software uses the signal intensities (peak areas) corresponding to the precursor ions of the peptides identified by MS/MS (MS1 filtering). 25 Group comparison function was used for the label-free quantitation and to generate the volcano plot that shows the differentially expressed proteins. The groups HLTH and FHN were analyzed in MSstats as healthy (H) and diseased (D) with three biological replicates per group, respectively. As indicated in the volcano plot, the candidate proteins are distinguished by their significant differences in the intensities (x-axis, log scale) and P-values < 0.05 (y-axis, log scale).
Statistics
Body weight (BW) and serum chemistry data were analyzed by GLM procedure using SAS software with pooled standard error of mean and significance differentiated by Duncan's multiple range tests. 26 Means were considered significant at P ≤ 0.05. The sample size for the methods is given in Table 1. The direct MALDI-TOF-MS profiles were analyzed using ClinProTools software™, whereas the LC-MS/MS data were analyzed with the Skyline software as described earlier.
Sample size (n) and statistical methods of analysis.

Results
BW and clinical chemistry
The broiler chickens in the FHN group were significantly heavier than HLTH birds (Fig. 2). The plasma CH and the LDL concentrations of FHN birds were lower than those of HLTH chickens, but the HDL and TG concentrations were similar (Table 2).

BW of HLTH and FHN-affected chickens. HLTH and FHN indicate healthy and FHN-affected birds, respectively.
Plasma lipid clinical chemistry of HLTH and FHN samples (n = 12).

Direct MALDI analysis
Of >70 peaks expressed differentially (Supplementary Table 1), a peak corresponding to m/z 3671 was isolated and identified as a fragment of α2-HS-glycoprotein (AHSG) or fetuin (Fig. 3). Similarly, another low molecular weight protein corresponding to m/z 4707 (Fig. 4) was previously identified as fibrinogen beta chain (FIBB) peptide. 27

(

ClinProTools comparison of m/z 4707 spectral peaks from HLTH (red) and FHN (green), with the average intensities shown in gray. HLTH and FHN indicate healthy and FHN-affected birds, respectively.
LC-MS/MS analysis
LC-MS/MS data and the results were deposited in the ProteomeXchange Consortium via PRIDE partner repository with the dataset identifiers PXD003292 and 10.6019/PXD003292. The number of common and unique proteins, identified in the HLTH and FHN samples, are represented in Figure 5. Briefly, the number of proteins identified in the three samples of HLTH groups were 322, 319, and 374, respectively. In FHN samples, the number of proteins identified were 380, 329, and 356, respectively. The number of common proteins in the three samples of HTLH and FHN groups were 79 and 76, respectively. Qualitative comparison of these common proteins showed only 23 proteins present in the HTLH group and 20 proteins present in the FHN group, of which only three were unique to the HLTH group and five to the FHN group (Table 3).

Venn diagram showing the number of proteins identified in each group. HLTH and FHN indicate healthy and FHN-affected birds, respectively.
Proteins present only in the HLTH and FHN samples based on the qualitative analysis of proteins present either in HLTH or in FHN samples.

Gene enrichment analysis
The GO enrichment analyses of the HLTH and FHN groups are provided in Supplementary Tables 2 and 3. A cluster enriched with fibronectin was present in the HLTH samples, while a cluster with negative regulation of apoptosis was present in the FHN samples.
Skyline quantitative proteomic analysis
A volcano plot generated using Skyline and the list of proteins differentially expressed is given in Figure 6 and Table 4, respectively. Gallinacin-9 (GAL9), two fragments of hemoglobin (HGB), and apolipoprotein A-I (APO-A1) were elevated, while the α1-acid glycoprotein (AGP), a serine peptidase inhibitor, Kazal type (SPINK7), and albumin (ALB) levels were reduced in the FHN group.

Volcano plot of differentially expressed proteins in FHN group. Red and blue indicate the increase and decrease of respective proteins. HLTH and FHN indicate healthy and FHN-affected birds, respectively. ENSGALP indicates ENSEMBL Gallus protein ID.
List of differentially expressed proteins.

Discussion
The objective of this study is to find the differences in plasma proteins of FHN-prone chickens to identify molecular markers that would distinguish the affected birds from the healthy ones. Previously, we explored biomarkers in an avian model of FHN induced by glucocorticoid, 3 whereas the current study involved spontaneously affected chickens. In the previous study, we used MALDI-TOF-MS quantitation, and a qualitative comparison of LC-MS/MS identified proteins between healthy and induced FHN. In the current study, both MALDI and LC-MS/MS methods were employed to quantify proteins. In the top–down approach, we used direct MALDI profiles of HLTH and FHN samples to find the differences in the levels of low molecular weight proteins. Based on these data, the differentially expressed proteins were purified by RP-HPLC and identified by MALDI-PMF. For the bottom-up method, the plasma proteome was subjected to trypsin digestion (LC-MS/MS), and the proteins were identified for qualitative analyses, DAVID enrichment, and label-free quantitation.
FHN is often attributed to interruption of blood supply in the developing femoral head. 28 Higher BW in chickens can be a contributing factor for the pathogenesis of FHN and the prevalence of leg problems in heavy broiler chickens.29–32 In the present study, we found elevation of both FIBB and HGB in the FHN group, which may be associated with vascular problems. FIBB is involved in blood clotting and its changes can relate to coagulation and hemostasis.33,34 Similarly, the plasma-free HGB fragments can be released due to erythrolysis and vascular damage. 35 Fetuin or AHSG has been implicated in ectopic mineralization and the change in the level of this protein may affect the skeletal strength.36,37 GO enrichment analyses showed the absence of a fibronectin type III domain, which is related to extracellular matrix integrity and adhesion.38,39 The absence of fibronectin type III domain in FHN can compromise adhesion and lead to apoptosis. 40 The presence of proteins associated with apoptosis was also evident from GO analysis. Since cell death has been implicated in both spontaneous and induced femoral head problems, 15 the changes in these proteins appear consistent with a weaker skeleton and vascular problems.
Qualitative comparison showed the presence of two peptidases, meprin-A-alpha and ubiquitin-specific peptidase 34, uniquely present in FHN. At the same time, SPINK7 was downregulated in the FHN group as shown by quantitative analyses. In human literature, SPINK prevents cancer cell migration. 41 Thus, dysregulation of proteolysis could alter skeletal homeostasis and can lead to FHN. The tudor domain containing 3 (TDRD3) present only in FHN has quantitative trait loci, associated with BW, CH abnormality, and bone density in mammals.42–44 However, its relevance to avian skeletal physiology is not known. The increased levels of antimicrobial peptide, GAL9 along with dyslipidemia, 45 and lower levels of ALB 46 can suggest microbial infection of femur.28,47 The elevated Apo-AI peptides observed in the current as well as in the previous study 3 may suggest the breakdown of lipoproteins in the FHN-affected birds.
Although several differences were observed in the plasma protein profiles, their association with FHN pathology is not understood due to limitations. First, the significance of many of these proteins is not known in relation to skeletal physiology. Second, although the changes in plasma proteins can occur due to health problems, these changes may not be sufficient to explain the underlying pathology of the proximal femur, necessitating further explorations. Another limitation of our study is that the proteomic results are based on pooled samples of nine birds selected randomly from each group.
Conclusion
The overall results of this study such as BW, clinical chemistry changes, and the proteomic changes suggest the problems associated with tissue adhesion, proteolysis, and infection as some of the underlying causes of FHN.
Author Contributions
Designed the experiment, selection of birds and analyzed the data BP, NCR, RO. Mass spectrometry analyses RL, BP, JOL. Overall interpretation of the results and wrote the manuscript BP, RL, NCR. All authors reviewed and approved of the final manuscript.
Disclaimer
Mention of a trade name, proprietary product, or specific equipment does not constitute a guarantee or warranty by the USDA and does not imply its approval to the exclusion of other products that may be suitable. USDA is an equal opportunity provider and employer.
Footnotes
Acknowledgments
We thank Scott Zornes, Sonia Tsai, and Wally Mc-Donner for assistance. Part of the study was carried out in the Statewide Mass Spectrometry Facility supported by NIH grant P30 GM103450 to the University of Arkansas.