
Abstract
Blood serum is a body fluid widely used for biomarker discovery and therefore numerous studies aim at defining its proteome. The serum proteome is subject to fluctuations resulting from biological variability (eg, diurnal variations) reflecting both healthy and/or disease-related conditions. Inter-individual differences originate partly at the genetic level and may influence clinical blood profile including the serum proteome. Therefore we investigated whether serum protein abundance is genetically determined: we report the study of a cohort of 146 Portuguese Water Dogs, a dog breed whose genetic background has been well characterized. We generated protein profiles of dog sera on 1D-gels and correlated them with microsatellite markers. We detected correlations between 7 gel bands and 11 genetic regions and developed a label-free protein quantification method to identify and quantify the proteins most accountable for serum proteome variation. An association between the abundance of RBP4 in dog serum and the adiponectin gene was detected.
Introduction
Blood serum is a body fluid with great potential for biomarker discovery for disease prevention, diagnosis and treatment. We performed a global proteomic analysis of dog serum to determine the possible heritability of serum protein markers by correlating genetic data and protein profiles. More precisely, dog serum protein profiles of genotypically different subjects were aligned and the level of correlation between quantitative trait loci (QTLs) and protein band intensities was assessed. Then, a detailed quantitative proteomic analysis was undertaken in order to finally link protein expression data to genotype.
Why studying a dog cohort? The domestic dog (Canis familiaris) was the first species domesticated by man and has been under selection for different roles in human societies for several tens of thousands of years.1,2 The Portuguese Water Dog (PWD) breed has an ancient history (first written description 1297) and was originally bred to assist fishermen. In the 1930's, the breed was re-established from a small number of founders and, thanks to accurate and complete pedigree records, the genealogy of the Portuguese Water Dogs is nowadays well described. 3 As a consequence, the population structure of the breed is favorable for detailed genetic analysis of quantitative phenotypes.4–7 The dog genome has been recently sequenced and a 74.3% sequence identity (excluding gaps) between Homo sapiens and Canis familiaris genomes has been shown. 8 In addition, these dogs are typically owned either as pets or by breeders, thus representing a free-living situation when compared to laboratory animals. Blood for DNA analysis and serum proteomics was collected from dog owners through the Georgie Project (www.georgieproject.com). The 146 dogs enrolled in our study represent a cross-section of the entire PWD population.
In our study, the dog genotypes were characterized by the analysis of microsatellites, which are polymorphic loci present in the genome and consist of repeating units of di-, tri- or tetranucleotides.9–11 They are used as molecular markers and are applied in the field of genetics, including kinship, linkage analysis for diseases and population studies. Microsatellite loci have variable repeat numbers in the population. These differently sized DNA fragments can be amplified by polymerase chain reaction (PCR) and are subsequently analyzed on large acrylamide gels or by capillary electrophoresis. In this study, a series of 745 microsatellite markers distributed across the entire dog genome were analyzed. In a second step, we analyzed the dog serum proteome. Dog sera were run on 1D gels to generate protein profiles. After gel analysis, band intensities were measured and a correlation between dog genotypes and band intensities was performed. We detected correlations between 7 gel bands and 11 genetic regions. Protein bands correlating with genotypes were selected across the gels and label-free proteomics was applied to identify and quantify the proteins responsible for serum proteome variation. Finally, genes present in the genetic regions identified as correlating with protein abundance were retrieved and mapped onto KEGG pathways for interpretation. An association between abundance of RBP4 in dog serum and the adiponectin gene was detected.
Materials and Methods
Dog Genotyping
The analysis of the microsatellite markers was performed by PCR amplification of dog DNA. 12 The PCR products were subsequently run on denaturing acrylamide gels, which were stained with SYBR® Gold (Molecular Probes). Finally, a digital picture was taken and alleles were scored visually. In this study, a series of 745 microsatellite markers distributed across the entire dog genome (Boxer genome, July 2004 assembly) were analyzed.13–15
Serum profiling on 1D gels
Sample Preparation and Gel Migration
Total protein concentration in the dog sera was assessed using the Microplate Protein Assay (BioRad) following the user's guidelines. Ten microliters of a 1/400 dilution of each sample were used for determination of protein concentration.
Three microliters of a 1/20 dilution of each dog serum were loaded on NuPAGE® Novex Bis-Tris Gels 4%–12% (Invitrogen) following the provider's instructions. Gels were migrated during 50 min in MOPS 1X. After migration, gels were stained with GelCode® Blue Stain following provider's instructions (BioRad). Digital images were taken and gels were stored at 4 °C until further use. A gel image is shown in Figure 1. In total, 16 gels were migrated in order to obtain protein profiles of the 146 dog sera.
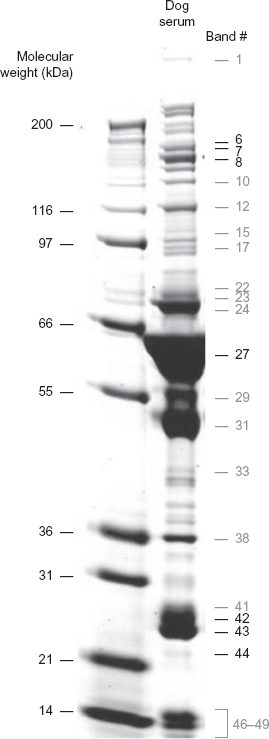
Dog blood serum protein profile on 1D gel. Left lane. Standard for molecular weight estimation. Right Lane. Typical PWD serum with indication of band number. Gel bands correlating with dog genotypes are marked in black.
Gel analysis
Gel images were imported in the TotalLab TL120 software (NonLinear Dynamics) to extract band intensities. Gel bands were identified in an automated fashion and were subsequently edited manually so that the same number of bands (ie, 49 bands) was identified for all dog sera (Fig. 1). Band intensities were retrieved and were normalized according to protein amount (in mg) and to a reference sample that was run as a standard lane on all 1D gels.
Correlation Analysis
Associations between dog genotypes (microsatellites) and phenotypes (serum protein profiles on 1D gels) were identified using the method described by Jones et al (2008) which consists in testing for correlations between microsatellite allele frequency and dog phenotypes using a Pearson product correlation. 16
Protein Identification
Sample Preparation
For protein identification and quantification, bands of interest were picked automatically by a GelPix robot (Genetix). Proteins were reduced, alkylated, in-gel digested with trypsin and extracted from gel plugs deploying an automated method on a Tecan Proteam robot (Tecan).17,18
Protein Identification by Lc-Ms/MS
The LC-MS/MS data were acquired using an LTQ OrbiTrap mass spectrometer (Thermo Scientific) coupled online to a HPLC system equipped with an analytical ReproSil-Pur C18 reversed-phase column (100 X 0.075 mm, 3 μm, ThermoFisher Scientific). The scan range was set at m/z 350–1600. For each injection, the peptide mixture was loaded and washed for 10 min with 2% (v/v) acetonitrile, 0.1% formic acid on a C18 PepMap100 trapping column (5 X 0.3 mm, 5 μm) at a flow rate of 10 μl/min, prior to elution with a linear gradient of 5%–50% (v/v) acetonitrile, 0.1% (v/v) formic acid at a flow rate of ~250–300 nl/min over 30 min. Peptides were analyzed using the OrbiTrap for full-scan MS spectrum acquisition in profile mode followed by three MS/MS scan acquisition on the three most abundant ions using the OrbiTrap in profile mode. Data were extracted using an in-house script called raw2mzXML. mzXML files were processed using the Trans-Proteomic pipeline (ISB, Seattle) to produce mgf files that were used for Mascot database searches 19 against the Canis familiaris protein database.
Label-free Protein Quantification
Sample Preparation
For each gel band, in which label-free protein quantification was performed, we selected 9 to 16 representative dog sera to analyze.
For label-free protein quantification, 15 μg protein aliquots of each dog serum were run in five replicates on 1D gels. Selected gel bands were prepared as described previously. Quantification was performed on the 3 replicates of highest quality (most reproducible LC separation).
For band #27, label-free protein quantification was performed on whole dog serum (without fractionation on 1D gel). For this, 4 μg protein aliquots of each dog serum were reduced by addition of dithiothreitol to a final concentration of 15 mM and incubation at 60 °C for 30 min. Samples were alkylated by addition of iodoacetamide to a final concentration of 25 mM and incubation at room temperature for 30 min in the dark. Digestion was performed overnight at 37 °C with 80 ng of sequencing grade modified trypsin (Promega). Digestion was stopped by adding TFA to a final concentration of 1%. Finally, 25 ng aliquots of digested sera were injected in five replicates in the LC-MS/MS instrument (OrbiTrap). The 3 replicates of highest reproducibility were used for label-free protein quantification.
Label-free Protein Quantification
LC-MS/MS data (.RAW Thermo files) were imported in the Progenesis LCMS software (NonLinear Dynamics) for protein quantification. Analysis was performed stepwise following the software's workflow. Protein identification was done via Mascot database searches against the Canis familiaris protein database.
Data analysis
Retrieval of Genes Present in the Regions of interest
Genes present in the genetic regions associated with protein abundance in serum were retrieved from the Canis lupus familiaris genome (version canFam1, July 2004) via the UCSC Genome Browser (http://genome.ucsc.edu/). Dog protein-coding and non-protein-coding genes from the NCBI RNA reference sequences collection (dog RefSeq) and genes mapped by homology to other mammals (non-dog RefSeq) were retrieved. Since our study was based on an inbred cohort of 146 dogs, the size of the genetic regions associated to protein abundance in serum was quite large (ie, 20 Mb).
Pathway Analysis
Biological interpretation of associations between genetic regions and protein abundance in serum was performed with KEGG Pathways by searching against the Canis familiaris database. In addition, the association between the gel band 44 and the region around marker MKR2601 was analyzed through the use of Ingenuity Pathway Analysis (IPA®, Ingenuity® Systems, www.ingenuity.com).
Results
Correlation between Protein Profiles on 1D Gels and Genetic Markers
Blood serum protein profiles on 1D gels were obtained for the 146 dogs enrolled in the study and 49 gel bands were reproducibly identified for each serum. Corresponding band intensities were retrieved and an association analysis between band intensities and 745 microsatellite markers distributed across the dog genome was performed. This yielded correlations between 7 protein gel bands and 11 dog microsatellite markers (P ≤ 0.05). Gel bands correlating with dog genotypes are highlighted in Figure 1. The associations were not dependent on the gender or on the age of the dogs. Dog genotypes are shown in Supplementary Table 1.
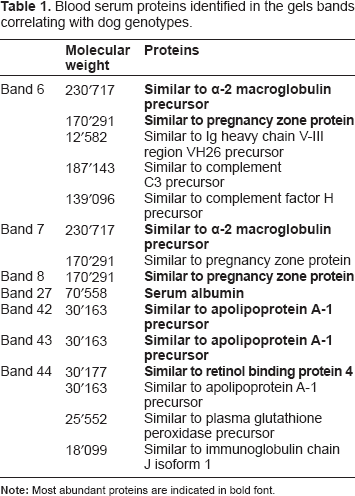
Blood serum proteins identified in the gels bands correlating with dog genotypes.
Protein Identification and Quantification
LC-MS/MS-based protein identification was performed on the 7 gel bands correlating with dog genotypes (Table 1). Protein abundance was only measured in a subset of these bands (bands 6, 27, 43 and 44) because protein quantification could not be performed in bands 7, 8 and 42 since they were poorly resolved from the neighboring bands.
Protein gel bands 7, 8 and 42
Two proteins were identified in band 7: alpha-2 macroglobulin (α2M) and pregnancy zone protein (PZP); one protein was identified in band 8 (pregnancy zone protein (PZP)) and one protein was identified in band 42 (apolipoprotein A-I (APO-AI)). However, these identifications have to be considered with caution since the gel bands were difficult to resolve from neighboring bands. For this reason we did not perform a pathway analysis in order to avoid any false interpretation.
Protein Gel Band 6
Sixteen dog sera were selected for label-free protein quantification in band 6. Band intensities on 1D gels and label-free quantification results are shown in Figures 2 and 3. Five proteins were identified and quantified, among which alpha-2-macroglobulin (α2M) showed the highest peptide ion intensities and was considered as the major protein of band 6. After label-free quantification, we observed that the trend observed for intensity of band 6 on 1D gels was not reproduced for α2M. Indeed, several other proteins with variable intensities were present in this band and may have influenced band intensity, thereby inducing a bias in LC-MS/MS. This is especially the case for pregnancy-zone protein and Ig heavy chain V-III region VH26 precursor, which both show medium intensities. Complement C3 precursor and complement factor H precursor were minor proteins.
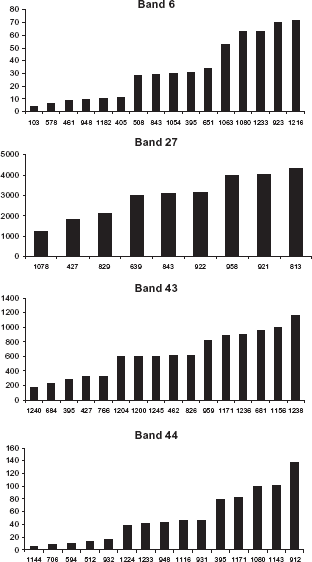
Band intensities on 1D gels for a selection of dog blood sera. Dog ID is indicated on the X axis and band intensity on the Y axis.
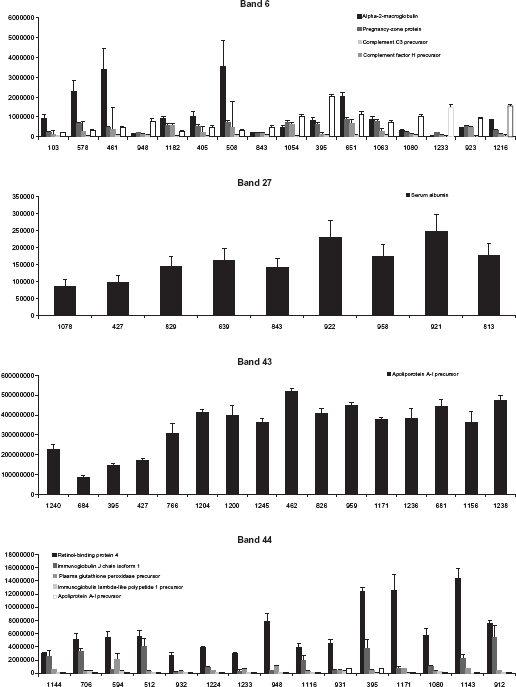
Protein abundance measured by label-free quantification for a selection of dog sera. Dog ID is indicated on the X axis and protein relative abundance on the Y axis.
Protein gel Band 43
Sixteen dog sera were selected for label-free protein quantification in band 43. Band intensities on 1D gels and label-free quantification results are shown in Figures 2 and 3. Among the 10 proteins identified in band 43, one protein, apolipoprotein A-I precursor (APO-AI), was quantified. Indeed, the 9 other proteins were considered as non significant since only one peptide was identified for each protein. APO-AI was hence considered as the major protein of band 43 and therefore as the protein determining the intensity of this band. Samples, for which band intensity was “medium” or “high” on 1D gel, showed similar intensities for APO-AI after label-free protein quantification.
Protein gel band 44
Fifteen dog sera were selected for label-free protein quantification in band 44. Band intensities on 1D gels and label-free quantification results are shown in Figures 2 and 3. Five proteins were identified and quantified using Progenesis LCMS. Among them, retinol binding protein 4 (RBP4) showed by far the highest peptide ion intensities, was hence considered as the major protein of band 44 and therefore as the protein mostly determining the intensity of this band. RBP4 peptide ion intensities for “low” and “medium” samples were quite similar. The four other proteins, Apolipoprotein A-I precursor, plasma glutathione peroxidase precursor, immunoglobulin chain J isoform 1 and immunoglobulin lambda-like polypeptide 1 precursor showed much lower peptide ion intensities as compared to RBP4 and were therefore considered as minor proteins with little influence on total band intensity on 1D gels.
Protein Gel Band 27
Nine dog sera were selected for label-free protein quantification in gel band 27. Band intensities on 1D gels and label-free quantification results are shown in Figures 2 and 3. In contrast to bands 6, 43, and 44, label-free quantification of band 27 was not performed on gel samples, because this band contained serum albumin, which constitutes 50% of total serum proteins. Therefore, label-free protein quantification was performed directly on whole serum (without gel fractionation). Forty-five proteins were identified in this crude whole serum analysis and we focused on serum albumin. The trend observed at gel level was similar to the trend observed after label-free protein quantification. For dog sera presenting the gel band 27 with a high intensity, a plateau was observed after label-free quantification.
Biological Interpretation: is protein Abundance Genetically Determined?
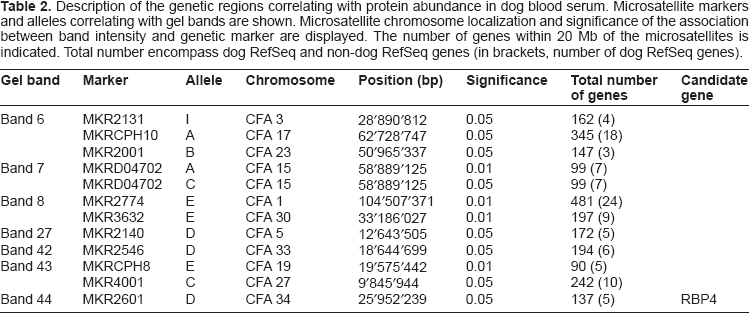
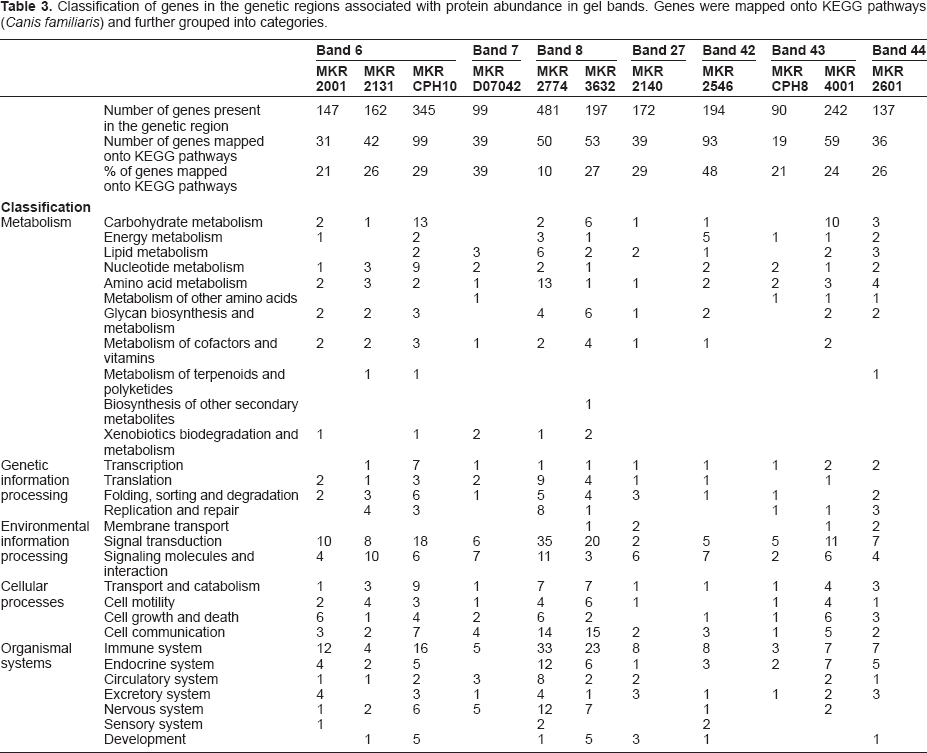
The genes present in 20 Mb regions around the 11 genetic markers linked to protein abundance were retrieved from the Canis familiaris genome. Table 2 presents some characteristics of these genetic loci. The complete lists of genes can be found in Supplementary Table 2. Subsequently, the genes were mapped onto KEGG pathways in order to highlight those that may contribute to variation of protein abundance in dog serum. Table 3 shows the number of genes that fall into each KEGG category. We observed that only a small proportion of genes retrieved in the regions of interest (28% on average) could be mapped onto KEGG pathways. Several genes were related to the immune system, signal transduction, cell communication or metabolism. However, we did not identify any obvious functional gene-protein correlation, except for band 44 and the genetic region around marker MKR2601.
Description of the genetic regions correlating with protein abundance in dog blood serum. Microsatellite markers and alleles correlating with gel bands are shown. Microsatellite chromosome localization and significance of the association between band intensity and genetic marker are displayed. The number of genes within 20 Mb of the microsatellites is indicated. Total number encompass dog RefSeq and non-dog RefSeq genes (in brackets, number of dog RefSeq genes).
Classification of genes in the genetic regions associated with protein abundance in gel bands. Genes were mapped onto KEGG pathways (Canis familiaris) and further grouped into categories.
As shown by proteomic analysis of band 44, the RBP4 protein is the major contributor to intensity of this band. RBP4 belongs to the lipocalin family and is the specific carrier for retinol (vitamin A alcohol) in the blood. 20 It delivers retinol from the liver stores to the peripheral tissues. In plasma, the RBP-retinol complex interacts with transthyretin, which prevents its loss by filtration through the kidney glomeruli. A deficiency of vitamin A blocks secretion of the binding protein post-translationally and results in defective delivery and supply to the epidermal cells.
Recently, RBP4 has been described as an adipokine that contributes to insulin resistance in a mouse model. It is secreted by adipocytes, and can act as a signal to other cells, when there is a decrease in plasma glucose concentration.21,22 Furthermore, a regulatory single nucleotide polymorphism (SNP) in the RBP4 gene has been recently shown to be associated with type 2 diabetes in a Mongolian population. 23 Similarly, a relationship between insulin and RBP4 levels was shown in obese children and adolescents, indicating that RBP4 might contribute to the development of muscle insulin resistance. 24
The adipokine function of RBP4 is of high interest to the present protein-gene correlation study because there is an adipokine gene, namely adiponectin (ADIPOQ), in the genetic region linked to the serum levels of RBP4. Therefore, our results suggest a link between the amount of RBP4 in dog serum and a sequence variation in the adiponectin gene.
Subsequently, gene networks were generated using Ingenuity Pathway Analysis: the RBP4 protein and genes present within a 20 Mb region around marker associated with intensity of band 44. Gene products were attributed to different cell compartments and the major biological pathways and functions related to RBP4 are indicated in Figure 4. In particular, the involvement of RBP4 and Adiponectin (ADIPOQ) in type II diabetes and insulin resistance is highlighted.
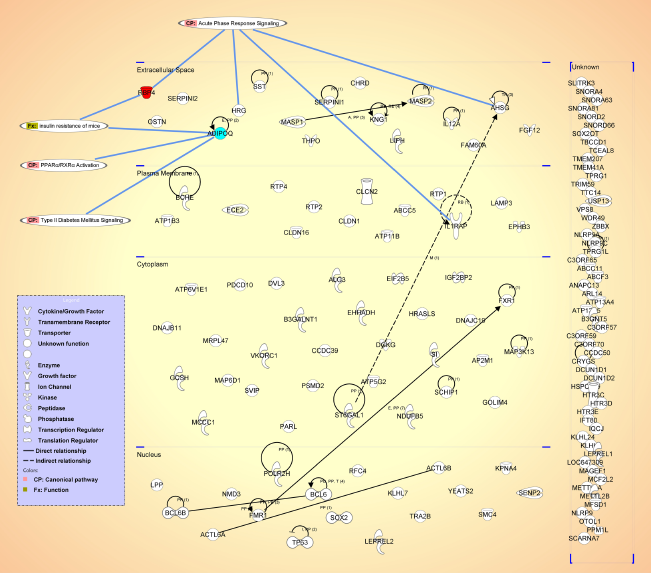
Gene network generated using Ingenuity Pathway Analysis (IPA®, www.ingenuity.com). genes present within a 20 Mb region around marker MKR2601 are mapped onto the different cell compartments where the corresponding proteins are expressed. The RBP4 protein is highlighted in red. Direct and indirect relationships are indicated by black lines. Biological pathways and functions related to RBP4 are highlighted.
Discussion
Label-free Protein Quantification
The methodological objective of this work was to implement label-free quantification of proteins in our laboratory. This technique is especially useful for proteomic studies in which labeling (either in vivo or in vitro) of proteins or peptides is not possible, which is actually the case for many clinical studies. We developed and applied our method to the quantification of proteins in gel bands (low proteome complexity) and in whole dog serum (high proteome complexity).
For band 44, the binning of dog groups into “low”, “medium” and “high” intensity observed at gel level could not be exactly reproduced after label-free protein quantification: the “low” and “medium” samples showed similar intensities for RBP4. A similar phenomenon was observed for band 43, which is mainly constituted of APO-AI: the “medium” and “high” samples could not be distinguished after label-free protein quantification since they showed similar intensities for APO-AI.
For band 6, there was a significant bias induced by the presence of other proteins with intensities in the same order of magnitude. We conclude that in cases where quantification is performed on samples with very subtle differences, the sensitivity of label-free quantification may not be sufficient to separate the different groups into bins of “low”, “medium” and “high” band intensity.
For band 27 (serum albumin), LC-MS/MS-based label-free quantification was performed directly in whole serum since the major component of serum is serum albumin (50% of total protein content). In this case, the trend observed after label-free quantification was similar to the trend seen on 1D gels with a plateau for samples with “high” band intensity.
Genetic Determination of Protein Abundance in Serum
The concept of this project was to better define healthy metabolism by combining measurement of protein abundance in serum with characterization of genetic variation (microsatellite markers) in purebred dogs (PWD). The study was performed on a small dog cohort (146 PWDs) and, in consequence, the genetic regions associated with variation of protein abundance in serum are quite large (ie, 20 Mb). Association studies with larger cohorts (at least 1,000 subjects) would increase statistical significance and decrease the size of associated regions. More recently, dog genotypes are being determined by the analysis of SNPs. 16 SNP-based association studies are more informative than microsatellites-based association studies, since the phenotype is linked to a particular nucleotide variation and not to a genetic region encompassing thousands or millions of nucleotides.
We aimed at identifying dog serum proteins, the abundance of which is genetically determined and, possibly, functionally linked to a variation in a specific gene locus. In this view, the analysis of the association between protein abundance in band 44 and genotype in the region around marker MKR2601 was the most interesting case. Indeed, RBP4 and adiponectin are both involved in insulin resistance, which suggests not only a quantitative but also a functional association. This result should be confirmed by other means. In parallel to our proteomics assay, abundance of RBP4 was measured in blood using the classical clinical procedure (eg, ELISA). The outcome of this test was in discrepancy with the proteomics data, since no correlation with dog genotypes could be established (data not shown). However this does not invalidate the association between abundance of RBP4 measured by proteomics and the adiponectin gene: subtle but statistically significant differences measured by proteomics may not necessarily be confirmed by a clinical test involving several enzymatic steps. Ideally, the association between RBP-4 and adiponectin should be further validated by testing an additional dog cohort.
The interpretation of the other protein-gene correlations was more challenging, since we could not identify direct gene-protein interactions but associations between protein abundance and several genes located in the genetic region around the correlating microsatellites. A difficulty of data interpretation lies in the fact that the dog genome is still poorly annotated, there are very few dog RefSeq genes compared to the large number of genes mapped by homology to other mammalian species (non-dog RefSeq, such as Homo sapiens, Mus musculus or Rattus norvegicus). In addition, the function of many dog genes is still unknown, and therefore, some functional gene-protein associations may have been missed.
Conclusions
Label-free quantification of proteins is a quick and efficient way of comparing protein abundance in different subjects and conditions, especially when biochemical or metabolic labeling to introduce tracers is not an option, as it is the case for many clinical studies. We successfully developed and implemented label-free protein quantification on mixtures of standard proteins and applied this technique to serum samples from healthy dogs. Measuring protein abundance in serum of healthy subjects is a real challenge since the differences between such samples are usually subtle, at least lower than in the case of a comparison between a healthy and a diseased condition. Nevertheless, the label-free quantification method allowed monitoring changes in abundance of major proteins.
The biological interest of the present project was to identify correlations between protein abundance in serum and genotypes of dogs. The correlation showed association between 7 gel bands and 11 microsatellite markers. As an example of our preliminary findings of microsatellite-protein abundance correlation, the RBP4 protein band intensity appeared to correlate with variation in an adiponectin-containing gene locus. This biologically meaningful finding requires follow-up and validation in other dog cohorts and, possibly, with other analytical means.
Disclosures
This manuscript has been read and approved by all authors. This paper is unique and not under consideration by any other publication and has not been published elsewhere. The authors and peer reviewers report no conflicts of interest. The authors confirm that they have permission to reproduce any copyrighted material.
Footnotes
Acknowledgements
We would like to thank Michael Affolter and Begoña Casado for scientific advice and Véronique Parisod for technical work during the optimization phase of the project. We are grateful to James Holzwarth for critical reading of the manuscript. We would like to thank Kevin Chase for correlation analysis between band intensities on 1D gels and dog genotypes.