
Abstract
Release of individuals is an effective conservation approach to protect endangered species. To save this small isolated giant panda population in Liziping Nature Reserve, a few giant pandas have been released to this population. Here we assess genetic diversity and future changes in the population using noninvasive genetic sampling after releasing giant pandas. In this study, a total of 28 giant pandas (including 4 released individuals) were identified in the Liziping, China. Compared with other giant panda populations, this population has medium-level genetic diversity; however, a Bayesian-coalescent method clearly detected, quantified, and dated a recent decrease in population size. The predictions for genetic diversity and survival of the population in the next 100 years indicate that this population has a high risk of extinction. We show that released giant pandas can preserve genetic diversity and improve the probability of survival in this small isolated giant panda population. To promote the recovery of this population, we suggest that panda release should be continued and this population will need to release 10 males and 20 females in the future.
Keywords
Introduction
The giant panda (Ailuropoda melanoleuca) is a rare and endangered wild animal in China. It is a flagship species for biodiversity conservation and known as a “national treasure” and “living fossil” to the Chinese people. 1 However, due to its feeding and reproductive characteristics, habitat fragmentation, and human activities, 2 giant pandas are currently only distributed in 6 isolated mountains, namely: Qinling, Mingshan, Qionglai, Liangshan, Daxiangling, and Xiaoxiangling. 3 The Liziping Nature Reserve is located in the Xiaoxiangling Mountains and is one of the most problematic areas for fragmentation of giant panda habitats. 4 Due to the course of China National Highway 108, among other reasons, 5 the giant pandas in the Xiaoxiangling Mountains are divided into 2 isolated populations (Figure 1A).

Study area of the Liziping National Nature Reserve in the Xiaoxiangling Mountains (A) and identified individuals of giant pandas in the study area (B). (A) Inset shows the major distribution region of giant pandas in Sicuan. (B) 28 individuals including 4 released giant pandas are represented by triangles of different colors on the Digital Elevation Model (DEM) map of Liziping. Centers for feces are found in multiple locations on the DEM map.
Studies have shown that populations with loss of genetic diversity and inbreeding can lead to sharp declines in adaptability, reproductive capacity, and disease resistance, thus heightening the risk of extinction. 6 Sufficient genetic diversity is a necessary condition for the species to adapt to the environment. The higher the level of genetic diversity of a species, the higher the probability of survival in response to environmental changes. When the genetic diversity of a species is low, fewer alleles are retained, especially rare alleles. The species are then less able to adapt to changes in the environment, resulting in a decrease in survival rate and an uncertain future. Therefore, the core issue in species conservation is to protect genetic diversity. Only by understanding the genetic diversity of the population in which a species is located can we develop effective conservation strategies and measures.
Release of individuals is an effective strategy for saving endangered species from extinction.7,8 Many endangered species have benefited from releases for conservation purposes, for example, the Mexican wolves (Canis lupus baileyi), black bears (Ursus americanus), and black-footed ferret (Mustela nigripes).9-11 Population genetic studies in the Liziping Nature Reserve revealed that this small isolated giant panda population was at a high risk of extinction if it remained isolated with low levels of gene flow.12-14 To protect and save this giant panda population, 9 giant pandas were released into this population from 2009 to 2017. The released animals include 8 captive-bred giant pandas that underwent 2 years of prerelease training and one wild-caught giant panda rescued from the Qionglai Mountains. Three of them are male and 6 are female. Our previous research about the released giant pandas of Xiaoxiangling Mountains showed that released giant pandas had established a stable home and survive well in the Xiaoxiangling Mountains. Furthermore, the female giant panda caught from the wild named “Lu Xin” gave birth to a cub. 15 However, to date, we have not elucidated the genetic diversity in this isolated small population after the addition of the released giant pandas.
Molecular markers continue to be a hotspot in the study of genetics. Among various molecular markers, microsatellites have good specific amplification, stability, and reproducibility, and they can reflect the genetic structure and diversity of a population. 16 Microsatellite markers are now widely used in genetic studies in various animals, especially mammals, 17 and they have been widely used in the research on giant pandas, including paternity testing, individual identification, population surveys, and genetic diversity assessments. 18 In this study, 10 microsatellite loci were selected to analyze the genetic diversity and future trends of the giant panda population in Liziping. We also focused on the demographic history of this small isolated population. Our findings will help to provide a scientific basis for the protection and management of this region’s panda population.
Material and Methods
Sample collection and analysis of fecal DNA
Giant panda fecal samples were collected from sites across the Liziping Nature Reserve study region. We laid a total of 136 transect lines, the density of which was 1 line every 4 km2 of study area. Most samples were less than 3 days old determined from the status of the mucosal outer layer. We collected 120 samples from January 2018 to May 2019. DNA was extracted from feces as previously described 19 using a QIAamp DNA Stool Mini Kit (Qiagen). Blank controls were also performed in both extractions with downstream amplification. Ten microsatellite loci: Ame-μ010, Ame-μ026, Ame-μ013, Ame-μ011, Ame-μ015, 20 Panda-22, GPL-47, GPL-60, gpz-47, and gpz-6 21 were used to genotype fecal DNA extracts and a stringent multitube approach was used. 22 Polymerase chain reaction (PCR) products were separated using an ABI 3700 prism automated sequencer and scored using GeneMarker 2.2 (Softgenetics, Pennsylvania, State College, PA, USA). The pair of primers ZX and ZF 23 of the SRY gene was used for giant panda sex identification.
Individual identification
Individual identification was performed as previously described 19 . All of the microsatellite data were employed in comparative analysis using the GIMLET 1.3.1 program 24 and all samples from the same site or with only one locus or one allele (except special alleles) that were different were judged to be from the same individual. 25 To test the discriminatory power of the 10 loci in combination, P(ID) and P(sibs) were estimated using GIMLET 1.3.1.
Genetic diversity
Hardy-Weinberg equilibria and linkage disequilibria for microsatellite loci were evaluated using GENEPOP (version 3.4), 26 and the estimates of inbreeding coefficients (Fis) were also obtained via GENEPOP (version 3.4). Genetic diversity was summarized as described 27 in through the number of alleles (Na), observed heterozygosity (Ho), expected heterozygosity (He), and polymorphism information content (PIC), all estimated using Cervus version 3.0.28,29 To assess the level of genetic diversity of the Liziping population, we compared the genetic diversity with other giant panda populations.
Simulation of population demography
To explore possible bottlenecks of the Liziping population. We used the heterozygosity excess test to detect bottleneck signal under 3 models based on the microsatellite data, the infinite alleles model (IAM), the stepwise mutation model (SMM), and the 2-phase mutation model (TPM). Under the TPM model, the proportion of 1-step mutations was set as 90% or 95%, and the variance was set as 12. The Wilcoxon signed-rank test was used to analyze the model results. 30 A mode-shift test was carried out to detect distortion of the expected L-shaped distribution of allele frequency. 31 A relatively stable population is distributed in an “L” shape, and a population experiencing a bottleneck deviates from the “L” shape. Both heterozygosity excess and modal shift tests were carried out using BOTTLENECK 1.2.2. 32
To infer population demographic changes, an alternative maximum-likelihood Bayesian method was developed,33,34 the coalescence-based Markov Chain Monte Carlo (MCMC) approach implemented by MSVAR 1.3 was used, which is based on the observed distribution of microsatellite alleles and allele frequencies.35,36 Markov Chain Monte Carlo was used to estimate the posterior probability distribution of demographic parameters under an SMM with the rate θ = 2N0μ. We assumed that the population of ancestral size (N1) started to decrease (or increase) to the current population size (N0) at the time (T). The analyses were performed using linear or exponential model. The prior distributions for N0, N1, T, and θ, are assumed to be log normal. The means and standard deviations (SDs) of these log-normal distributions were themselves drawn from prior (or hyperprior) distributions. Variances for these prior distributions were large, so they would affect them as little as possible, and 3 independent runs were carried out by MCMC (Supplemental Table S1). To represent possible demographic histories (stable, decreasing, or increasing), different hyperprior means for the mean of ancestral population size (N1) were used. The number of iterations was 1 × 10⁹, and burn-in was 1 × 10⁴. A 6-year generation time of the giant panda was set. 37
Population viability analysis and predictive analysis for genetic diversity
To protect this small isolated population, population viability analysis (PVA) was used to evaluate the impact of number and sex of releases on population viability under different return strategies. PVA was run in VORTEX10. 38 We set all parameters as previously described following Wei et al 39 and Yang et al. 15 Initial population size was set to 24, excluding the released giant pandas, according to the individual identification in this study. Our previous research had shown the carrying capacity for giant panda in Liziping Reserve is 163. 15 The only considered catastrophe is the die-off of bamboo and frequency was 1.67% as previous research. 15 The survival probability and future genetic diversity of this population were predicted and analyzed more than 100 years and the aforementioned parameters were simulated 1000 times, the settings of these parameters for VORTEX10 were listed in Supplemental Table S2. The main released panda simulations were as follows: (1) release 1 to 5 males every 10 years; (2) release 1 to 5 females every 10 years; and (3) release 2 males and 2 females, 1 male and 3 females, 1 male and 4 females, 2 males and 3 females, 3 males and 2 females, and 1 male and 4 females, respectively, every 10 years. A total of 22 combinations were tested (Supplemental Table S3).
To investigate whether the population size and sex would have an impact on the future genetic diversity of the giant panda population in the reserve, the program BottleSim, version 2.6, was used for prediction based on microsatellite data. The software is suitable for species with overlapping generations. It can be set according to the breeding mode, population number, and male-female ratio of the species to predict genetic diversity of the population in the future. 40 The parameters were set to an average lifespan of 25 years; the reproductive age was 6 years, 37 and the male-female ratios were set to 1:1, 1:2, and 1:3.
Results
Individual identification
Of the 120 samples, 90 samples (75%) were successfully amplified and 28 unique genotypes were identified (https://dx.doi.org/10.6084/m9.figshare.11912493.v1), including the 4 released giant pandas, namely “Tao Tao,” “Zhang Xiang,” “Ba Xi,” and “Zhang Meng” (Figure 1B). “Tao Tao” and “Ba Xi” were male, “Zhang Xiang” and “Zhang Meng” were female, and all were captive giant pandas whose parents came from the Qionglai Mountains. “Tao Tao,” “Zhang Xiang,” “Zhang Meng,” and “Ba Xi” were released into the Liziping on October 11, 2012, November 6, 2013, October 21, 2016, and November 23, 2017, respectively, after 2 years of prerelease training. When they were 2 years and 2 months old, all of the 4 giant pandas were released. The probabilities of identity for 10 microsatellite loci P(ID) and P(sibs) are shown in Table 1. Ten females and 4 males were identified among 28 individuals; however, the remaining samples were not sex-identified due to insufficient sample material.
Probabilities of identity for 10 microsatellite loci.

Abbreviations: P(ID), probability of identity; P(sibs), probability of fill-sibs.
Genetic diversity after release of the giant pandas and comparison with the population excluding the released giant pandas
A total of 44 alleles were obtained from the fecal samples in this study. The number of alleles at each microsatellite locus ranged from 2 to 8 and the mean number of alleles was 4.9. The Hardy-Weinberg equilibrium test indicated that 5 loci (Ame-μ013, Ame-μ011, Panda-22, gpz-47, and gpz-6) significantly deviated from equilibrium. The linkage disequilibrium test indicated that 3 loci (Ame-μ013, Ame-μ011, and gpz-6) significantly deviated from equilibrium. The polymorphic information (PIC) of each microsatellite locus was between 0.514 and 0.805, except for GPL-47 which was greater than 0.5, showing highly polymorphic and informative loci. GPL-47 (0.375) ranged from 0.25 to 0.5 and exhibited moderate polymorphism, providing reasonable genetic information. The mean PIC of 10 microsatellite loci was 0.622, indicating that the giant panda population of Liziping is a group with rich genetic diversity. The He and Ho values of each microsatellite locus were from 0.509 to 0.827 and 0.25 to 0.808, respectively, with mean values of 0.692 and 0.468, respectively. The results indicated that Ho was significantly lower than He, suggesting that there were more homozygotes in the population. The population inbreeding coefficient (Fis) was 0.286, indicating that there was a certain degree of inbreeding in the population. The genetic diversity data are shown in Table 2.
Genetic characteristics of 10 microsatellite loci.
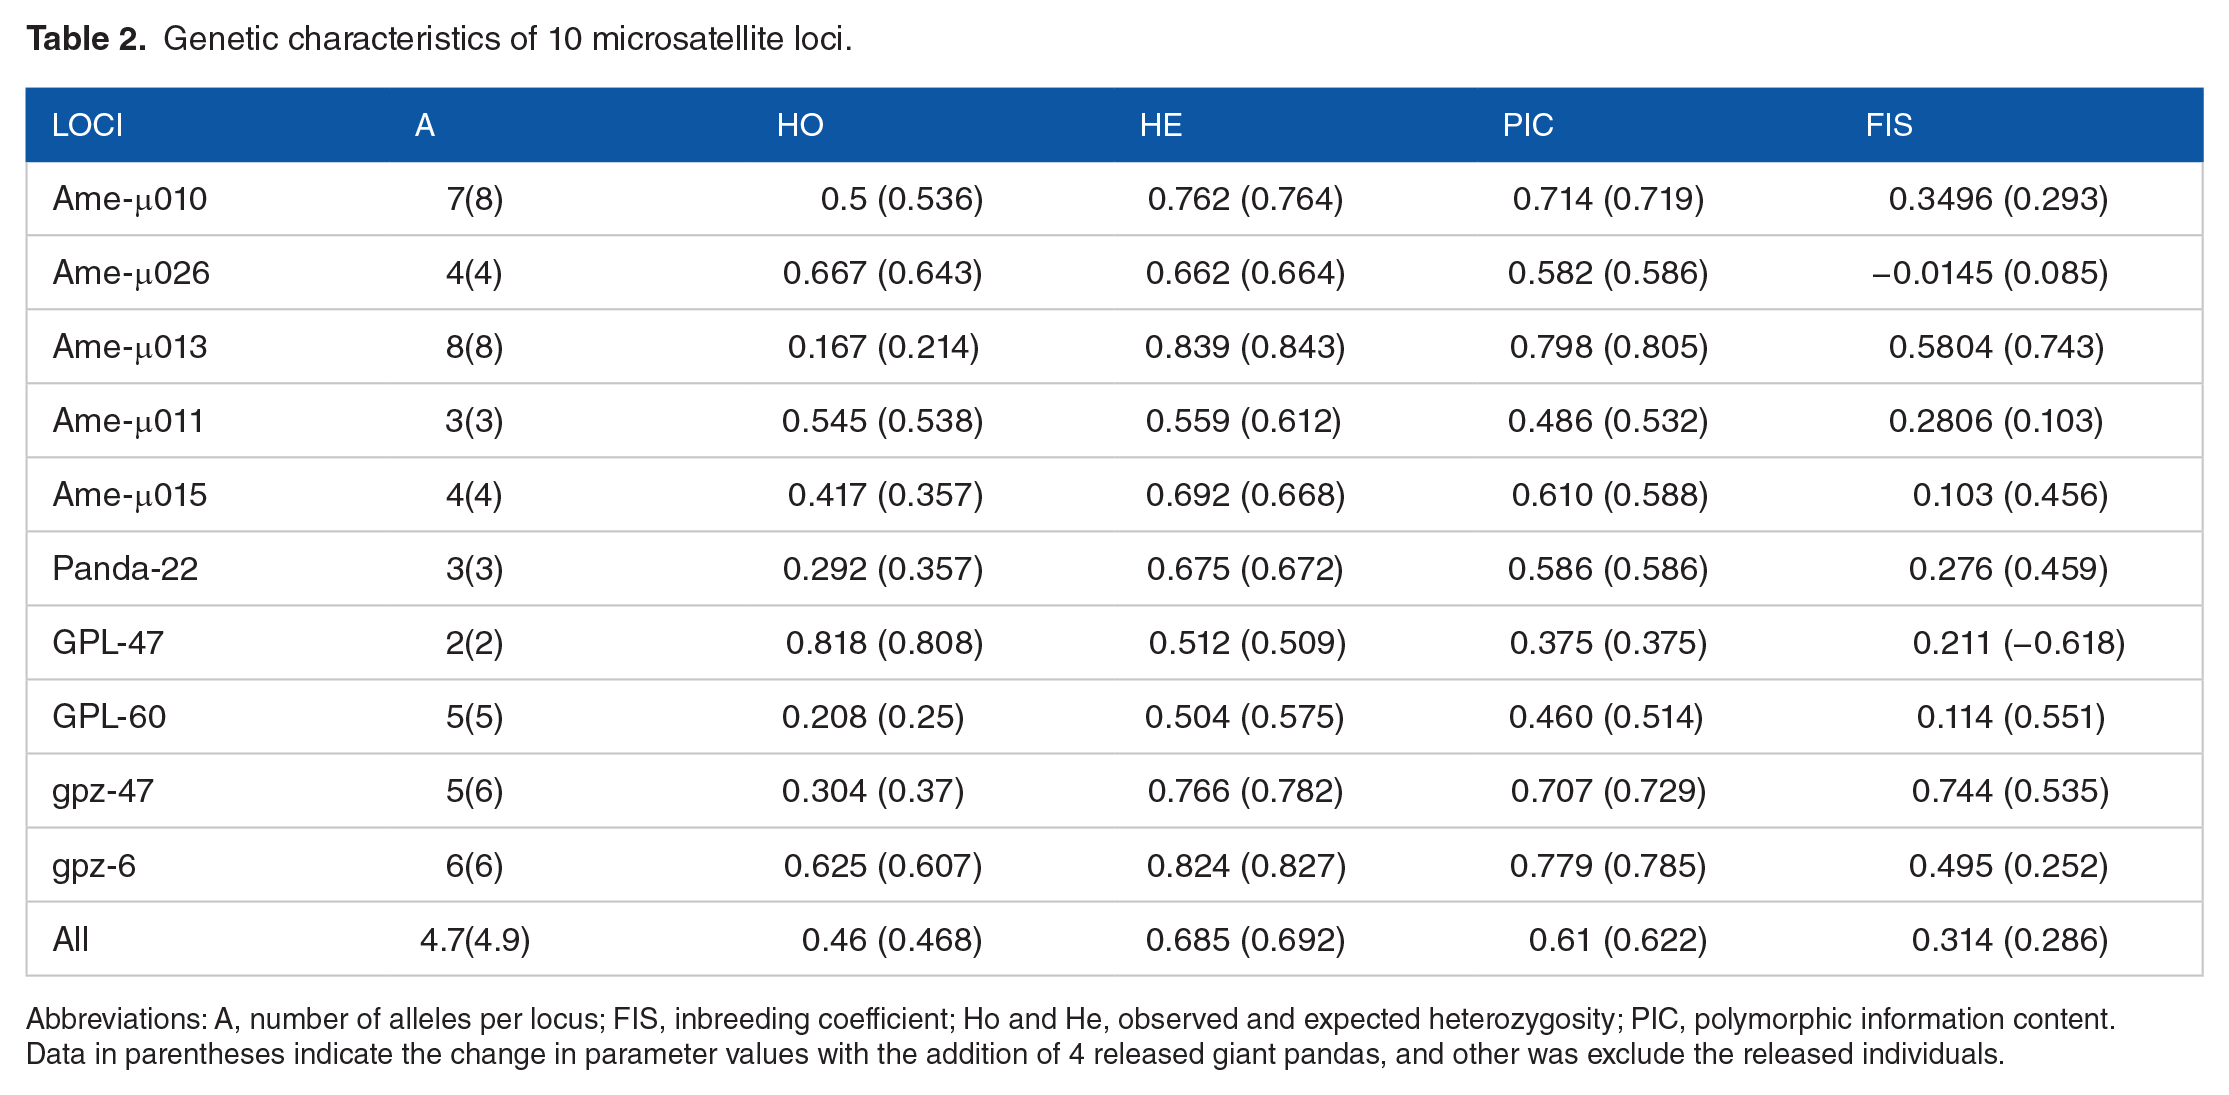
Abbreviations: A, number of alleles per locus; FIS, inbreeding coefficient; Ho and He, observed and expected heterozygosity; PIC, polymorphic information content.
Data in parentheses indicate the change in parameter values with the addition of 4 released giant pandas, and other was exclude the released individuals.
To study the effects of released giant pandas on the genetic diversity of this population, genetic diversity of the population with and without the 4 released individuals was compared. Following the release of the 4 pandas, microsatellite date indicated that 2 “novel” alleles from 2 loci (Ame-μ010 and gpz-47) were introduced into this population, thus demonstrating that these 4 released giant pandas brought new genetic material in this population, yet there were no significant changes in genetic diversity of the population. However, when our data were compared with the genetic diversity (Ho = 0.557, He = 0.581) in the Liziping Reserve studied previously by Cheng et al, 41 there may be a slight increase. We inferred that this was because, after 2013, a few giant pandas were successfully released into this Liziping population, but evidence to support this hypothesis was lacking. The data are shown in Table 2.
Comparison of genetic diversity with other giant panda populations
We collected genetic diversity information for 5 other giant panda populations to assess the level of genetic diversity of the Liziping population. Genetic diversity of the Liziping population, compared with other giant panda populations from Qionglai, Wanglang, Baoxing, Qinling, Liangshan, and Minshan (Table 3), suggested that the Liziping population has medium-level genetic diversity. The genetic diversity data for other giant panda populations were shown in Table 3.
Genetic diversity of different giant panda populations.
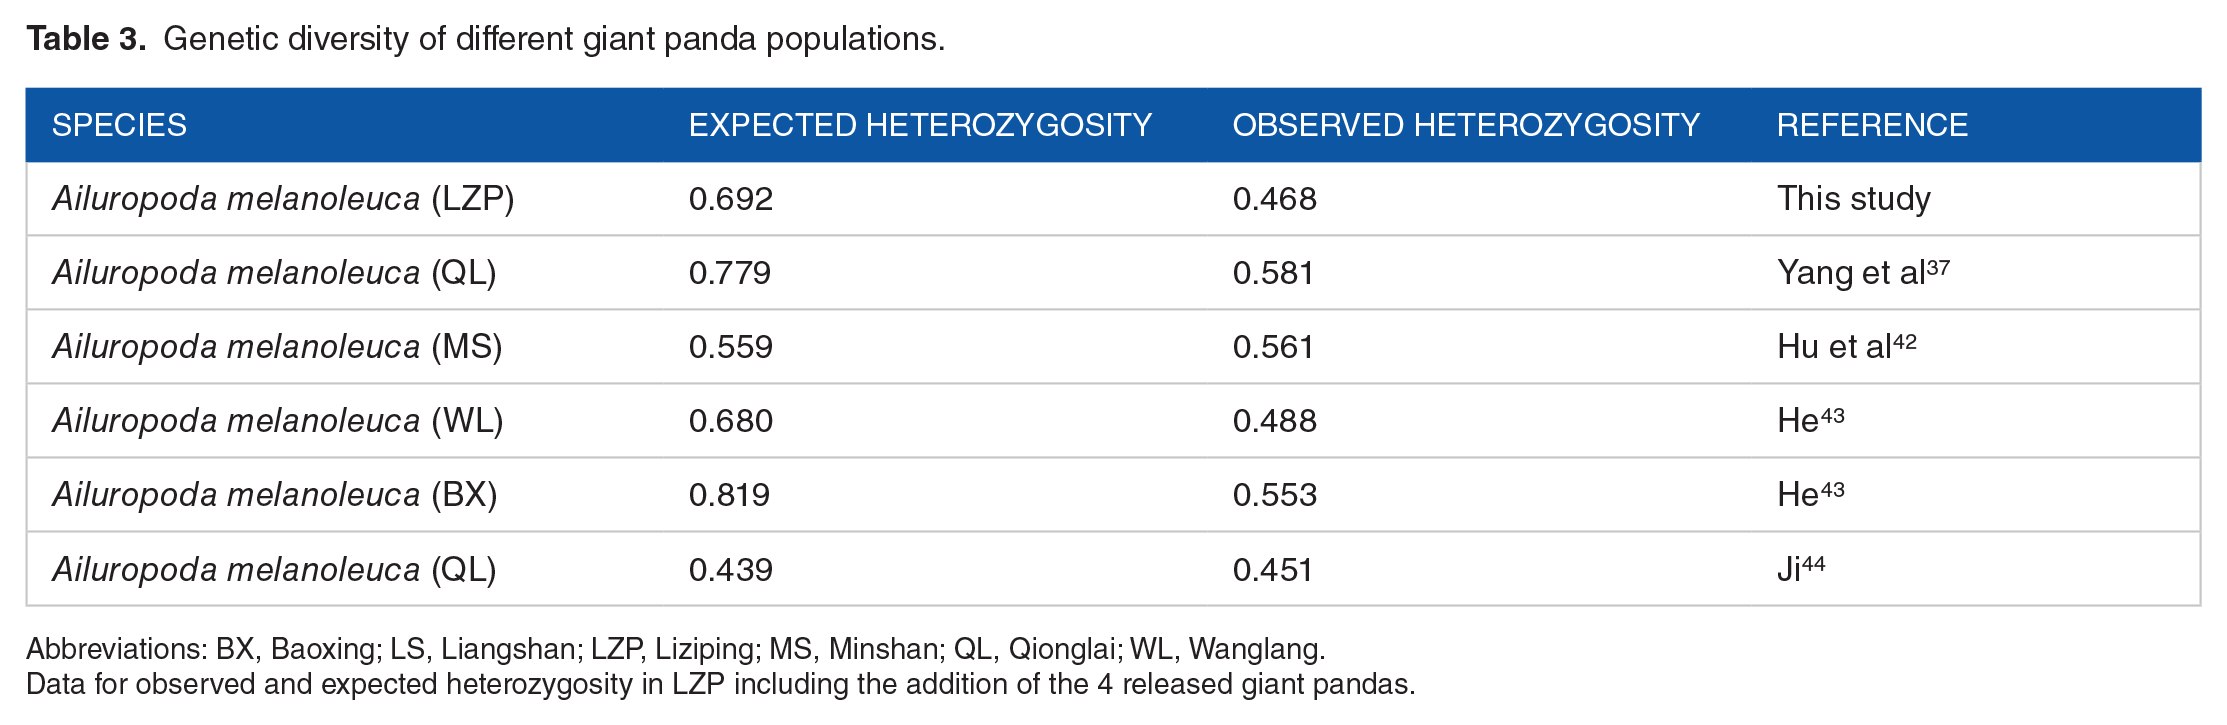
Abbreviations: BX, Baoxing; LS, Liangshan; LZP, Liziping; MS, Minshan; QL, Qionglai; WL, Wanglang.
Data for observed and expected heterozygosity in LZP including the addition of the 4 released giant pandas.
Population demography analysis
The bottleneck test showed that regardless of the mutation model assumed, this population exhibited no significant signal of a population bottleneck under either TPM or SMM (Supplemental Table S4). However, a significant bottleneck signal occurred under the IAM model, which is thought to be a less-appropriate model for microsatellites than the SMM. 45 Hence, we considered the detection result based on the IAM as invalid. The mode-shift test demonstrated a normal L-shape distribution of microsatellite allele frequencies in this population. The result suggests that the population has not experienced a bottleneck, and the population is relatively stable.
However, results based on MSVAR 1.3 simulations revealed that a recent population decline in this isolated population from 426 years (median value) before present (Figure 2B; Table 4). Multiple runs produced the same results regardless of the demographic models. Different prior distributions (stable, decreased, or increased population size) had very little effect on the posterior distributions of population demographic parameters. As the exponential model was better than the linear model for modeling recent population declines, 33 here we only report results from the exponential model. And results showed that the giant panda population had decreased by approximately 238-fold (median value) approximately 426 (median value) years ago before present (Table 4; Figure 2).
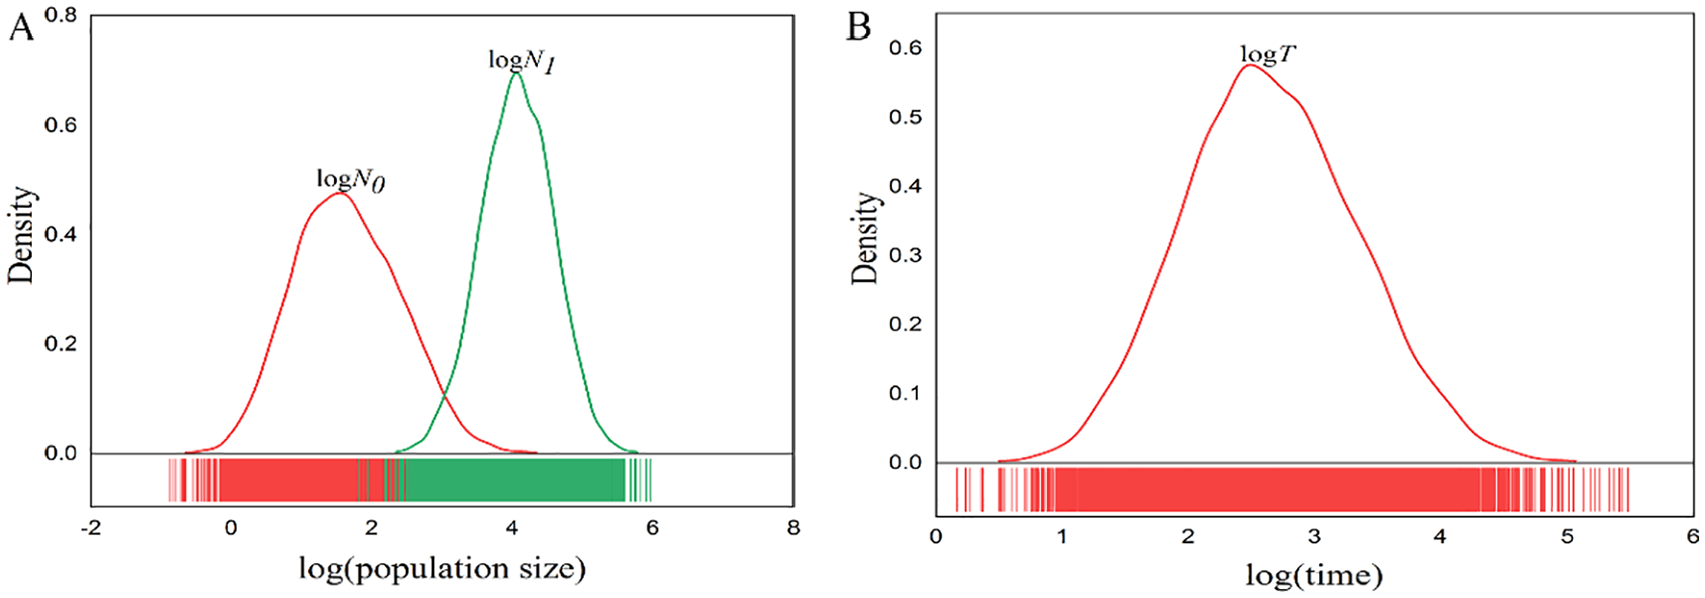
Posterior distributions of the demographic parameters using MSVAR 1.3 with multiple replicates: (A) ancestral (N0) and present population sizes (N1) and (B) time since the giant panda population decrease (T).
Posterior distributions of N0, N1, and T (year) by MSVAR 1.3.
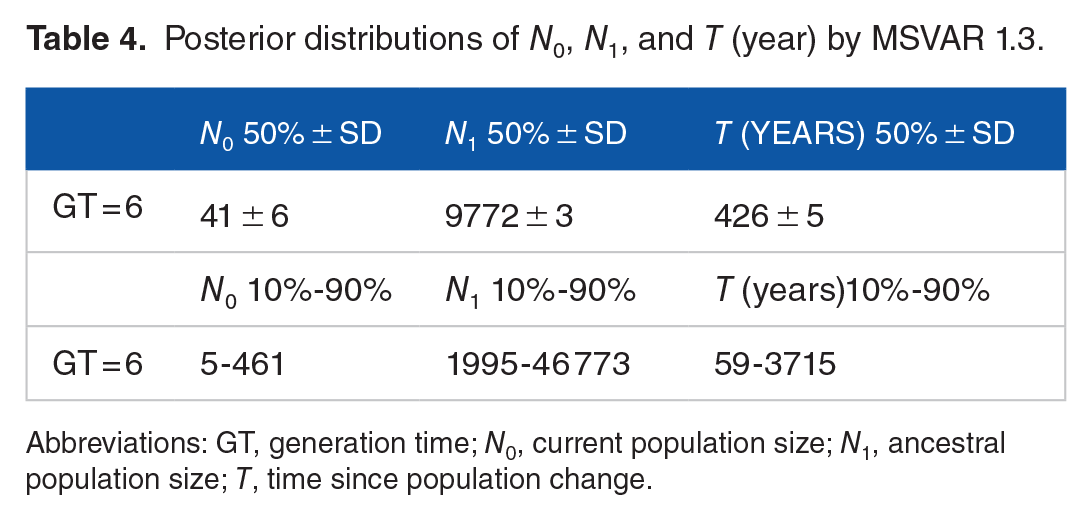
Abbreviations: GT, generation time; N0, current population size; N1, ancestral population size; T, time since population change.
Population viability analysis
Population viability analysis showed that retention rate of genetic heterozygosity and probability of survival were only 73.41% and 37.9%, respectively, after 100 years (Table 5; Supplemental Figure S1), indicating that this small isolated giant panda population has a high future risk of extinction without considering environmental pressure and natural disasters. After the 4 individuals were released, the retention rate of genetic heterozygosity and probability of survival increased by 6.39% and 9.9%, respectively (Table 5; Supplemental Figure S1), indicating that the release of the giant panda was an effective strategy to save this small isolated population. The results of PVA indicated that the retention rate of genetic heterozygosity and the probability of survival of the population was much higher when only female giant pandas were released rather than when only males are released (Table 5). One of the main goals of conservation genetics is to ensure the genetic diversity and survival of the species as much as possible for the future, ensuring that the genetic diversity of the species remains at least 90% of the present level and that extinction rates are less than 2% in the next 100 years. 46 Therefore, based on the 22 release strategy combinations, the results of VORTEX10 simulations showed that 11 of the following release strategies were effective: release 3 to 5 females every 10 years, release 1 male and 2 females, 3 males and 1 female, 2 males and 2 females, 1 male and 3 females, 1 male and 4 females, 2 males and 3 females, 3 males and 2 females, or 1 male and 4 females, respectively, every 10 years (Table 5).
Reserved genetic heterozygosity and probability of survival after 100 years under different release strategy combinations.

A total of 22 release strategy combinations were tested. Abbreviated coding is as follows: M, male; F, female; Y, year; values associated precede coding letters. “No Release” indicates that no giant pandas were released into the population. “Releasing 4” was the addition of the 4 released giant pandas. 1M10Y-5M10Y: release 1 to 5 males every 10 years; 1F10Y-5F10Y: release 1 to 5 females every 10 years; 1F1M10Y: release 1 female and 1 male every 10 years; 1F2M10Y: release 1 female and 2 males every 10 years; 2F1M10Y: release 2 females and 1 male every 10 years; 1F3M10Y: release 1 female and 3 males every 10 years; 2F2M10Y: release 2 females and 2 males every 10 years; 3F1M10Y: release 3 females and 1 male every 10 years; 4F1M10Y: release 4 females and 1 male every 10 years; 3F2M10Y: release 3 females and 2 males every 10 years; 2F3M10Y: release 2 females and 3 males every 10 years; 1F4M10Y: release 1 female and 4 males every 10 years.
Predictive analysis of genetic diversity
To test the effects of population size and sex on genetic diversity based on the microsatellite data, BottleSim version 2.6 for the prediction of species extinction risk has been widely used in conservation biology.47-49 The effect of population size on genetic diversity under different population numbers (30, 50, 100, 200) was simulated when the ratio of males to females was 1:1. The results showed that as the population decreased, the number of alleles and the heterozygosity decreased significantly, and the smaller the population, the more the reduction. When the size of the population was 30 or 50, the number of alleles and heterozygosity decreased very rapidly, and after 100 years, the number of alleles and heterozygosity retention rates were only 69.9% and 85.2% (30), and 78.9% and 90.7% (50), respectively (Figure 3; Table 6). When the size of the population was 100 or 200, the number of alleles and heterozygosity decreased slowly after 100 years, and the number of alleles and heterozygosity retention rates were 87.8% and 94.3% (100), and 95.7% and 97.9% (200), respectively (Figure 3; Table 6). The results of BottleSim version 2.6 simulations suggested that when the population was stable, the sex ratio deviated from 1:1, resulting in significant decreases in alleles and heterozygosity. Therefore, the size of this population was at least 50, and the release strategies need to consider the sex of giant pandas to be released. Combining the results of PVA, releasing both sex could produce better results than only female or male was released.

Variation in the number of alleles (A) and expected heterozygosity (B) for the Liziping giant panda group in 100 years. Na (200), Na (100), Na (50), and Na (30) indicate the number of alleles for population sizes of 200, 100, 50, 30. He (200), He (100), He (50), and He (30) indicate the expected heterozygosity for population sizes of 200, 100, 50, and 30.
Reserved genetic diversity after 100 years under different simulation modules and parameters.
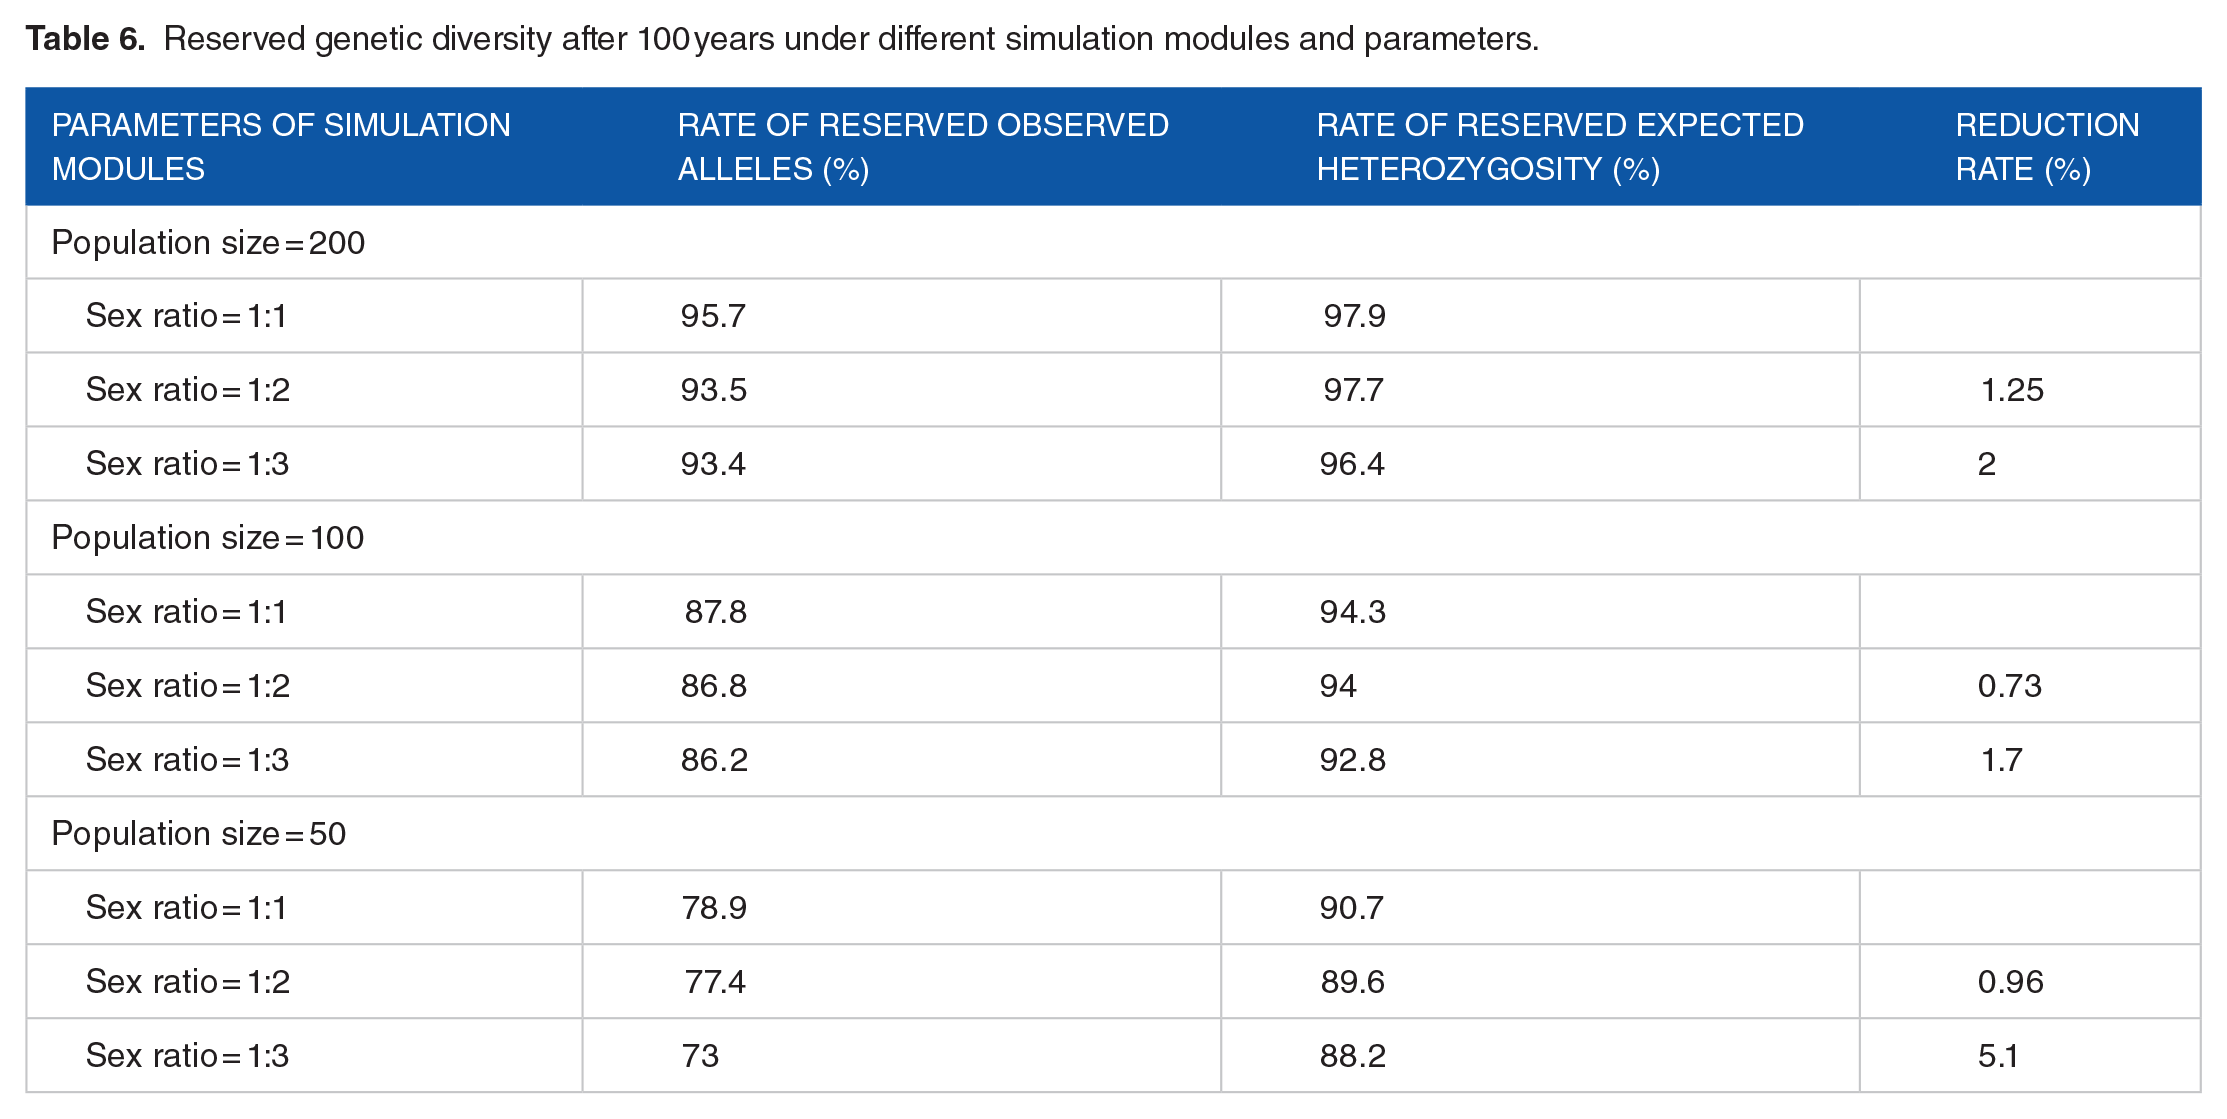
Population sex ratio is the ratio of males to females (M:F). Reduction rate is the average value of reduction for reserve alleles and reserve expected heterozygosity compared with scenarios where the sex ratio is 1:1.
Discussion
Compared with genetic diversity reported for other giant panda populations, the population we examined here has medium-level genetic diversity. Mutation, migration, inbreeding, and genetic drift all lead to deviation from the Hardy-Weinberg equilibrium 50 and in this study, 5 loci (Ame-μ013, Ame-μ011, Panda-22, gpz-47, and gpz-6) significantly deviated from equilibrium. Sites deviating from the equilibrium indicated heterozygote deficiency (Ho < He), and there was a significant inbreeding phenomenon that may have been the cause of the deviation from the equilibrium. The Liziping National Nature Reserve is located in the Xiaoxiangling Mountains, a region currently experiencing habitat fragmentation and fragment isolation. 3 Studies have shown that when the population has been in a relatively stable and small area, the probability of inbreeding of the population will increase as the number of individuals with relatives increases. 51 Conversely, when the population was sparse, it was susceptible to genetic drift, which leads to the disappearance of rare alleles, a reduction in genetic diversity, and an increased risk of extinction. 46 In this study, we found that after 4 giant panda individuals were released to this population, there were no significant changes in genetic diversity. The purpose of releasing new individuals into a small population was to increase population size and genetic diversity. 52 When only a few individuals are released into an isolated small population, the genetic diversity of the new population will not change significantly53,54 because only released individuals survive to produce offspring which can contribute genetic diversity to the population. 55 Unfortunately, we have not monitored the fecundity of released giant pandas except “Lu Xin.” Therefore, the Liziping reserve should continue to strengthen the reproductive monitoring of giant pandas and continue to conduct microsatellite experiments to improve genetic pedigree information. In addition, the reserve should continue to release individuals with reproductive potential. This will help avoid inbreeding and ensure sufficient genetic diversity of the giant panda population to avoid the risk of extinction.
The BOTTLENECK test performed here did not detect a bottleneck signal in this population, indicating that the population was still relatively stable. However, genetic data analyzed with MSVAR showed that this population had a recent decrease by approximately 238-fold from 426 years before present. We speculated that this population just experienced a decrease in population but not a bottleneck because there was some overlap between log (N0) and log (N1). For instance, Hu et al 42 in their study of the Liangshan panda population found no evidence for a population bottleneck with BOTTLENECK and reported a recent population contraction with MSVAR. Our results of MSVAR showed that there was a large ancestral population size in this area, but now, only 41 giant pandas were remaining (Table 4). We, therefore, stress that it was urgent to protect this small isolated population, which is at high risk of local extinction.
Our results based on VORTEX10 and BottleSim version 2.6 suggested that more giant pandas should be released in fixed sex ratio groups to achieve a larger population size (to at least 50) and higher genetic diversity in the Liziping Nature Reserve. Our previous research also had shown that releasing giant pandas to the wild was quite effective 15 which was additionally confirmed in this study, which also suggests that released individuals could improve the retention rate of genetic heterozygosity and probability of survival. However, only 2 research institutes in China (Chengdu Research Base of Giant Pandas Breeding and China Conservation and Research Center for the Giant Panda) are engaged in giant panda release and prerelease training, resulting in only a few giant pandas being trained and released. Considering the special status of giant pandas in China 1 and based on the results of VORTEX10 and BottleSim version 2.6, we recommend this release strategy: release 1 male and 2 females every 10 years. We anticipate that this release strategy will be effective in promoting the recovery of this small isolated population (Table 5). So this population will need to release 10 males and 20 females in the future (Supplemental Table S3). Previous genomic data sets have shown that populations from Xiaoxiangling Mountains and Qionglai Mountains are genetically similar.56,57 However, due to putative isolation by the China National Highway 108, 5 the genetic differentiation has happened between the Xiaoxiangling and Daxiangling population.12,13 To improve genetic diversity and evolutionary potential in this small isolated population (Xiaoxiangling), Chinese authorities started the release strategies in 2009, and all captive giant pandas come from the Qionglai Mountains due to the genetic similarity. In future, we suggest that released individuals can consider coming from Minshan Mountains, which may contribute more genetic diversity into this isolated population (Xiaoxiangling).56,57
Conclusions
In summary, after the release of the giant pandas in Liziping, the population in the reserve had a medium-level genetic diversity and was relatively stable. However, based on the demographic history and predictive analysis for the future, this giant panda population has a high risk of extinction. The rejuvenation of this population still has a long way to go. Our studies have shown that the release of giant pandas has a positive impact on panda populations. Therefore, to save this giant panda population in Liziping, the release should be continued in this area, the population of local giant pandas should reach at least 50, and we also recommend 1 release strategy: release 10 males and 20 females in the future. The release of individuals should also consider the genetic background of individuals to avoid inbreeding, and released individuals can consider coming from the Minshan Mountains. Finally, the reserve should use a molecular marker technology such as microsatellites to build accurate family trees and to record genetic backgrounds of individuals to monitor the offspring of released giant pandas and provide a reference for the further release of individuals.
Supplemental Material
Supplementary_Material_xyz386656d9e5cda – Supplemental material for Genetic Diversity and Prediction Analysis of Small Isolated Giant Panda Populations After Release of Individuals
Supplemental material, Supplementary_Material_xyz386656d9e5cda for Genetic Diversity and Prediction Analysis of Small Isolated Giant Panda Populations After Release of Individuals by Qin-Long Dai, Jian-Wei Li, Yi Yang, Min Li, Kan Zhang, Liu-Yang He, Jun Zhang, Bo Tang, Hui-Ping Liu, Yu-Xia Li, Li-Feng Zhu, Zhi-Song Yang and Qiang Dai in Evolutionary Bioinformatics
Footnotes
Acknowledgements
The authors thank Dun-Wu Qi for generous assistance during the study. They thank the staff of the State Forestry Administration, Sichuan Forestry and Grassland Bureau, Chengdu Research Base of Giant Panda Breeding, and the China Giant Panda Protection and Research Center for their kind help during fieldwork.
Funding:
The author(s) disclosed receipt of the following financial support for the research, authorship, and/or publication of this article: This research was supported by the National Natural Science Foundation of China (grant no. 31772481), the National Natural Science Foundation of China (grant no. 31741112), and the National Key R&D Program of China (grant no. 2016YFC0503200).
Declaration of Conflicting Interests:
The author(s) declared no potential conflicts of interest with respect to the research, authorship, and/or publication of this article.
Author Contributions
Q.-L.D., J.-W.L., L.-F.Z., Z.-S.Y. and Q.D. designed the experiments, analyzed the data, and drafted the article. Q.D., J.-W.L., M.L., Y.Y., K.Z., L.-Y.H., and J.Z. performed the research. B.T., H.-P.L., and Y.-X.L. participated in sample collection. Z.-S.Y. and Q.D. edited the article.
Supplemental Material
Supplemental material for this article is available online.
References
Supplementary Material
Please find the following supplemental material available below.
For Open Access articles published under a Creative Commons License, all supplemental material carries the same license as the article it is associated with.
For non-Open Access articles published, all supplemental material carries a non-exclusive license, and permission requests for re-use of supplemental material or any part of supplemental material shall be sent directly to the copyright owner as specified in the copyright notice associated with the article.