
Abstract
For assessing treatment response to novel cancer therapeutics, dynamic contrast enhanced magnetic resonance imaging (DCE-MRI) is a valuable tool. Quantitative functional parameter estimates can be obtained by fitting physiological models to the data. In this study the IR-TrueFISP approach was evaluated as DCE-MRI acquisition sequence against the widely used 3D-Flash protocol. For comparison both protocols providing different spatial and temporal information were investigated in phantom and patient examinations. 12 advanced tumor patients underwent two examinations on consecutive days using both protocols. Results were compared and were in good agreement with each other. IR-TrueFISP data showed a lower variability compared to 3D-Flash results. This work demonstrates the pros and cons of both investigated methods. It was demonstrated that the known IR-TrueFISP sequence can successfully be employed as DCE-MRI acquisition method estimating perfusion parameters. The benefits of the IR-TrueFISP protocol are high temporal resolution and good accuracy.
Introduction
Contrast enhanced imaging techniques are commonly used to evaluate tumors. 1 Dynamic contrast-enhanced magnetic resonance imaging (DCE-MRI) is a method of imaging the physiology of the microcirculation 2 by tracking the kinetics of a low-molecular weight contrast agent. It is therefore suitable to monitor changes in the tumor perfusion induced by anticancer therapies.3,4 DCE-MRI showed its potential to provide data concerning changes in vascular perfusion and permeability characteristics of tumors during anti-angiogenic therapies.5,6 Moreover, DCE-MRI has shown dose-related changes in tumor vascular variables following treatment with chemotherapeutic and anti-angiogenic agents. 5
There are various approaches to acquire DCE-MRI data characterized by the MRI sequence used. Typically, T1 measurements are based on inversion-recovery (IR), saturation-recovery (SR) methods or on multi flip angle approaches in combination with a read out module like gradient echo (GE), spin echo (SE), echo planar imaging (EPI), turbo spin echo (TSE) or TrueFISP (True Fast Imaging with Steady state Precession). EPI sequences are widely used in the brain. Due to its artifact behavior, EPI was not further considered here in the context of abdominal imaging.
Based on their different inherent principles of signal generation, they may lead to data of different characteristic.
For gradient echo sequences, an inversion recovery and a multiple flip angle approach exists. The latter has the great advantage of not requiring long TR. Therefore, it is used frequently in in vivo examinations.
In this study two protocols were placed side by side: the multi flip angle approach using a gradient echo read out sequence and an IR-TrueFISP protocol.
The used IR-TrueFISP sequence works as a Look-Locker sequence 7 measuring T1 from a single recovery of the longitudinal magnetization resulting in a series of single slice images with different T1 weightings.8,9 The 3D-Flash (Fast Low Angle Shot) method is based on spoiled gradient echo sequence and gains a 3D volume series of data and pre scans with variable flip angles. 10
Phantom as well as in vivo patient examination were carried out with both protocols and compared. In vivo comparison was carried out as an amendment study to a clinical phase II study, whose setup and results were published elsewhere. 11 A sub cohort of patients within the study received two baseline scans before start of treatment using the two methods to acquire DCE-MRI data. This comparison and the general evaluation of the IR-TrueFISP method applied in DCE-MRI measurements are subject of this work.
Materials and Methods
Data acquisition
All experiments and examinations were performed on a clinical routine scanner (1.5T Sonata, Siemens Medical Solutions, Erlangen).
Phantom studies were carried out using a Eurospin II test object (Diagnostic Sonar Ltd., Livingston) for relaxation time measurements holding 7 sample tubes. The tubes contained gels with T1 values ranging from 446 to 1149 ms. To verify the manufacturer T1 values, the phantom was scanned using an inversion recovery turbo spin echo (TSE) sequence (TE = 6.6 ms, TRtrue = 10000 ms, Turbo factor 7, TI = [23, 50, 88, 287, 486, 685, 884 1084, 1283, 1850] ms, FOV = 300 mm, slice thickness = 10 mm α = 180°, matrix size = 256 × 256 pixel). To make sure that measurements with different TI were acquired with the same TR = 10000 ms, the actual TR setting was adjusted for each TI to compensate the TI differences.
Phantom measurements were also performed with the IR-TrueFISP8,9 and a 3D-Flash protocol using parameters as follows.
2D IR-TrueFISP: TR/TE = 3000 ms/1.28 ms, TI = [59, 265, 471, 676, 882, 1087, 1293] ms, matrix size of 128 × 128 pixels, single slice of 10 mm, and α = 40°. The sequence scheme is displayed in Figure 1.
Sequence scheme of a completely blanced TrueFISP sequence with an inversion recover preparation block.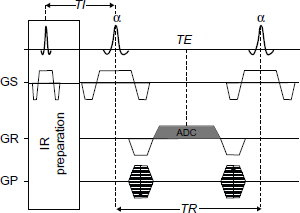
3D-Flash: TR/TE = 3.23 ms/1.12 ms, matrix size of 128x128 pixels with partial Fourier acquisition in phase encoding direction, 20 slices each 3.5 mm, α = 13°. Flip angles of 3D-Flash pre scan series for T1 mapping were selected as 2°, 8° and 25° in accordance to the analysis in. 12
Both protocols used a FOV of 400 mm. To determine reproducibility, accuracy measurements were repeated within a session and on different days.
The protocol was reviewed and approved by the institutional ethical committee, and informed consent was obtained from all patients. Subject selection was restricted to patients with advanced and progressive cancer and is described in detail elsewhere. 11 A randomly selected sub cohort of 12 patients (7 female; 5 male) with a mean age of 64 years was entered into the MRI comparison study. Since there was no restriction in the clinical study with respect to tumor type, the types of examined lesions in the sub cohort varied: hepatic/peritoneal lesions in 4 (one of them at liver portal), mediastinal in 3, pancreatic in 1 and lesions located at the chest wall in 2 patients. The scope of this work is the methodological comparison and not the evaluation of the angiogenic effect of the therapy. Therefore, and for ethical reasons the examination with both protocols was restricted to one time point of the clinical study. Before the start of therapy, all subjects were examined twice on consecutive days. The IR-TrueFISP protocol was used on one day while the 3D-Flash protocol was used on the other.
The same IR-TrueFISP and 3D-Flash protocols used for the phantom studies were used with 72 (3D-Flash) and 120 (IR-TrueFISP) repetitions and a time resolution of 5 s and 3 s respectively, as shown in Figure 2. This led to the total acquisition time of 6 min for each protocol. Subjects were placed supine on the magnet bed. Standard spine and body array coils were used to acquire imaging data. To minimize through-plane movement during breathing, data was acquired in a mainly coronal oriented view. Patients were asked to breathe gently.
Timing scheme of the IR-TrueFISP (top) and the 3D-Flash (bottom) acquisition protocol.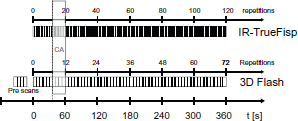
A single dose (0,2 ml/kg body weight) of a Gd-based MR contrast agent (Magnevist©, Bayer HealthCare, Leverkusen) was administered to perform the in vivo DCE-MRI scans. A power injector was preset with an injection delay of 36 s, an injection rate of 2 mL/s and was started concurrently with the MR-scan. The injection delay allows a steady state magnetization to develop and to acquire a sufficient range of time points for baseline calculation. Data of the initial time point of 3D-Flash and the initial 3 time points of IR-TrueFISP data were skipped for data analysis.
Data analysis
Data analysis of the DCE-MRI data sets was performed on one target lesion per patient.
T1 values were calibrated using a linear approach against reference values before further analysis.
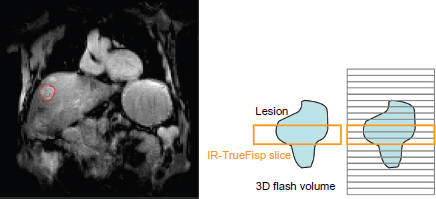
As shown in Figure 3, three slices of the 3D-Flash data covering the same volume as the corresponding IR-TrueFISP data were analyzed with a custom-built software package developed under Matlab© (The MathWorks, Inc., Natick). Data processing consisted of the following distinct steps:
Typical lesion localization within the liver. A region of interest (ROI) was defined in a pre contrast frame for all IR-TrueFISP and Flash images spanning the tube/the lesion as shown in Figure 2. A semi-automatic tracking of the ROI over the repetitions using a correlation analysis-based algorithm was done to compensate for patient movement. The median in plane correction distance was calculated to check influence of individual patient motion on single measurements. T1 quantification for IR-TrueFISP data was performed from magnitude images, as described by Nekolla et al.
13
For each time point the T1 map was calculated from the corresponding seven IR-TrueFISP images with different TI. T1 quantification for 3D-Flash data was done with the variable flip angle method (VFA)
10
using the data set of a particular time point in combination with the pre scans. T1 quantification for TSE data used a least square fit on the relation S ≍ ρ(1–e-TR/T1) * e-TE/T2, with ρ.proton density. Conversion of signal intensity data to contrast agent concentration were calculated according to C = (1/T1 - 1/T10)/kt, with kt = 4.3 L*mmol-1*s-1 the relaxivity of Gd-DTPA taken from literature.
14
Data-driven analysis was performed assessing initial area under curve within the first 60 s after contrast agent (CA) application (iAUC60). Pharmacokinetic modeling was done using the standard Tofts model.
15
Ktrans and kep are calculated using a Levenberg-Marquardt fitting algorithm. Ktrans represents the volume transfer constant between blood plasma and extracellular extra-vascular (EES) space, which equals the permeability surface product under permeability limited conditions, while kep stands for the rate constant between the EES and blood plasma.
Assessing agreement between the methods was done using the procedure proposed by Bland-Altman. 16
While there is consensus 17 on which quantitative endpoints should be used for DCE-MRI in the context of anti-angiogenic therapies, in this study comparison was limited to IAUC60 and Ktrans as well as calculated T1 values.
Results
T1 measurements made in phantoms are summarized in Figure 4. Data acquired with the TSE protocol led to T1 values with an average difference of 1.6% compared to the values given by the phantom manufacturer.
Estimated T1 values from phantom experiments with three different sequences plotted against reference values given from the phantom manufacturer.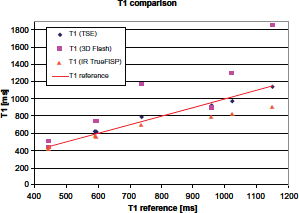
While phantom reproducibility measurements for IR-TrueFISP data showed an excellent reproducibility with a T1 difference below 0.5% for each individual vial, 3D-Flash data resulted in T1 differences in the range of 2% to 16% with an average deviation of 7.4%. For measurements on different days, T1 difference increased on average to 1.9% for IR-TrueFISP and to 13.1% for 3D-Flash.
The Bland-Altman plots in Figure 5 for the 3D-Flash data vs. reference data show variations of difference in T1 between -10 and +700 ms with a mean difference of 231 ms, which was interpreted as bias.
Bland-Altman plots for phantom T1 values from 3D-Flash and reference (top) and IR-TrueFISP and reference (center).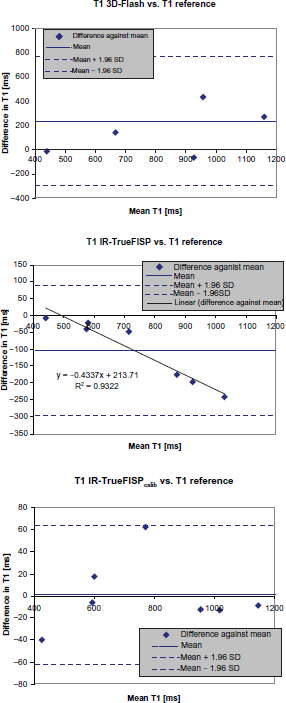
On average uncalibrated 3D-Flash data resulted in +27% higher T1 values compared to the reference. Except for this scaling and a high variability there was no further systematic dependency on T1 of the data. The variability was reflected in a standard deviation (StDev) of 26% over the percentage differences of the individual vials compared to 8% for IR-TrueFISP and 5% for TSE.
For IR-TrueFISP data vs. reference the plot shows a systematic variation depending on T1. This deviation can be described by a linear function which was then used for data calibration. The resulting values are plotted in the lower plot of Figure 4 showing remaining non systematic variation in difference in T1 between -39 and +62 ms.
The calibrated data shown in Figure 6 served as a basis for further analysis. For the IR-TrueFISP data this resulted in excellent agreement with the reference values.
T1 phantom data from IR-TrueFISP (left) and 3D-Flash (right) experiments before and after calibration.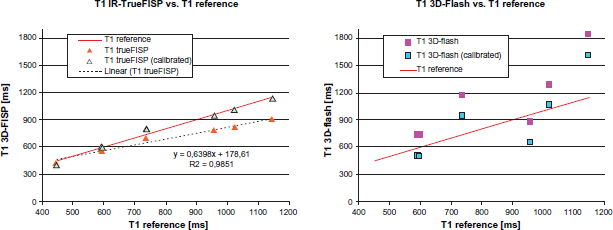
10 valid patient data sets were included in the final data analysis. 2 patients who had at least one scan unsuitable for DCE-MRI analysis due to patient motion were excluded from the analysis. The median distance correction was calculated from ROI tracking data. Its values ranging from 0 to 2.1 pixels showed no further indications for unacceptable strong motion. The average value was 0.5 pixels over the remaining 10 patients.
Figure 7 shows the CA concentration curves of a single patient. In general it was observed that IR-TrueFISP data was less affected by signal variations than 3D-Flash.
CA concentration time course acquired with IR-TrueFISP (o) and 3D-Flash (x).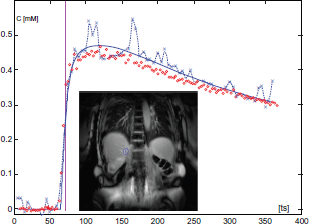
On the basis of individual patients this led to a two to three times higher average fit error (Chi square) of the model fit for 3D-Flash data compared to IR-TrueFISP data.
In addition to the visual review regarding correspondence of the independently selected volume of interest for the single IR-TrueFISP and the corresponding three 3D-Flash slices, the agreement was crosschecked calculating their volume ratio. The volume ratio (single IR-TrueFISP/corresponding three 3D-Flash slices) was 1.13 ± 0.28 and the correlation of the individual volume values derived from the two methods was 0.99.
No dependency of baseline T1 values before contrast medium application, T10, from the lesion type or location was observed.
In Figure 8 results from phantom and in vivo patient data are presented. T1 values from IR-TrueFISP measurements are plotted against the T1 values from 3D-Flash measurements. All in vivo data points are above the line of equality indicating the position of equal values.
T10 values (baseline T1 value before contrast media application) from IR-TrueFISP over 3D-Flash data.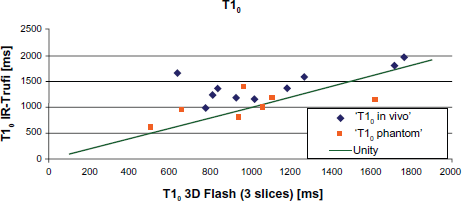
The agreement of 3D-Flash and IR-TrueFISP data was analyzed using Bland-Altman diagrams of Ktrans and iAUC60 which are plotted in Figures 9 and 10.
Bland-Altman plot of Ktrans for all patients (top) and excluding the four patients showing Ktrans values beyond ±2 [min-1]. Bland-Altman plot of iAUC60 for all patients (top) and excluding the four patients showing iAUC60 values beyond ±20 [mmol/l/s].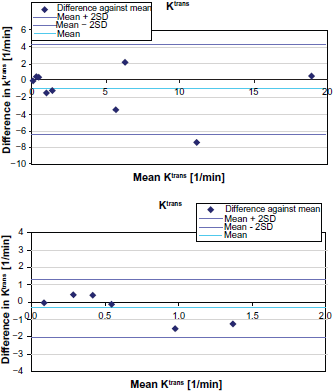
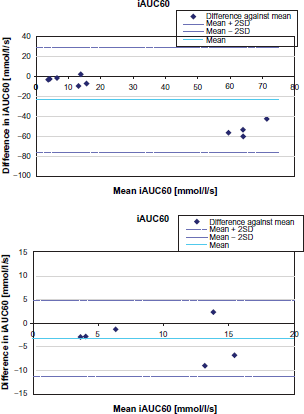
Both plots show four clearly separated outliers with large values and large differences. Additional detailed inspection of the morphological images of these four patients revealed liver portal, mediastinum, or pancreas as particular lesion locations. These 4 patients are therefore discussed separately.
The correlation coefficients were 0.95 for IAUC60 and 0.91 for Ktrans values calculated on data based from the two methods.
For visual comparison and illustration, parameter maps were generated. In R10 = 1/T10 and Ktrans maps originating from 3D-Flash and IR-TrueFISP data, the target lesion as well as other features are correspondingly depicted as shown in Figure 11.
Parameter map (R10 [A]; Ktrans [B]) comparison of the corresponding slice based on 3D-Flash ([A] left and [B] left) and IR-TrueFISP ([A] right and [B] right) data.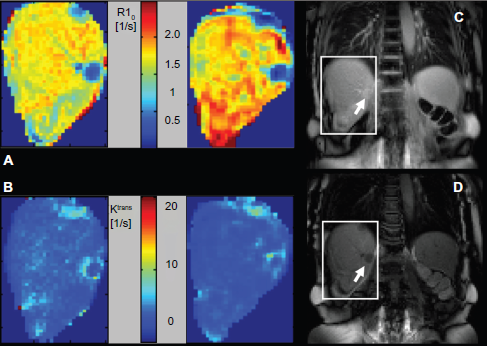
Discussion
The multi flip angle approach in combination with a gradient echo (GE) read out module is widely used for DCE-MRI applications. The main limitations of this method are the temporal resolution and accuracy. IR-TrueFISP was already successfully presented as an approach to basically quantify T1. 9 In this work a direct comparison of both methods applied to DCE-MRI is made.
Both approaches offer measurement of micro vascular parameters associated with human cancers. The rigor and details surrounding the data acquired with both sequences are discussed, especially how IR-TrueFISP may help to overcome limitations of the 3D-Flash protocol.
Phantom results of the TSE sequence showed the validity of the reference values. Even though the TSE experiment showed the highest accuracy in reproducing T1 values of the reference, for practical reasons such as acquisition time it was not possible to include the TSE sequence during the clinical study examinations.
The large variation in differences of 3D-Flash data to T1 reference values also resulted in a clearly decreased reproducibility for intra session as well as for measurement on different days. However, for both the comparison to reference values and for reproducibility performance, the variations increased with larger T1 of the probe. For IR-TrueFISP the observed variations in reproducibility measurements were on a constant low level over the whole examined T1 range.
Linear shift correction parameters of the in-plane motion correction showed no systematic dependency on the sequence used. Variations seem to depend mainly on the patient and his condition at the time of examination. On the level of individual examinations, in vivo data showed similar signal variations as phantom data. Subjects were examined with both protocols on the same scanner. It was taken care of individual patient motion effects with ROI tracking along the time series. Therefore remaining variations seem to be dominated by sequence and scanner inherent contributions.
The advantage of the high temporal resolution of 3 s for the IR-TrueFISP method is especially significant for the accuracy of subsequent model fits. This is even more important in cases with fast rising CA concentration curves as in many tumors. 18 In unfavorable cases the slope of CA concentration curves may only be described by few data points. This depends on the CA uptake and the temporal resolution of the method used,
The 3D-Flash protocol has a 2/3 larger sampling interval. This contributes to a greater uncertainty in estimating the contrast agent arrival time, which may be at any time point between two sampling points. The outcome are higher instabilities in the subsequent fitting procedures, which may contribute to the observed higher difference in T1 compared to reference values and may propagate to the finally calculated DCE result values.
Accuracy of parameters describing the slope of the CA uptake like Ktrans benefit especially and highly from a better temporal resolution. Above all, this applies to abdominal lesions such as liver lesions with their fast enhancement dynamic. Parameters like IAUC60 are much less affected by the sampling density of the data points.
Regarding in-plane spatial resolution both applied protocols are identical. Through-plane resolution is three times higher for the 3D-Flash protocol, which leads to less potential influence of partial volume effects.
There are several factors that may contribute to the observed three times higher StDev over the percentage T1 differences to the reference of the individual vials in T1 calculation, based on the 3D-Flash method in comparison to the IR-TrueFISP approach. For the latter a T1 fit is carried out with 7 data points at each time point while the 3D-Flash approach implementation uses only 4 points for T1 estimation. Only one of them is measured as variation in time, while the three others originate from the pre scan and therefore are measured only once. The assumption of such multi flip angle methods is that the pre contrast pre scans are also valid for the time points after CA application.
One might think the acquisition of more than 4 pre scan data sets with different flip angles may improve the accuracy of T1 calculation for 3D-Flash acquisition. However, depending on various factors like signal to noise this is not necessarily the case 19 and would be at the cost of longer acquisition times.
Poor reproducibility can either be caused by random measurement errors or by physiological changes between measurements. The latter may be neglected for phantom experiments. The poor reproducibility of the 3D-Flash protocol even in phantom experiments has to be attributed to random measurement errors or noise solely. Therefore, it has to be assumed that for in vivo measurements this is also the dominant source of variation.
Similar observations were done by Brooks using a 3D-Flash sequence in the context of DCE-MRI in breast examinations, stating ‘There is no obvious explanation for this behavior.’ 20
Compared to reference values a systematic underestimation of T1 from IR-TrueFISP, which increased linearly with T1, and a small offset of T1 from 3D-Flash data was found. A systematic underestimation of T1 from 3D-Flash data compared to IR-TrueFISP data in phantom experiments as found in 9 was not observed.
While single slice acquisition schemes demand beforehand a more precise selection of the target region, 3D data schemes allow analysis of larger volume of interest giving the option to select later various areas for parameter calculation. However, the initial and end slice locations of 3D-Flash protocols are known to give inaccurate results due to wraparound artifacts and variability in the excitation profile of the RF pulses. Without further actions this may introduce additional errors for the more exterior slices. At the cost of temporal or spatial resolution the extent of the wraparound artifact can be influenced by slice-oversampling or other vendor specific functions. Restriction of data analysis to the center slices of the 3D data set as for practical reasons often done impairs the volume coverage advantage of this method.
Single slice acquisition schemes, like the IR-TrueFISP implementation used here, have to deal with potential off-target sampling. There is consent 17 about a lower limit in lesion size of no less than 2 cm to successfully perform DCE-MRI examinations. Therefore, this concern only comes into effect in the presence of very pronounced subject motion. This can be minimized by comfortable patient positioning, selection of slice orientation to minimize through plane motion, selection of the most suitable target lesion if there are more then one, and appropriate selection of the frequency encoding direction.
Calculation of DCE-MRI parameters took place after both methods were calibrated with phantom measurements to the reference values. The correlation coefficients of the IAUC60 and Ktrans values calculated from both methods were 0.91 and 0.95 respectively. The results originating from both methods showed no obvious systematic deviation. However, it seems that the comparison of IAUC60 and Ktrans results of both methods are mainly influenced by the variability of the 3D-Flash data described above.
The large IAUC60 and Ktrans values in 4 patients are most likely attributed to partial volume effects of larger vessels, which were inevitable due to the particular lesion location and pathology. Partial volume effects in these patients may result in misleading values masking details in the pathology. For method comparison these four patients were skipped.
In the application of therapy monitoring, the primary interest usually is not absolute values calculated from DCE-MRI measurements but their percentage changes between baseline and follow up measurements. The question is how these changes are affected by initially biased T1 values. Differences of descriptive parameters like IAUC60 are not affected by biased T1 values since any bias cancels out. The same applies for Ktrans as long as the arrival time is kept fixed. Therefore, even if the parameters itself are biased by local setup and applied methods, the derived differences between baseline and follow up examination are still good estimations of changes between measurements. However, this is only true for systematic errors and not for random variations. Since the initial variations of T1 observed in this study for data acquired with IR-TrueFISP are dominated by a systematic component, the derived differences between measurements are valid.
In conclusion, this work demonstrates for the first time the potential of the IR-TrueFISP sequence for DCE-MRI applications. The pros and cons of the used 3D-Flash and IR-TrueFISP implementations were evaluated. If, like in abdominal lesions, high temporal resolution is needed and volume coverage is only secondary, the IR-TrueFISP protocol even in its current single slice implementation is an excellent tool for DCE-MRI. It may be applied in clinical routine as well as in clinical studies testing novel anti-angigenic and anti-vascular therapies. Further development to overcome the single slice limitation will eliminate the main current drawback of the IR-TrueFISP method compared to other approaches.
Author Contributions
Conceived and designed the experiments: MB, MR. Analyzed the data: MB. Wrote the first draft of the manuscript: MB. Contributed to the writing of the manuscript: MR. Agree with manuscript results and conclusions: MB, MR. Jointly developed the structure and arguments for the paper: MB MR. Made critical revisions and approved final version: MR. All authors reviewed and approved of the final manuscript.
Competing Interests
MB has been a consultant to Novartis, Panel intelligence, and Siemens. KM discloses no potential conflicts of interest.
Funding Sources
The subjacent clinical study in which context this data was acquired were supported partly (organisation, administration, documentation) by a restricted grant from Pfizer Inc. to K.M..
Footnotes
Acknowledgements
The authors thank Dr. Ralph Strecker and the MRDAC study team for help during data acquisition and patient handling.
As a requirement of publication author(s) have provided to the publisher signed confirmation of compliance with legal and ethical obligations including but not limited to the following: authorship and contributorship, conflicts of interest, privacy and confidentiality and (where applicable) protection of human and animal research subjects. The authors have read and confirmed their agreement with the ICMJE authorship and conflict of interest criteria. The authors have also confirmed that this article is unique and not under consideration or published in any other publication, and that they have permission from rights holders to reproduce any copyrighted material. Any disclosures are made in this section. The external blind peer reviewers report no conflicts of interest.