
Abstract
Breast cancer incidence is increasing worldwide. Early detection is critical for long-term patient survival, as is monitoring responses to chemotherapy for management of the disease. Magnetic resonance imaging and spectroscopy (MRI/MRS) has gained in importance in the last decade for the diagnosis and monitoring of breast cancer therapy. The sensitivity of MRI/MRS for anatomical delineation is very high and the consensus is that MRI is more sensitive in detection than x-ray mammography. Advantages of MRS include delivery of biochemical information about tumor metabolism, which can potentially assist in the staging of cancers and monitoring responses to treatment. The roles of MRS and MRI in screening and monitoring responses to treatment of breast cancer are reviewed here. We rationalize how it is that different histological types of breast cancer are differentially detected and characterized by MR methods.
Keywords
Introduction
Breast cancer has dramatic emotional and physical impacts on the person afflicted with it, and from a public health perspective it is a disease of accelerating socio-economic importance. Approximately 10% of all new cancers diagnosed are female breast cancer. This makes detection and treatment of the disease of high priority world-wide.
1
The incidence of breast cancer is increasing in almost all countries although mortality is decreasing, due to earlier detection of tumors and advances in treatment.
2
The map in Appendix 1, Figure 1 shows the regional incidence of female breast cancer.
3
Photomicrographs of various histological types of breast cancers provided by National University Hospital, Singapore. 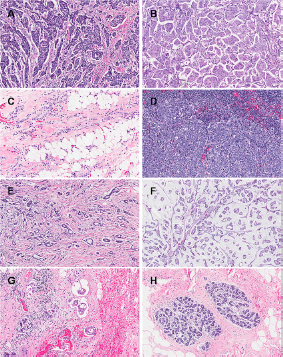
We aimed to increase our understanding of the success rates in clinical detection of breast cancer using magnetic resonance (MR) methods by inspecting the structural features of the cancer's various types. We surmised that detection of the different types of breast cancer by MR varies because of differences in the organization and structures of the cells and of the interstitial mucin and fibers. There are likely to be systematic differences in MR relaxation times, spectral line broadening, and diffusional mobility of water. Therefore, we begin this explanation of breast cancer MR-detectability with an inspection of the micro-anatomical structures in these cancers.
Photomicrographs obtained at the National University Hospital, Singapore, of the six “archetypal forms” of invasive breast cancers are shown in Figure 1. The cancers can be classified into six histological types: (1) Invasive ductal carcinoma (IDC; Fig. 1A and B); (2) invasive lobular carcinoma (ILC; Fig. 1C); (3) medullary carcinoma (MC; Fig. 1D); (4) tubular carcinoma (TC; Fig. 1E); (5) mucinous carcinoma (MuC; Fig. 1F); and (6) inflammatory breast carcinoma (IBC; Fig. 1G). An image of healthy breast tissue (Fig. 1H) is given for comparison.
IDC is the most common type of all breast carcinomas, accounting for 70%–80%.4,5 The cells are often small and structurally similar, or can be large and varying in size and shape (pleomorphic). The tumor masses formed by IDCs are usually multinodular or stellate (star-like).4–6 The non-invasive form of ductal carcinoma is known as ‘ductal carcinoma in situ’ (DCIS), which is confined within the secretory ducts. ILCs (8%–14%)4,5 are the second most common type of breast cancer followed by MCs (7%). 4 ILC is characterized by small, round cells forming single files and breaking into the connective tissue. They often do not form well-defined masses that can be diagnosed easily by physical examination or mammography, making early diagnosis difficult.5,7 MCs form a nearly spherical mass of lymphocytes and poorly differentiated epithelial cells.6,8 Less common types of breast cancer include tubular (TC), MuC and IBC. The mass of a TC is small is typically stellate; it is characterized by low grade tube-shaped cells. 9 MuCs are characterized by uniform neoplastic cells arranged in clusters seemingly “floating” in a large amount of mucin, produced by the cells. The mucus and carcinoma cells form a jelly-like tumor. There are two subtypes of MuCs: mucinous A (MuC-A) and mucinous B (MuC-B). MuC-As are hypocellular while MuC-Bs are hypercellular. 10 Inflammatory breast cancer is aggressive and the cells often block the lymphangioles of the breast, causing macroscopic reddening and swelling of the whole organ, as well as a classical ‘peau d'orange’ effect on the skin. The prognosis for this aggressive form of cancer is poor. 11
MR characteristics of any tissue will depend on the histology, and this will be true for the various specific types of breast cancer. For example, Figure 1A and B are photomicrographs of IDC; the extent of fibrosis, cell density and tumor vasculature varies considerably across the tumor and between tumors, thus leading to a range of patterns on contrast enhanced MR images.
12
Knopp et al
13
noted a more rapid enhancement and elimination of contrast agent in contrast-enhanced magnetic resonance imaging (MRI) in IDC compared to ILC. This is because IDC tends to have a higher proliferative activity while ILC (Fig. 1C) is typified by diffuse infiltrative growth and does not exhibit extensive neovascularization, resulting in poor MRI enhancement.
13
MC tends to have high signal intensity on T2-weighted images with a heterogeneous distribution of contrast enhancement due to the particular architecture (Fig. 1D) of the tumor.
14
For small TCs (Fig. 1E) on MRI, the presence of spicules in the images is pathognomonic of this type of cancer. The spicules are the stroma that extend out of the tumor and are lined by neoplastic cells. Small lesions have Type I kinetic wash out curves for the contrast agent (steady enhancement) in dynamic contrast enhancement MRI (DCE-MRI) and can show low-density enhancement. However, larger lesions tend to contain hyper-enhancing areas in DCE-MRI images and Type III kinetic curves (indicating washout of signal intensity). This is because of the increased vasculature of the tumor. Figure 2 illustrates the characteristics of the various types of kinetic curves. Figure 1F is a photomicrograph of an MuC; the abundant mucin is evident in the optical image. The mucin has a variable protein concentration and because of its high water content it has dramatically prolonged T1 values of the water; T1-weighted MRI signal intensity is enhanced. High signal intensity in T2-weighted images, compared to those from other histological types of IDC, is predicted to be a result of the large amount of mucin present.15,16 For this particular type of cancer, the signal-intensity versus time curves in DCE-MRI are characterized by a Type I kinetic curve that is likely to be from the high extracellular volume fraction in these malignant tumors.16,17 Figure 1G shows the extensive infiltration of inflammatory cells in IBC. This cancer is typically associated with thickening of the overlying skin as can often be seen on MRI images; and this radiological sign constitutes a marker for diagnosing IBC. The abnormal skin also typically has a large water signal.
18
Diffuse signal enhancement is expected for this type of cancer as the associated inflammation has related edema; this is evident in the photomicrograph as ‘separation artifacts’ in the tissue slice.
Illustration of the different types of kinetic curves from DCE MRI.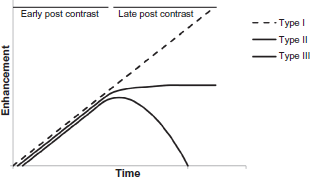
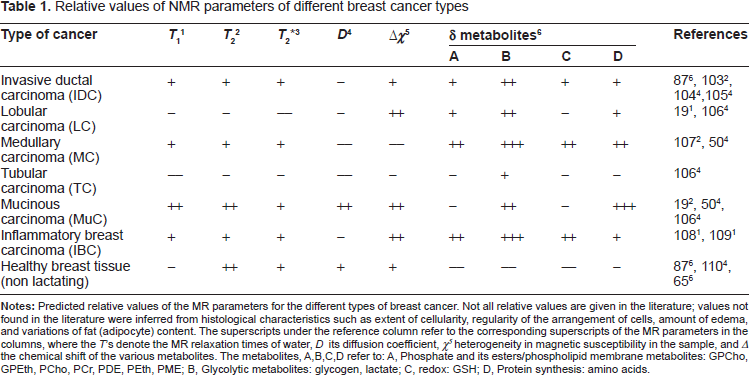
Relative values of NMR parameters of different breast cancer types
In order to “metrify” the digital images in Figure 1 we generated red, blue and green pixel intensity histograms, and the results are given in Figure 3. The color in each pixel of the image is formed by an additive color model consisting of ‘red’, ‘green’ and ‘blue’. The x-axis ranges from 0 to 256 with 0 denoting pure black and 256 denoting pure red, green or blue. The y-axis indicates the number of times that a particular value of red, green or blue has occurred in the image when traversing from left to right and top to bottom. There were substantial qualitative differences in the histograms of the different types of cancer; this implies that further research into this method could be very rewarding. The analysis of pixel intensity was carried out on the histological images of the various types of breast cancer and characteristic shapes of the color-histograms were very striking. Thus, correlations of the pixel intensity histograms and breast cancer types warrant further study as a potential diagnostic methodology. However, in the present context, the metrification was used to correlate the images with MR analysis of the corresponding cancer types.
Analyses of the red, blue, and green pixel intensities in the different breast cancer types for the microphotographs provided by National University Hospital, Singapore: 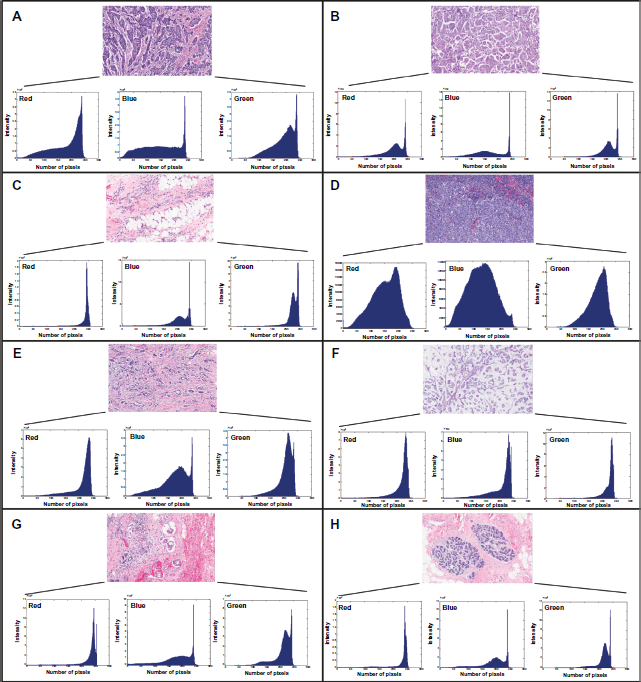
In addition to histological metrification, a variety of biomarkers (biochemicals/metabolites) can also be assessed in cancers. The biomarkers provide a means of conferring a more convincing diagnosis, monitoring treatment, and potentially aiding the design of a treatment plan. Table 1 in Appendix 2 describes the various major biomarkers and their clinical uses; we do not discuss these particular biomarkers here. And for reviews of biomarkers and diagnosis and treatments see Weigel et al, 20 Dowsett et al, 21 and Vivanco et al. 22
In screening for breast cancer, x-ray mammography (MMG) has been the technique of choice for several decades. Women at high risk of hereditary breast cancer are recommended to have a semi-annual clinical examination (palpation) and an annual mammogram beginning between the ages of 25–35 years.23,24 Mammography is a diagnostically limited technique as it does not provide sufficiently detailed information, such as vascularity, especially when breast tissue is dense. However, MMG can detect microcalcifications that MRI cannot readily reveal, and the images provide important indicators for cancer.
Over the past 10 years, increased research efforts have helped to establish breast MRI as an important tool for the detection and characterization of breast cancer, especially for naturally dense breast tissue. 25 Although MRI has a very high sensitivity for detecting tissue pathology, it suffers from low specificity that also depends on the protocol used (pulse sequences) and the level of experience of the technician using it. This results in the need to perform significantly more biopsies of lesions after MRI scanning than for MMG.25,26 Nevertheless, Van Goethem et al, in reviewing more than 80 papers concluded that MR mammography has the highest sensitivity to detect IDC (Fig. 1A). 25 Thus, MR is an excellent tool for determining tumor extent and is likely to benefit women with dense breast tissue. 27
MRI and magnetic resonance spectroscopy (MRS) can be used for early detection of breast lesions and then both MR and MMG can be used to follow responses to treatment. Health-planning and clinical analysis of whether MRI is more beneficial for women at high risk is influenced by a concern with high cost. Figure 2 in Appendix 3 shows the trends of research in the diagnosis of breast cancer over the past 10 years. The heightened global awareness of breast cancer has increased research efforts for early detection and monitoring breast cancers using many new physical methods such as biophotonics, but the most mature technologies are MRI and MRS.
Detection of Breast Cancer by MRI/MRS
DCE-MRI
This is most commonly used for diagnosing and assessing progression of breast lesions and has shown great promise in differentiating between malignant and benign tumors. It can also be used to monitor neovascularization of tumors and this can be further quantified using pharmacokinetic modeling of tracer distributions.28–30 In the past, the specificity of DCE-MRI ranged from 37%–91%.31,32 This has not improved significantly in recent years and the specificity continues to range widely due to varying criteria used to differentiate between benign and malignant tumors. 33 Lipnick et al 34 improved the specificity for diagnosis by combining DCE-MRI and 2-dimensional (2D) MRS. However, the protocol is protracted and more work is required to validate it for breast cancer detection. 34 Diffusion weighted (DW)-MRI can also be used to differentiate between malignant and benign lesions.35,36 Response to treatment can be evaluated by studying vascular density or vascular permeability as well as tumor size and water-signal enhancement. The apparent diffusion coefficient (ADC) of tissue water that is associated with changes in tissue and intracellular structure (plasma membrane permeability) can be measured by using DW-MRI.29,37–39
DCE-MRI (introduced above) provides information on changes in vascularity, vascular permeability and the relative volume of the extracellular space.40,41 It involves the rapid acquisition of images before, during, and after the injection of a contrast agent (CA); such agents increase the contrast between different tissues by altering the relaxation times, T1 and T2. 41 The most common MRI CAs are gadolinium based chelates. 42 To analyze the relaxation data in clinical studies and trials, semi-quantitative measures are commonly used; these are typically the ‘maximum change in image intensity’ (slope of the wash out curve), and the initial area under the curve (AUC) of contrast agent concentration versus time as it is washed out of the system. 43 These methods reflect the tracer kinetics of the blood exchange rather than the cell-physiological parameters like membrane transport. Another method that is more complicated and provides information on cell-physiological parameters is kinetic modeling. There are several model-based methods as well as model-free algorithms that are used, and several empirical quantification methods involving enhancement patterns that include the two measurements noted above.44,45 For parametric contrast-enhanced imaging, a mathematical model is used to relate the kinetic changes in signal intensity in the presence of the contrast agent to the values of the kinetic and relaxation parameters that describe the tissue properties. However, the various models provide overall estimates of many interrelated parameters. Empirical-parametric methods are not standardized and vary for different experimental protocols. 46 Specifically, Kelcz et al 46 performed a clinical test of a high-spatial-resolution parametric method for detecting breast lesions using DCE-MRI. They did this to establish standards for diagnostic breast MRI protocols. In their study, 57 women with 45 masses and 23 clusters of micro-calcifications were imaged. Three images were obtained at various times; one unenhanced image was followed by two CE images. Parametric maps were generated and the sensitivity and specificity for the 45 solid lesions were found to be 96% and 82%, respectively. In the kinetic modeling case, it is noted that there was greater variability as not only the mathematical modeling affected the results but also the choice of arterial input rate and volume. Overall, this method provides valuable information on physiological changes in the tumor that the AUC method does not.
Although DCE-MRI has the potential to detect breast cancer it can only be performed on patients without kidney disease or known reactions to contrast agents; these factors limit the number of patients who can undergo the investigation, 29 and it is costly. Nevertheless, it is currently the standard method for high-risk patients as recommended by the American College of Radiology. 47
DW-MRI
This is used to detect and differentiate between benign and malignant breast tumors.35,36,48,49 As the properties of malignant breast tissues vary between benign and healthy tumors, the ADC can predict the presence of cancer. 37 Images and pulse sequences employing gradients of different durations and amplitudes are acquired along with various diffusion times; thus the ADC can be estimated in vivo. The ADC informs on the characteristics of diffusion within tissues of interest, 43 such as the extent to which there is ‘restricted’ or ‘anisotropic’ diffusion. Typically, the measured ADC reflects water diffusion in the extracellular space. Short diffusion paths are encountered when extracellular water molecules are hindered by structural interfaces such as in a highly cellular region of tissue. Thus correlations between the ADC values, tumor cellularity and tumor grade have been studied. 43
Differences in ADC values can be rationalized on the basis of the relative openness of tissue structures (see Fig. 1). ADC values are expected to be high in mucinous MuC due to the high water content of the extracellular mucin. Hatakenaka et al 50 studied the ADC of various breast tumors including MuC; significant differences were seen in different types of breast cancer compared with that of fibroadenoma that was slow at 1.7 ± 0.3 (SD) × 10-3 mm2 s-1. The mean ADC of MuC was 2.11 ± 0.18 × 10⁻³ mm2 s-1. Woodhams et al 51 reported a mean ADC value of 1.8 ± 0.3 × 10⁻³ mm2 s-1 for pure MuC while for MC, a lower ADC value is expected due to its higher cellularity and accordingly Hatakenaka et al 50 report a mean ADC value of 0.94 ± 0.15 × 10⁻³ mm2 s-1. The mean ADC value estimated by Woodhams et al 52 for LC (among others) was 1.07 ± 0.26 × 10⁻³ mm2 s-1. The lower ADC value might be predicted from the appearances of tissue sections in Figure 1 because of the higher cellularity of this type of breast cancer. The mean ADC value of TC (of 43 carcinomas) reported by Woodhams et al 52 was relatively low at 1.16 ± 0.26 × 10⁻³ mm2 s-1; although, no ADC values were determined for IBC, they are predicted be higher due to the large amount of interstitial watery edema.
In clinical practice, most DW studies are adjuncts to DCE-MRI. Changes in ADC that indicate proliferative cell activity are often recorded from regions of increased vascularity in DCE-MRI images. A combination of DW and DCE-MRI increases the specificity for detecting breast cancer with MRI.33,53,54 Yabuuchi et al 53 evaluated the benefit of combining DCE-MRI with DW-MRI thus increasing the specificity of MRI for breast-cancer detection in “non mass like” image enhancements. In their study of 45 lesions, significant indicators of MR malignancy were ‘segmental distribution’, ‘clumped internal enhancement’, and ADC values less than 1.3 × 10⁻³ mm2 s-1. In the validation study of 22 non mass-like image ‘enhancements’, the authors recorded 87% sensitivity and 86% specificity. Kul et al 33 recorded with DCE-MRI alone a specificity of 75.7% (97.9% sensitivity); and combined with DW-MRI a specificity of 89.2% without sacrificing sensitivity (95.7% sensitivity). Partridge et al 54 combined DW-MRI with DCE-MRI wash-out kinetics with strong indications that their method improved accuracy of making the diagnosis. The authors are in agreement that the combination of DW and DCE-MRI increases the specificity for detection.
In a recent study, Sharma et al 55 show the potential of using ADC values to identify viable tumor areas for voxel positioning in MRS without DCE-MRI data being available. The authors used ADC values to differentiate between necrotic and viable tumor regions in breast cancer patients. The ADC values of the necrotic regions were significantly higher than the regions of viable tumor. The authors attribute the lower ADC values in viable tumor tissue to the high cellularity of the highly proliferative regions, thus reducing water volume in the extracellular space, resulting in a decrease in the rate of diffusion of water. This study shows promise for using ADC values from MRS measurements without relying on DCE-MRI data.
There are pros and cons for the use of DW and ADC values in characterizing breast lesions. Detection of small tumors is limited because of the low geometrical resolution of MRI. DW-MRI requires echo-planar imaging (EPI) that places high demands on the performance of magnetic field gradient amplifiers, including the uniformity of the field gradients. However, EPI enables short imaging times so DW-MRI images can be obtained rapidly.
MRS
MRS provides biochemical information about tumor metabolism, which can potentially be used along with the tumor nodes metastasis (TNM) staging system (see Appendix 3) and monitoring responses to treatment.4,56,57 MRS studies of breast cancer typically use 31 P and 1 H MRS. With 1 H MRS, total choline (including free choline, its mono-phosphate ester and phosphodiesters; denoted by tCho) has been the most commonly assessed group of metabolites4,25,58–62; they are readily detected even at low concentrations because of the high intensity signal from the quaternary ammonium –N+(CH3)3 of the choline moiety with its nine equivalent 1 H-atoms. The water-to-fat (W-F) ratio is another characteristic that has been explored for cancer diagnosis, but it is less sensitive than using tCho. 63 For 31 P MRS studies, resonances from the phosphate esters of metabolites are prominent; these are nucleoside phosphates (NTP), inorganic phosphate (Pi), and phosphocreatine (PCr). The activity of lipid metabolism can be inferred from the steady-state concentrations of phosphomonoesters (PMEs) and phosphodiesters (PDEs). The PME peaks are readily assigned to phosphoethanolamine (PEth) and phosphocholine (PCho), while the PDE peaks are assigned to glycerophosphoethanolamine (GPEth), glycerophosphocholine (GPCho). Therefore these metabolites have been used to monitor tumor responses in neoadjuvant chemotherapy.4,64–66 This has been done by using the tCho signal intensity and the W-F ratio from 1 H MRS, while the phosphorus metabolites of cellular metabolism have been estimated, although less precisely, via 31 P MRS.
Choline
The 1 H MRS signal-envelope from tCho has a peak maximum at ~3.2 ppm; as noted above the related molecules include choline, PCho, and GPCho. 59 Some resonances from ethanolamine, PEth and GPEth also contribute to the envelope of signals because the protons of the –CH2-groups are neighbors of the amine groups at ~3.2 ppm. In addition, resonances from taurine contribute to the tCho envelope in low resolution 1 H spectra. 67 Higher tCho concentrations are correlated with the size of the tumor and negatively correlated with the age of the patient, since younger patients tend have more aggressive cancers.4,60
The specificity and sensitivity for choline detection has been reported to be 0.92. 68 Regarding specificity, false negatives have been reported in several studies including those of Chen et al, Jagannathan, and Sardanelli et al.59,60,68–71 Failure to detect choline in some breast cancers has been attributed to patient motion, contamination by hemorrhage, and inclusion of lipids interspersed with stromal and inflammatory cells. Yeung et al 72 conducted 1 H MRS in contrast-enhanced breast lesions for choline detection and reported a significant choline resonance in IDC. A high resolution magic angle 1 H MR spectrum of IDC is presented in Figure 1A by Cheng et al. 73 More work is required to determine the biological factors that affect choline detectability for characterizing breast cancer by 1 H MRS. 60
Choline-family resonances have been detected in some benign tumors as well as in normal breast tissue; and attempts have been made towards the accurate quantification of choline for differentiating between benign and malignant tumors. 74 Baik et al 75 suggest that using the ‘fully-relaxed’ water resonance as an internal intensity reference increases the specificity of 1 H MRS. Thus, choline concentration is calculated by comparing the choline and water peak integrals and correcting for differences in relaxation times of the two molecular species. A study of breast in vivo using 1 H MRS at 1.5 T by Bolan et al 74 involved 45 patients with biopsy-confirmed breast cancer. Absolute quantification of choline concentrations was made for the malignant tumors. The relaxation times of water and total choline in malignant breast tumors in four patients were measured and the absolute choline concentrations were estimated to be from 0.76–21.20 mmol kg-1, from 34 spectra. In a recent study, Dorrius et al 55 also showed that choline is a good discriminator between benign and malignant breast lesions. Other 1 H MRS studies have used an external reference (‘phantom’) of known concentration for absolute quantification of choline in vivo.69,76
Water-fat (W-F) Ratio by 1 H MRS
Sijens et al 77 were the first to report that the W-F ratio estimated by using a surface coil was higher in breast cancer patients than in healthy volunteers. Normal breast tissue has relatively high fat content while malignant tissue that is mostly derived from glandular tissue has higher water content (see Fig. 1A–H). This was confirmed in single-voxel spectroscopy63,78 with similar findings for the W-F ratio. The W-F ratio is calculated by using the peak areas of water at δ = 4.7 ppm and the major lipid peak area at δ = 1.33 ppm.63,78 Thomas et al 79 also report that differences in lipid content can be seen during tumor development and the value depends on the size of the neoplasm. However, the W-F ratio cannot be used to differentiate between malignant and benign tumors; it does not differ significantly between the two.
PME/PDE by 31 P MRS
In malignant breast tissue, the PMEs and PDEs have higher concentrations than in healthy tissue. 4 Park et al 65 quantified the various phosphorus metabolites, PME, PME/PCr, PDE/PCr, total adenosine triphosphate(tATP)/PCr, and PCr/tATP, in benign, malignant and healthy breast tissue. Their study included three groups: (1) 17 patients with untreated primary malignant breast cancers; (2) 8 with untreated benign breast tumors; and (3) 7 with healthy breasts. Only PME and PME/PCr were significantly different between malignant and healthy tissues, and were not significantly different between the malignant and benign lesions. In hindsight, PCr concentrations were measured in the chest-wall muscle rather than the glandular tissue, resulting in a questionable significance of the PME/PCr ratio.
The tATP signal is lower in healthy tissue than in benign tumors, and other studies have confirmed that 31 P MRS is capable of differentiating between benign and malignant neoplasms.64,80 Variations in the conclusions from these reports are probably due to instrument-calibration artifacts, variable sensitivity of surface RF coils, as well as imperfect analysis of the phosphorus-containing metabolites due to a low signal-to-noise ratio. 81 Overall, 31 P MR with today's clinical MRI scanner technology is still not sufficiently sensitive for routine breast cancer diagnosis.
PCho
PCho is a valuable biomarker in breast cancer diagnosis as 10-fold higher concentrations occur relative to normal breast tissue.82,83 The largest contributor to the 31 P MR tCho peak in breast tissue is PCho (free choline that lacks a 31 P atom is not observable) so it is a useful biomarker for breast cancer diagnosis. Normal mammary epithelial cells, primary tumor cell lines, and a metastatic cell line from a single patient have been studied. The PCho concentrations were increased by 16- to 19-fold and 27-fold, respectively, in the primary tumor lines and metastatic cells compared to normal epithelial cells. Eliyahu et al 84 also showed that PCho is 5- to 17-fold higher than normal mammary epithelial cells. The higher concentrations of PCho in breast cancer cells imply enhanced choline kinase activity in cancer cells as well as probable increased choline transport into the cells.
High resolution magic angle spinning MR has been used to study biopsies of many breast cancers 85 : glycine concentrations tend to be lower in patients who have a good prognosis and are higher in patients with a poor prognosis, as judged clinically. High resolution magic angle spinning MR has been used to investigate IDC. 86 Tumor grades correlate with the relative intensities of PCho/Cho and lactate (Lac)/Cho, with a significant increase in Lac/Cho ratio from Grade II to Grade III IDC. 89 Leibfritz et al 87 studied the metabolites present in various breast cancers, including IDC and reported that the metabolic profiles in the NMR spectra vary considerably. In a spectrum from healthy tissue there is a higher content of adipocytes decreasing the number of water-soluble metabolites compared to malignant tissue, thus making the metabolites relatively more abundant. A marked increase in PCho signal in cancerous tissue was observed in all three studies.88–90
Responses to Neoadjuvant Chemotherapy by MRI/MRS
Neoadjuvant chemotherapy is increasingly used with patients who have operable breast cancer and who require complementary therapy. 88 Imaging techniques that provide information on the response to treatment are of great importance in this context, in addition to physical examination. The original criteria for assessing solid tumor response to therapy were developed in 1981 by the World Health Organization (WHO). 42 The current standard method of response-evaluation in solid tumors (RECIST) uses 1-D measurements with x-rays, ultrasound, x-ray-computed tomography (CT), and/or MRI. The lesions identified on a scan are measured along their greatest dimension and the corresponding perpendicular short axis. For lymph node lesions, the short axis is used as the ‘composite tumor burden score’ and for ‘non-lymph node lesions’ the long axis is used; these measurements are then added to give the baseline sum diameters (BSDs). The fractional change in BSDs is used to classify responses to treatment into the following categories: (1) complete response (CR); (2) partial response (PR); (3) progressive disease (PD); and (4) stable disease (SD). Complete response is defined as the disappearance of the lesion, while partial response is defined as more than a 30% decrease in BSDs. Progressive disease is defined as more than 20% increase in the BSD or the appearance of new lesions. While stable disease is defined as changes that do not fall into one of the above three categories. 42
Water-fat ratio by 1 H MRS–-therapy responses
The W-F ratio estimated from 1 H MR spectra is high in breast tumors but low in the normal breast. 77 Jagannathan 78 and colleagues studied 44 patients with IDC (Fig. 1A). The spectrum of healthy tissue is dominated by resonances from fat while in the malignant breast the water resonance dominates. The W-F ratio was 6.0 ± 6.9 and a post-chemotherapy one of 1.3 ± 1.5. Tumor regression can be verified with mammography and clinical examination. These findings posited the use of the W-F ratio in assessing outcomes in neoadjuvant chemotherapy, and this was verified in a later study.28,63 Although the W-F ratio is prognostic of tumor response, many researchers are now focusing on measurements of choline-containing compounds using water-suppressed 1 H MRS, as choline is a more sensitive marker of cancer aggressiveness (see above). The reluctance to use the W-F ratio for assessing tumor response could be because it depends strongly on which region of normal breast tissue is selected as the control.
Choline 1 H MRS–-therapy responses
As concluded above, there is considerable potential for using the tCho signal intensity and tumor volume to assess tumor response in neoadjuvant chemotherapy. Several groups report no tCho or significantly reduced tCho in those patients on chemotherapy who have a “good response”; this was evidenced by clinical and histopathological evaluation.59,62,63,89,90 In the study by Tozaki, et al, 91 tumor response to chemotherapy after the second cycle was studied in 16 patients (8 pathological responders and 8 non-responders) with breast cancer. The normalized tCho signal ranged from 0.40 to 2.8 and a significant decrease in the signal occurred, with its total disappearance in 6 cases. Overall, it is concluded that the change in tCho signal is more sensitive than changes in tumor volume for detecting a positive therapeutic response. 92 Hence, changes in tCho signal provides a means of assessing response to neoadjuvant chemotherapy. This is an incredibly encouraging finding and deserves immediate further study.
PME/PDE 31 P MRS–-therapy responses
In human breast tumors, large signals from PME and PDE are present in the 31 P MRS spectra (see above). 4 PME and PDE peaks are not only present but they are of much greater intensity in spectra from breast tumors than normal breast tissue. According to Leach et al, 4 a decrease in PME correlates with a stable or responding disease, while an increase in PME occurs with progressive disease (as classified by the WHO criteria; see Appendix 2). The PME peak in spectra from lactating breast is increased relative to non-lactating pre-menopausal breast. 92 In an early study by Glaholm et al, 93 a significant reduction in PME occurred after chemotherapy in a patient with locally advanced carcinoma of the breast; this suggested that PME concentrations may be used to monitor tumor regression. In a later study by Redmond et al, 66 pre- and post-chemotherapy 31 P MRS signals were recorded from 16 patients with large cancers. Peak areas and ratios of 31 P metabolite peaks were estimated. A clinically assessed “good response” to chemotherapy was correlated with decreases in PME, PME/PDE, PME/PCr, PME/NTP, PDE/PCr and tumor pH, as well as increases in the ratios of Pi/PME and Pi/PDE. It was also noted that the ratio Pi/PME shows potential for separating partial responders from complete responders; a higher initial Pi/PME ratio is observed in complete responders compared with partial responders. The authors conclude that 31 P MRS is potentially useful for monitoring responses to chemotherapy but there is as yet a lack of routine clinical application.
DW-MRI–-therapy responses
The mean ADC estimated with DW-MRI can be used as another means of monitoring the response of patients to neoadjuvant chemotherapy (see above);37,94,95 it is especially useful in assessing early responses. Pickles et al 96 showed that changes in ADC precede tumor size reduction after neoadjuvant treatment; changes are seen as early as after the first cycle of chemotherapy. This was confirmed by Sharma et al 38 : measurements were made of mean ADC values on four occasions on 56 patients with locally advanced breast cancer. ADC values were also measured in 10 benign tumors and 15 normal breasts in volunteers. The fractional change in ADC, as well as the tumor volume and diameter, were measured after each cycle of chemotherapy. Significant increases in ADC values occurred after the first cycle of chemotherapy compared with changes in tumor volume and main diameter. The sensitivity and specificity of ADC to detect responders was 68% and 100%, respectively. The sensitivity to detect responders using tumor volume and diameter were both 89%; and the specificity was 50% for volume, and 70% for diameter. From these results, it is concluded that DW is promising for predicting therapeutic responses in breast cancer patients.
DCE-MRI–-therapy responses
DCE-MRI has been used to record physiological and morphological changes during neoadjuvant chemotherapy in breast tumors. 97 As noted above, Pickles and colleagues 98 reported that DCE-MRI differentiates responders from non-responders early in chemotherapy. The kinetic parameters, transfer constant (ktrans), and rate constant (kep), were estimated by using a two compartment pharmacokinetic model. The transfer constant reflects tumor-blood-vessel flow and permeability, while the rate constant is that of contrast agent efflux from the extracellular extravascular space back into the blood compartment. Although the authors report a significant decrease in the kinetic parameters ktrans and kep for responders compared to non-responders in early treatment, they observed that the fractional change in volume of the breast tumor was the most significant outcome. However, they attributed this to acquiring the early treatment time point too late in the study. Nevertheless, these results confirmed those of their previous study. 99
Martincich et al 99 conducted DCE-MRI studies on 30 patients with breast cancer who were receiving primary chemotherapy. Images were acquired before chemotherapy, after two cycles, and after four cycles of treatment. A reduction in the early enhancement ratio (ECU) after two cycles of chemotherapy correlated with tumor regression; and the reduction of tumor volume was the most significant change.
Ah-See et al 100 applied both DCE-MRI and dynamic susceptibility MRI (DSC-MRI) to assess tumor response to chemotherapy. They concluded that the value of ktrans (see above) was the “best” predictor of tumor regression, while changes in tumor size did not predict histo-pathological changes. Controversy between the value of the peak enhancement and its correlation to treatment response is evident: while some authors suggest that a low initial value predicts good treatment response, 101 others conclude the opposite. 102 Although DCE-MRI shows considerable potential for monitoring responses to chemotherapy, further work in larger patient populations with appropriate validation of outcomes are needed to guide the establishment of clinical protocols.
Conclusions
Global breast cancer incidence has increased significantly in the past 10 years. Clinical attention has turned to early detection and monitoring early responses to chemotherapy. Both MRI and MRS are used as tools for detecting and monitoring cancer responses to chemotherapy. Future developments in MRI and MRS described above will speed up diagnostic breast cancer imaging and spectroscopy. However, much more work is required to lead to standardized protocols for various MRI methods, especially for detecting the rarer types of breast cancer. With further technical advances including the use of higher magnetic fields, many of these techniques such as MRS will replace current routine ones for detection and monitoring breast cancer. There is also the need to consider the cost-effectiveness of the MR-based methods of imaging relative to the older x-ray and newer PET-based methods. Because this review focuses on MR methods, the comparisons could be of interest to clinical planners but they are not “scientific” per se, so they are given in Appendix 4.
Funding Sources
This review was part of a project funded by an intramural grant in the SBIC.
Competing Interests
Author(s) disclose no potential conflicts of interest.
Author Contributions
Conceived and designed the literature review, histology, and image analysis: RMM, HPN, TCP, PWK. Analyzed the histological-image data: RMM, HPN. Wrote the first draft of the manuscript: RMM, PWK. Contributed to the writing of the manuscript: RMM, HPN, TCP, PWK. Agree with manuscript results and conclusions: RMM, HPN, TCP, PWK. Jointly developed the structure and arguments for the paper: RMM, PWK. Made critical revisions and approved final version: RMM, PWK. All authors reviewed and approved of the final manuscript.
Footnotes
Appendices
Acknowledgements
This review is part of emerging engagement with the development of diagnostic techniques that use molecular imaging, in the SBIC.
As a requirement of publication author(s) have provided to the publisher signed confirmation of compliance with legal and ethical obligations including but not limited to the following: authorship and contributorship, conflicts of interest, privacy and confidentiality and (where applicable) protection of human and animal research subjects. The authors have read and confirmed their agreement with the ICMJE authorship and conflict of interest criteria. The authors have also confirmed that this article is unique and not under consideration or published in any other publication, and that they have permission from rights holders to reproduce any copyrighted material. Any disclosures are made in this section. The external blind peer reviewers report no conflicts of interest. Provenance: the authors were invited to submit this paper.