
Abstract
We examined whether serum from obese, compared to non-obese, PCa (prostate cancer) patients creates a growth-enhancing tumor micro-environment in vitro. Serum from 80 subjects was divided into four groups: normal weight men with and without PCa and overweight/obese men with and without PCa. Cell proliferation, migration, and invasion were measured in LNCaP, and PC3 cells treated with patient serum were obtained from the above groups. The results reveal that proliferation of LNCaP cells was significantly (P = 0.05) greater with serum from non-obese (mean = 1.26 ± 0.20) compared to that from obese patients (mean = 1.16 ± 0.19). Serum from obese PCa patients compared to non-obese PCa patients induced significantly greater amounts of cell migration (P < 0.01) in PC3 cells. Serum from obese patients induced significantly (P < 0.01) lower amounts of cell invasion (mean = 8.2 ± 4.5) compared to non-obese patients (mean = 18.1 ± 5.0) when treated on PC3 cells. Serum TNF-α (tumor necrosis factor alpha) levels correlated with LNCaP cell proliferation in vitro in non-obese PCa (P < 0.01) and non-obese control groups (P = 0.05). All statistical calculations controlled for age, since the PCa patient groups were significantly older than the control groups (P < 0.01). In conclusion, serum from obese PCa patients induced greater PCa cell migration and lower cell proliferation and invasion in vitro.
Introduction
Overweight and obesity have been associated with numerous comorbidities, including T2D (Type 2 diabetes), CVD (cardiovascular disease), and various cancers. 1 A 5 kg/m2 increase in BMI (body mass index) has been shown to be associated with an increased incidence of esophageal, thyroid, colon, renal, endometrial, and gallbladder cancer. 2 The impact of obesity on the incidence of PCa (prostate cancer) is more complex. A recent meta-analysis indicates that BMI is inversely associated with the risk of localized PCa and directly associated with the risk of advanced PCa. 3 Another meta-analysis indicated that increased BMI was associated with an elevated risk of PCa-specific mortality and BCR (biochemical recurrence) following primary treatment. 4 Detection biases may obfuscate the relationship between obesity and PCa. Obese men have hemodilution-related decreased PSA (prostate-specific antigen) serum levels. 5 The predictive value of an abnormal DRE (digital rectal examination) in PCa detection appears to be modified by obesity. 6 Moreover, obesity-driven prostate enlargement may reduce prostate biopsy efficiency and the ability to differentiate benign disease from PCa. 7 In addition to detection biases, the paradoxical relationship between obesity and PCa may in part be explained by biological mechanisms. For instance, obese patients have depressed T (testosterone) levels and upregulation of aromatase. 8 There is also an increased incidence of diabetes in obese men, and diabetes has been shown to be inversely associated with PCa. 9
In light of the complicated relationship between obesity and PCa, it is important to examine the direct impact of obesity on PCa cell biology. The present study utilized serum from obese and non-obese PCa patients for the treatment of PCa cell lines in vitro, in an effort to characterize the direct biological effects of obesity on PCa progression. By studying the interaction between obesity-related serum-born factors on PCa cells in vitro, extraneous, detection-bias-related confounding factors plaguing clinical studies can be minimized. We hypothesize that human PCa cells in vitro treated with serum from obese PCa patients will exhibit elevated levels of proliferation, migration, and/or invasion in vitro, compared to non-obese PCa patients.
Materials and Methods
Patient serum samples
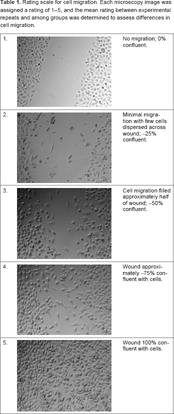
Rating scale for cell migration. Each microscopy image was assigned a rating of 1–5, and the mean rating between experimental repeats and among groups was determined to assess differences in cell migration.
Cytokine measurement
The following cytokines were assayed using Milliplex kits, obtained from Millipore: IL-6 (interleukin-6), TNF-α (tumor necrosis factor alpha), MCP-1 (monocyte chemoattractant protein-1), HGF (hepatocyte growth factor), NGF (nerve growth factor), and resistin. Cytokine analysis was conducted at the microarray facility at Princess Margaret Hospital.
Cell culture
Human PCa cell lines LNCaP and PC3 were obtained from the American Type Culture Collection and cultured at 37°C in a 5% CO2 incubator. LNCaP cells were maintained in RPMI 1640 medium (Invitrogen) supplemented with 10% fetal bovine serum (Sigma), 0.3 mg mL-1 l-glutamine, and 100 IU mL-1 penicillin and 100 μg mL-1 streptomycin (Invitrogen). PC3 cells were maintained in Dulbecco's minimal essential medium/F12 (Invitrogen) with 10% fetal bovine serum, 0.3 mg mL-1 l-glutamine, and 100 IU mL-1 penicillin and 100 μg mL-1 streptomycin.
Cell proliferation assay
LNCaP (1 × 10 4 cells/well) and PC3 (1 × 10 4 cells/well) cells were seeded in 96-well plates and allowed to grow in fetal bovine serum (FBS) (10%) for 48 hours at 37°C prior to patient serum treatment. After the attachment, cells were incubated with patient serum (10%) for 24 hours at 37°C (at which time the effects on cell proliferation were most pronounced). After the treatment period, CellTiter96® AQueous Non-Radioactive Cell Proliferation Assay [3-(4,5-dimethylthiazol-2-yl)-5-(3-carboxymethoxyphenyl)-2-(4-sulfophenyl)-2H-tetrazolium] (MTS), obtained from Promega, was used to determine cell proliferation by adding 20 μL MTS reagent for 2 hours at 37°C. Absorbance at 490 nm was measured by a plate reader. Patient serum was treated in triplicate wells, and each experiment was repeated three times.
Matrigel invasion assay
The effect of patient serum on PC3 cell invasion was determined using 8.0 μm BD BioCoat™ Matrigel™ Invasion Chamber, obtained from BD Biosciences. PC3 (1 × 10 5 cells/well) cells were seeded into the upper chamber/insert, using 12-well plates, and cultured for 24 hours at 37°C. Patient serum (5%) was added into the bottom wells as a chemoattractant. After 24 hours, the non-migrating cells were removed from the upper chamber with a cotton swab. The inserts were fixed with methanol and stained with 0.1% crystal violet solution. The number of migrated cells was quantified by counting the stained cells (cells per four fields) with a microscope. Patient serum was treated in duplicate wells, and each experiment was repeated three times.
Wound-healing (scratch) assay
The effect of serum on cell migration was assessed in PC3 cells using a wound-healing assay. PC3 cells were cultured in a 24-well plate for 24 hours at 1.0 × 10 6 cells/well to reach 100% confluence. A vertical scratch across the well was made with a 10-μL pipette tip, followed by two washes with phosphate buffered saline (PBS). PC3 cell media supplemented with 5% patient serum was then added to each well for 24 hours. Microscopy images were taken at 0 and 24 hours to visually assess cell migration. Each patient serum sample was added in duplicate wells, and each experiment was repeated twice. Owing to a large amount of variation in thickness along the wound border, we devised a general rating scale in order to grade the microscopy images of cell migration and arrive at an average score (between 1 and 5 or 0, 25, 50, 75, or 100% migration) from the duplicates and repeats (Table 1).
Statistics
All analyses were conducted using SPSS version 20. Differences in cytokine levels between groups were analyzed by one-way analysis of variance, and multiple comparisons were corrected post hoc with Bonferroni correction. Univariate analysis of variance was used to analyze differences between groups in terms of proliferation, migration, and invasion. All statistical analyses controlled for age differences among the groups. Associations were considered significant at P ≤ 0.05.
Results
Description of study participants
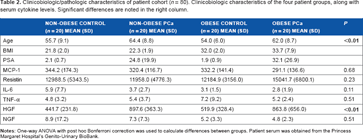
Clinicobiologic/pathologic characteristics of patient cohort (n = 80). Clinicobiologic characteristics of the four patient groups, along with serum cytokine levels. Significant differences are noted in the right column.
Effects of patient serum on PCa cell proliferation
LNCaP cell proliferation was measured in vitro to determine the effect of patient serum on cell number, division, and viability. PCa cells were treated for 24 hours with 10% patient serum (n = 80, 20/group).
Proliferation of LNCaP cells in vitro was significantly (P = 0.05) greater in non-obese (mean = 1.26 ± 0.20) vs. obese patients (mean = 1.16 ± 0.19) (Fig. 1). There was no significant difference between non-PCa (mean = 1.16 ± 0.21) and PCa (mean = 1.26±0.19) patients (P = 0.10), although the mean values were higher in PCa patients. Similarly, significant differences were not observed between the four individual groups: non-obese control (mean = 1.23 ± 0.20), non-obese PCa (mean = 1.28 ± 0.20), obese control (mean = 1.10 ± 0.19), and obese PCa (mean = 1.23 ± 0.18). The P value for these between-group differences was 0.08.
LNCaP cell proliferation in vitro represented as mean absorbance at 490 nm. Patient serum was used to treat LNCaP cells cultured in vitro for 24 hours. Absorbance at 490 nm served as an index for cell proliferation using MTS assay. (A) Represents in vitro LNCaP cell proliferation with patient serum-supplemented media according to the four groups indicated. (B) LNCaP cell proliferation in vitro between non-obese and obese patients and (C) between non-PCa and PCa patients.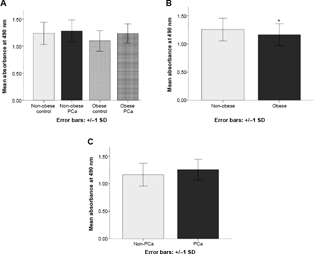
There were no significant differences in PC3 cell proliferation between the groups (data not shown).
Effects of patient serum on PC3 cell migration
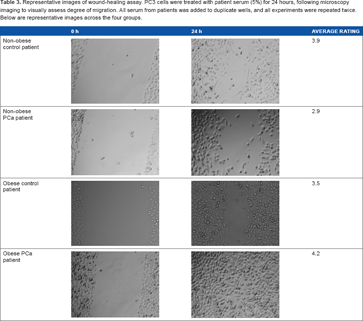
Representative images of wound-healing assay. PC3 cells were treated with patient serum (5%) for 24 hours, following microscopy imaging to visually assess degree of migration. All serum from patients was added to duplicate wells, and all experiments were repeated twice. Below are representative images across the four groups.
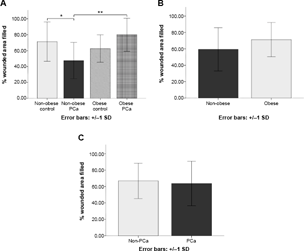
PC3 in vitro cell migration for 24 hours, corrected for age. (A) Represents in vitro PC3 cell migration with patient serum-supplemented media according to the four groups indicated. (B) PC3 cell migration in vitro between non-obese and obese patients and (C) between non-PCa and PCa patients.
Additionally, serum from non-obese PCa patients induced significantly less PC3 cell migration compared with serum from non-obese control patients (P = 0.01).
There were no significant differences observed in PC3 cell migration between serum from obese vs. non-obese patients (P= 0.08) or PCa vs. control patients (P = 0.78) in vitro. Additionally, there were no significant differences in terms of cell migration between the groups using LNCaP cells (data not shown).
The effects of patient serum on PC3 cell invasion
The invasive properties and metastatic potential of tumor cells were assessed in vitro using an invasion chamber assay, which mimics the basement membrane in vivo.
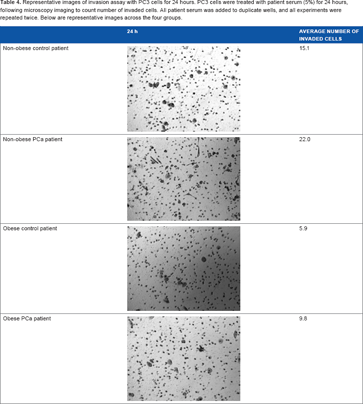
Representative microscopy images of the invaded cells following a 24-hour treatment period on PC3 cell invasion in vitro are shown in Table 4. Significant differences were detected (P < 0.01) in terms of the ability of serum from patients to induce PC3 cell invasion among the four groups: non-obese control (mean = 17.1 ± 4.2), non-obese PCa (mean = 19.1 ± 5.9), obese control (mean = 7.6 ± 4.7), and obese PCa (mean = 8.8 ± 4.8) patients (Fig. 3). Serum from obese patients, including both PCa and non-PCa patients, demonstrated a significantly (P< 0.01) lower capacity for PC3 cell invasion (mean = 8.2 ± 4.5) compared to that from non-obese patients (mean = 18.1 ± 5.0). However, no significant differences (P = 0.58) in invasive capacity were found between serum from PCa patients (mean = 14.0 ± 7.4), including both obese and non-obese, compared to that from non-PCa patients (mean = 12.4 ± 6.5).
PC3 in vitro cell invasion for 24 hours, corrected for age. (A) Represents the average number of invaded PC3 cells in vitro following a 24-hour period of migration, separated into the four groups indicated. (B) PC3 cell invasion in vitro between non-obese and obese patients and (C) between non-PCa and PCa patients. Representative images of invasion assay with PC3 cells for 24 hours. PC3 cells were treated with patient serum (5%) for 24 hours, following microscopy imaging to count number of invaded cells. All patient serum was added to duplicate wells, and all experiments were repeated twice. Below are representative images across the four groups.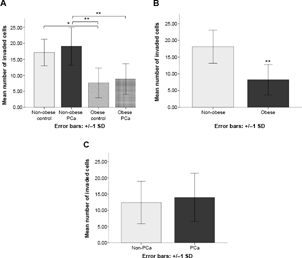
The invasion assay protocol was repeated with LNCaP cells in vitro. However, no definite results were obtained because of the low migratory capacity of these cells.
Serum cytokine levels
A correlation analysis that corrected for age was performed between the various serum cytokine levels and the individual patient group LNCaP cell proliferation levels in vitro. The cytokines MCP-1, resistin, IL-6, HGF, and NGF failed to show any association with cell proliferation in vitro. Serum TNF-α levels showed a significant association with cell proliferation in vitro in non-obese PCa (P < 0.01) and non-obese control groups (P = 0.05), but not with obese PCa (P = 0.69) and obese control groups (P = 0.41).
A correlation analysis that corrected for age was used to examine the relationship between serum cytokine levels and BMI within each of the four patient groups. The cytokines MCP-1, IL-6, TNF-α, HGF, and NGF failed to show any association with BMI within the four patient groups. However, resistin showed a significant association with BMI within the non-obese PCa group (P = 0.02), but not within any of the other three groups.
Serum HGF corrected for age was significantly (P = 0.01) higher in obese (mean = 691.9 ± 540.8) patients compared to non-obese patients (669.6 ± 379.3) and markedly higher (P < 0.01) in PCa patients (880.7 ± 523.7) compared to non-PCa patients (480.8 ± 283.3).
Discussion
Obesity has been reported to be associated with more aggressive PCa. 11 A number of biological mechanisms have been proposed to explain this relationship, several of which implicate humoral factors. 12 The present study utilized serum from obese and non-obese PCa patients to treat PCa cells in vitro and to assess the effects on cell proliferation, migration, and invasion. Unexpectedly, PCa cells in vitro cultured with media supplemented with serum from non-obese, compared to obese, PCa patients exhibited significantly greater amounts of proliferation and invasion. The present data underscore the importance of investigating the precise role of obesity-related cytokines in PCa biology.
There were no significant differences between patient groups in terms of serum cytokine levels of MCP-1, resistin, IL-6, TNF-α, and NGF. The patient population in this study was relatively small (n = 80) and thus may not have had enough power to detect subtle differences in the level of these cytokines between healthy and pathological subjects. The serum levels of HGF were significantly higher in PCa compared to control patients. Within the PCa groups, HGF was higher in the non-obese PCa group compared to the obese PCa group. The results of this study relating to HGF are in accordance with previous published data. HGF and its receptor Met tyrosine kinase are overexpressed in PCa cells and increase in expression throughout the stages of PCa progression. 13 Pharmacological antagonists of the HGF/Met pathway have been shown to be effective in treating PCa. 14 HGF may interact with the alterations in obesity-related prostate volume, 15 explaining why HGF serum levels were different between PCa obese and non-obese patients in the present study. Resistin showed an association with BMI within the non-obese PCa group but not within any of the other three groups. Serum resistin levels have previously been reported to correlate with obesity and T2D. 16 Serum TNF-α levels showed an association with LNCaP cell proliferation in vitro only in the non-obese PCa and control groups. A paradoxical role for TNF-α in PCa biology exists, where TNF-α has been shown to stimulate the development of CRPC (castrate-resistant PCa) and metastasis on the one hand and induce apoptosis and antitumor immunity on the other hand. 17 The present study indicates that TNF-α's effect on PCa cells is modified by body adiposity.
The fact that non-obese patient serum caused greater PCa cell proliferation in vitro is an unexpected finding, given that obesity appears to promote aggressive disease in clinical studies. 3 We would expect obese PCa patient serum to induce greater proliferation in a metastatic cell line in vitro. Several published animal studies with a similar design found dissimilar results compared to the present study. In one study in 2007, it was shown that obese, compared to lean, Zucker rat serum added to LNCaP cells in vitro had greater mitogenic and proliferative effects. 18 In another study in 2012, it was shown that serum from C57BL/6 mice with diet-induced obesity, compared to lean serum, added to LNCaP and PacMetUTl cells in vitro increased cell proliferation. 19 The disparity between the present results and previous data may be explained by obesity-related hemodilution, minimizing the amount of cancer-promoting, serum-born factors, lessening proliferative potential. Increased periprostatic adipose tissue may enhance PCa progression locally, enhancing metastatic potential via paracrine as opposed to endocrine signaling.
In terms of mean PC3 cell migration score, there were significant differences among the four groups (P < 0.01), with the highest to lowest scores in the following order: obese PCa, non-obese control, obese control, and non-obese PCa patients. As would be expected, obese PCa patient serum induced the greatest amount of cell migration in vitro, indicating that obesity may promote metastatic disease. In a previous study, cited above, it was found that LNCaP cells exposed to obese C57BL/6 mouse serum had increased migration, invasion, and MMP-9 (matrix metalloproteinase-9) activity. 19
There was an unexpected effect using serum from obese patients inducing significantly lower PCa cell invasion in vitro compared to that from non-obese patients (P < 0.01). The disparity between the migration and invasion results in the present study may be attributed to the fact that only a small subset of the patient cohort was used for the invasion experiments.
Significant differences between the treatment groups were only observed for the proliferation of LNCaP cells and not for PC3 cells. Without further analysis, it is impossible to determine the specific reason for the disparity in the findings between the cell lines. However, it should be noted that LNCaP cells differ from PC3 cells in that they express PSA, WT TP53, and androgen and estrogen receptors. 20
This study is the first of its kind where human serum from obese and non-obese patients was used to treat PCa cells in vitro. The strength of this study is that in vitro experimentation allowed for an analysis strictly of the biological mechanisms, without any confounding factors. By treating PCa cells in vitro with human serum, we were able to directly assess the effect of humoral obesity-related factors on PCa progression and promotion. There were several limitations. The study population was imbalanced with respect to age. The PCa patients were older than the control patients, meaning that any effects seen in the PCa groups could have been exaggerated because of age-related biological effects rather than cancer or obesity-related effects. However, in a report that demonstrated that BMI was predictive of high-grade PCa among 3258 participants, risk factors, including age, were controlled for. 21 Thus, in the present study, univariate analysis was used to control for age, a potential covariate. Nevertheless, such statistical corrections may not compensate for the effects of age on pathophysiology. 22 Furthermore, BMI is a crude measure of body adiposity, and does not differentiate between subcutaneous and visceral depots. Disease complications appear to be associated specifically with increased visceral adiposity, more accurately assessed by WHR (waist-to-hip ratio), waist circumference, or periprostatic fat thickness (via MRI imaging). 23
Conclusion
Serum from obese PCa patients induced greater amounts of cell migration in vitro. Unexpectedly, serum from obese PCa patients was associated with lower levels of cell proliferation and invasion. Future investigations should explore the impact of obese serum on PCa cell characteristics in different cell lines, using larger patient populations and utilizing genetic analyses.
Author Contributions
Conceived and designed the experiments: BCM, NEF, LK, and VV. Analyzed the data: BCM, LK, and VV. Wrote the first draft of the manuscript: BCM. Contributed to the writing of the manuscript: BCM. Agreed with manuscript results and conclusions: BCM, NEF, LK, and VV. Jointly developed the structure and arguments for the paper: BCM, LK, and VV. Made critical revisions and approved the final version: BCM, NEF, LK, and VV. All authors reviewed and approved the final manuscript.
Supplementary Data
Supplementary table 1
Clinicobiologic/pathologic characteristics of patient cohort. Clinicobiologic characteristics of the four patients groups, along with serum cytokine levels.
Footnotes
Acknowledgments
The authors thank Princess Margaret Hospital's Genito-Urinary BioBank and Karen Chadwick, GU BioBank manager.