
Abstract
We hypothesized that the requirements of essential nutrients are dependent upon catabolic abilities. Mice lacking L-tryptophan 2,3-dioxygenase (TDO) are available. The body concentration of L-tryptophan (L-Trp) has been reported to be higher in TDO-deficient mice than in wild-type (WT) mice. We examined the requirement of an appropriate L-Trp level for TDO-deficient mice using several biomarkers. TDO-deficient mice were fed a 10% amino-acid mixture diet containing 0.06%, 0.08%, and 0.17% L-Trp. WT mice fed a 0.17% Trp diet (standard diet) were used as control mice. The concentrations of L-Trp and its metabolites via serotonin were higher in TDO-deficient mice fed the 0.17% L-Trp diet than in WT mice fed the standard diet, but the concentrations were almost identical between TDO-deficient mice fed the 0.06% L-Trp diet and WT mice fed the standard diet. Therefore, as hypothesized, requirements of essential nutrients are dependent on catabolic abilities.
Introduction
L-tryptophan (L-Trp) is an essential amino acid. L-Trp is required as a precursor of specific metabolically-active compounds such as serotonin (5-hydroxytryptamine (5-HT)) and nicotinamide, as well as in protein syntheses; it is also involved in the regulation of immune and inflammatory responses.1,2 About 10% of total 5-HT in the whole body is in the brain and approximately 90% is in the gut. 2 When the protein metabolism is in a state of dynamic equilibrium, it is believed that >90% of L-Trp is catabolized by the L-Trp-kynurenine pathway.1,2 The first enzymes of this pathway are L-tryptophan 2,3-dioxygenase (TDO) and indoleamine 2,3-dioxygenase (IDO).1,2 Mice lacking TDO are available for the experimentation.3–5 TDO is highly expressed in the liver and is also expressed in the brain.6–8 The brain and plasma concentrations of L-Trp and 5-HT and the liver concentration of Trp have been reported to be higher in TDO-deficient mice than in wild-type (WT) mice fed a normal diet.3–5 It has been suggested that the catabolic ability of L-Trp in TDO-deficient mice is reduced. Excess L-Trp intake has induced several adverse effects such as growth and food intake suppression, even in WT rats.9,10 Reports suggest that a requirement of L-Trp for mice lacking TDO is much lower than that for WT mice.9,10 However, there are no results to support a relationship between L-Trp catabolism and L-Trp intake.
We hypothesized that the requirements of L-Trp are dependent on the L-Trp catabolic ability. We determined an appropriate L-Trp intake for TDO-deficient mice using several biomarkers.
Materials and Methods
Animals and diets
The care and treatment of experimental animals conformed with the guidelines for the ethical treatment of laboratory animals set by the University of Shiga Prefecture (Shiga, Japan). The room temperature was 20 °C and the humidity was 60%. A 12-hour (h) light–-dark cycle was maintained.
The establishment of Tdo–/– mice and breeding conditions has been previously described.3,4 All the mice used in the experiments had the genetic background of C57BL/6 through backcrossing for ≥10 generations. 7-week-old Tdo–/– and WT mice were used. Mice were placed in individual metabolic cages (CL-0355; Clea Japan, Tokyo, Japan). The 3 purified diets, that is, L-Trp restricted amino acid mixture (0.06% L-Trp diet and 0.08% L-Trp diet, 0.6 g L-Trp/kg diet and 0.8 g L-Trp/kg diet) and an ordinary 10% amino acid mixture diet (0.17% L-Trp diet, 1.7 g L-Trp/kg diet,) were used.11–14 See Supplementary Tables 1 and 2 for more information.
Body weights and food intakes in control (WT mice fed the 0.17% L-Trp diet) and Tdo–/– mice fed the 0.17%, 0.08%, and 0.06% L-Trp diets.

Experiment 1 was performed to examine how much L-Trp is minimum requirement for WT mice. 7-week-old WT mice were placed in individual metabolic cages (CL-0355; Clea Japan, Tokyo, Japan) and fed the diets (0.06% L-Trp, 0.08% L-Trp, and 0.17% L-Trp diets) and water ad libitum for 28 days. As described in the Results section, the diet containing 0.06% L-Trp was enough to sustain optimum growth. We determined that a minimum requirement of L-Trp for WT mice was 0.06% under the present conditions, because our preliminary experiment showed that feeding the diet containing 0.03% L-Trp could not sustain optimum growth.
Experiment 2 was performed to investigate how much L-Trp is appropriate Tdo–/– mice. 7-week-old Tdo–/– were placed in individual metabolic cages (CL-0355; Clea Japan, Tokyo, Japan). Tdo–/– mice were fed the 3 diets (0.06%, 0.08%, and 0.17% L-Trp) and water for 28 days. As the gold standard (control), the data on WT mice fed the 0.17% L-Trp diet in Experiment 1 were used.
Body weight and food intake were measured every day at 10:00. Urine samples (24 h; 09:00–09:00) were collected in amber bottles. Collected portions were treated with 10% (v/v) 1 mol/L HCl to measure L-Trp and its metabolites via 5-HT and stored at –20 °C until needed.
Mice were killed on the last day of the experiment. To obtain plasma samples, blood were collected in ethylenediamine tetra-acetic acid-2K (EDTA-2K) tubes (Venoject II vacuum tube; Terumo, Tokyo, Japan). Blood samples were centrifuged at 2,000 × g for 30 min at 4 °C and the resulting plasma stored at –20 °C until needed. To measure levels of L-Trp and its metabolites via 5-HT, the liver, small intestine, hippocampus, striatum, and cerebral cortex were removed.
Assay for Trp
The amount of the total form of Trp in tissues and plasma was measured following the method used by Shibata and colleagues.15,16 The liver was removed and placed immediately into 10 volumes of cold water and homogenized using a Teflon glass homogenizer. Homogenates were placed into an identical volume of 10% trichloroacetic acid (TCA). The hippocampus, striatum, and cerebral cortex were removed and placed immediately into 5 volumes of cold 5% TCA containing 0.1% cysteine and homogenized using a Teflon glass homogenizer. Homogenates were placed into an identical volume of 5% TCA. Plasma (10 μL) was added to 990 μL of 5% TCA containing 0.1% cysteine. These samples were mixed for 5 minutes (min), allowed to stand for 5 min, and centrifuged at 10,000 × g for 3 min at 4 °C. The resulting supernatant was passed through a 0.45-μm microfilter. The filtrates obtained from tissues and plasma were injected directly into the high-performance liquid chromatography (HPLC) system as that developed by Shibata and collegues.15,16 Trp was separated using a Chemcosorb 5-ODS-H column (particle size, 5 μm; 150 × 4.6 mm i.d.) eluted with 20 mmol/L KH2PO4 containing 1 g/L sodium heptanesulfonate and 3 mg/L EDTA-2 Na: acetonitrile (93:7, v/v, pH adjusted to 3.7 by addition of H3PO4) at a flow rate of 1.5 mL/min. L-Trp was estimated by electrochemical means at +900 mV compared with that seen with Ag/AgCl. The column temperature was maintained at 40 °C.
The daily urinary excretions (nmol per 24 h) of L-Trp were measured following the method used by Shibata and collegues.15,16 A total of 200 μL of collected urine was added to 800 μL of 5% TCA. These samples were mixed for 5 min, allowed to stand for 5 min, and centrifuged at 10,000 × g for 3 min at 4 °C. The resulting supernatant was passed through a 0.45-μm microfilter. The filtrates obtained from the urine were injected directly into the same HPLC system as that developed by Shibata and collegues.15,16 L-Trp was separated using a Chemcosorb 5-ODS-H column (particle size, 5 μm; 150 × 4.6 mm i.d.) eluted with 20 mmol/L KH2PO4 containing 0.6 g/L sodium octanesulfonate: acetonitrile (93:7, v/v, pH adjusted to 3.7 by addition of H3PO4) at a flow rate of 1.5 mL/min. L-Trp was measured at an excitation wavelength of 280 nm and an emission wavelength of 340 nm. The column temperature was maintained at 40 °C.
Assays for 5-HT and 5-HIAA
The amount of 5-HT and 5-indole-3-acetic acid (5-HIAA) in tissues and plasma as well as the daily urinary excretions (nmol/24 h) of 5-HIAA was measured following the method used by Shibata and colleagues.15,17 The small intestine, hippocampus, striatum, and cerebral cortex were removed and placed immediately into 5 volumes of cold 5% TCA containing 0.1% cysteine and 0.5 μg/mL 5-hydroxy-Nω-methyltryptamine (M-5-HT; used as an internal standard) and homogenized using a Teflon glass homogenizer. Homogenates (50 μL) were placed into 950 μL of 5% TCA containing 0.1% cysteine. Plasma (10 μL) was added to 990 μL of 5% TCA containing 0.1% cysteine and 20 ng/mL M-5-HT. A total of 50 μL of collected urine was placed into 950 μL of 5% TCA containing 0.1% cysteine and 60 ng/mL M-5-HT. These samples were mixed for 5 min, allowed to stand for 5 min, and centrifuged at 10,000 × g for 3 min at 4 °C. The resulting supernatant was passed through a 0.45-μm microfilter. Filtrates obtained from tissues, plasma and urine were injected directly into the HPLC system as that developed by Shibata and colleagues.15,17 5-HT, 5-HIAA and M-5-HT were separated using a Tosoh ODS 80 Ts column (particle size, 5 μm; 150 × 4.6 mm i.d.) eluted with 40 mmol/L KH2PO4 containing 0.1 g/L sodium octanesulfonate and 3 mg/L EDTA-2 Na:methanol (8:2, v/v, pH adjusted to 3.5 by addition of H3PO4) at a flow rate of 0.9 mL/min. Levels of 5-HT, 5-HIAA and M-5-HT were estimated by electrochemical means at +700 mV compared with that seen with Ag/AgCl. The column temperature was maintained at 40 °C.
Statistical analyses
Values are the mean ± SEM. Statistical significance was determined by one-way ANOVA and was followed by Tukey's multiple-comparison test. Differences with P < 0.05 were considered significant. Graph Pad Prism version 5.0 (Graph Pad Software, San Diego, CA, USA) was used for all analyses.
Results
Experiment 1
All of the data on WT mice fed the 0.06%, 0.08%, and 0.17% L-Trp diets are shown in Supplementary Table 3. These data revealed that a minimum requirement of L-Trp for C57BL/6 mice could be obtained with a diet containing 0.06% L-Trp, which was about 100 mg L-Trp/kg body weight (average daily food intake, 3.8 g; average body weight, 23 g ((60 mg L-Trp/100 g diet) × (3.8 g food intake/day) × (1/0.023 kg body weight) ≈ (100 mg L-Trp/kg body weight)).
Experiment 2
Body weight, food intake, and tissue weights
Although the initial body weights of Tdo–/– mice were significantly lower than those of WT mice, the final body weights and body weight gain were not significantly different (Table 1). The tissue weights among the groups were not significantly different (Supplementary Table 4).
L-Trp and its metabolites via 5-HT in plasma
The plasma concentration of L-Trp (Fig. 1A) in Tdo–/– mice fed the 0.06% L-Trp diet were not significantly different from WT mice fed the standard diet, even though the concentrations in Tdo–/– mice fed the 0.17% or 0.08% L-Trp diets increased by 2-10-fold compared with WT mice fed the standard diet. The plasma concentration of 5-HT (Fig. 1B) in Tdo–/– mice fed the 0.17% L-Trp diet were about 5-fold higher compared with WT mice fed the standard diet.
Plasma concentrations of L-Trp 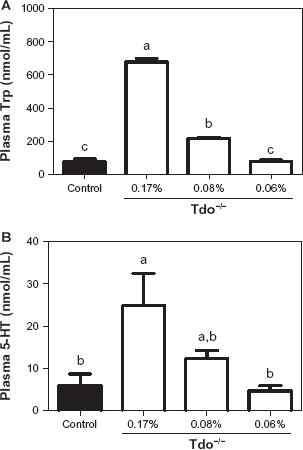
Levels of L-Trp, 5-HT, and 5-HIAA in the brain
With regard to the concentrations of L-Trp in the hippocampus (region of serotonergic input; Fig. 2A), striatum (region of 5-HT synthesis; Fig. 2B), and cerebral cortex (reflection of whole brain state;
3
Fig. 2C), Tdo–/– mice fed the 0.06% L-Trp diet were not significantly different from the WT mice even though such concentrations in Tdo–/– mice fed the 0.17% and 0.08% L-Trp diets increased with the WT mice fed the standard diet.
Concentrations of L-Trp, 5-HT, and 5-HIAA in the regions of brain (hippocampus, striatum, and cerebral cortex) of WT mice fed the 0.17% L-Trp diet (control) and of Tdo–/– mice fed the 0.17%, 0.08%, and 0.06% L-Trp diets. (
The concentrations of 5-HT in the hippocampus (Fig. 2D) of Tdo–/– mice fed the 0.08% L-Trp and 0.17% L-Trp diets were higher than that of WT mice fed the standard diet, while that of Tdo–/– mice fed the 0.06% L-Trp diet were not different from that of WT mice. The concentrations of 5-HT in the striatum (Fig. 2E) of Tdo–/– mice were almost the same among the three diet groups and were not observed the difference from that of WT mice. The concentrations of 5-HT in the cerebral cortex (Fig. 2F) of Tdo–/– mice fed the 0.06% L-Trp diet were not significantly different from the WT mice, although those of Tdo–/– mice fed the 0.08% L-Trp and 0.17% L-Trp diets were higher than that of WT mice.
Secreted 5-HT in the brain is taken up by 5-HT transporters. The “captured” 5-HT is then metabolized to 5-HIAA. Then, 5-HIAA concentration reflects level of 5-HT secretion. The concentration of 5-HIAA in the hippocampus (Fig. 2G) of Tdo–/– mice fed the 0.06% L-Trp diet was not significantly different from the WT mice, while the concentration in those of Tdo–/– mice fed the 0.08% and 0.17% L-Trp diets was higher than that of WT mice. The concentration of 5-HIAA in the striatum (Fig. 2H) of Tdo–/– mice fed the 0.06% L-Trp diet was not significantly different from that of WT mice, while the concentration in Tdo–/– mice fed the 0.08% and 0.17% L-Trp diets was higher than that of WT mice. The concentration of 5-HIAA in the cerebral cortex (Fig. 2I) of Tdo–/– mice fed the 0.06% L-Trp diet was not different from the WT mice, while that of Tdo–/– mice fed the 0.08% and 0.17% L-Trp diets was higher than that of WT mice.
L-Trp and its metabolites via 5-HT in urine and other tissues
The urinary excretion of L-Trp and 5-HIAA (Fig. 3A and C) in Tdo–/– mice fed the 0.06% L-Trp diet was not different from WT mice fed the 0.17% L-Trp diet, even though the urinary excretion of L-Trp and 5-HIAA in Tdo–/– mice fed the 0.17% and 0.08% L-Trp diets increased by 2–5-fold higher compared with WT mice. The urinary excretion of 5-HT was detected only in Tdo–/– mice fed the 0.17% and 0.08% L-Trp diets (Fig. 3B).
Daily urinary excretion of L-Trp (A), 5-HT (B), and 5-HIAA (C) in WT mice fed the 0.17% L-Trp diet (control) and in Tdo–/– mice fed the 0.17%, 0.08%, and 0.06% L-Trp diets.
The concentration of L-Trp in the liver and the concentration of 5-HT in small intestine of control (WT mice fed the 0.17% L-Trp diet) and Tdo–/– mice fed the 0.17%, 0.08%, and 0.06% L-Trp diets.

The concentration of 5-HT in the small intestine was slightly higher in the group of Tdo–/– mice fed the 0.08% L-Trp than in the groups of Tdo–/– mice fed the 0.06% and 0.17% L-Trp. Meanwhile, this was not observed the difference between Tdo–/– mice fed the 0.08% L-Trp diet and WT mice fed the 0.17% L-Trp diet (Table 2).
Discussion
Initial body weights of Tdo–/– mice were significantly lower than those of WT mice; however, the final body weights and body weight gain were not significantly different. This phenomenon might be due to the difference of diets; that is, the animals’ feeding diet before the experiment was a commercial non-purified diet MF (obtained from Oriental Yeast Co., Ltd., Tokyo, Japan), whereas feeding diets during the experiment were chemically-defined. In addition, the MF diet contains about 2-fold L-Trp compared with the standard diet, 0.17% L-Trp diet. The finding indicates that MF diet is not a suitable diet for Tdo–/– mice because of high L-Trp concentration.
We do not know what the minimum requirement of L-Trp for WT mice is. Experiment 1 was performed to examine this. When an optimum growth was used as an index for a requirement of L-Trp, feeding the 0.06% L-Trp diet to WT mice supplied a minimum requirement of L-Trp. Average daily food intake of WT mice was 165 g diet/kg body weight. WT mice fed the 0.06% L-Trp diet can take about 100 mg L-Trp/kg body weight.
A daily diet intake of typical Japanese women (body weight 50 kg) is ≈ 420 g in the dry matter (protein 60 g, fat 50 g, carbohydrate 300 g, and small amounts of minerals and vitamins); 8.5 g diet/kg body weight. The requirement of L-Trp in adult humans has been reported to be 4 mg/kg body weight. 18 Thus, the L-Trp concentration in the diet, which can supply a requirement of L-Trp for typical Japanese women, becomes 0.047%. The dietary L-Trp concentration for sustaining a minimum requirement was almost the same between humans and mice. Adult humans, in general, consume ≈ 1 g of L-Trp every day (eg, healthy young Japanese women consume 700 mg of L-Trp every day). 15 Hence, humans can catabolize ≈ 1 g of L-Trp every day. Our research team reported that supplementation of 5 g/day of L-Trp in adult Japanese women caused high urinary excretion of 3-hydroxykynurenine in some subjects. 19 Such a finding suggests hereditary variance of L-Trpkynurenine catabolism in humans. Thus, the development of a special diet low in L-Trp is expected in certain populations low in L-Trp degradation ability.
Studies have shown that changes in the catabolism of L-Trp influence the whole-body concentrations of L-Trp.20,21 The whole-body concentration of L-Trp is regulated by TDO, which is present primarily in the liver.6–8 The whole-body concentration of L-Trp and 5-HT in Tdo–/– mice has been reported to be higher compared with WT mice when both mice were fed a commercial non-purified diet which contains 0.29% L-Trp.3,4
In the present study, the concentrations of 5-HT in the striatum of Tdo–/– mice were almost the same among the 3 diet groups and were not observed to be different from that of WT mice. This interesting phenomenon cannot be explained at the moment. Further investigation should thus be undertaken. The concentrations of L-Trp in plasma, liver, hippocampus, striatum and cerebral cortex were much higher in Tdo–/– mice fed the 0.17% L-Trp diet than in the WT mice. In addition, the concentrations of 5-HT in the plasma, hippocampus, and cerebral cortex were higher in the Tdo–/– mice fed the 0.17% L-Trp diet than in the WT mice, but the increases were not incredibly high. The formation of 5-HT is associated indirectly with TDO activity because a lack of TDO leads to an increase in the concentration of L-Trp. Funakoshi and colleagues3,4 revealed that the rate-limiting factor in the synthesis of 5-HT is the substrate L-Trp, but not an enzyme L-Trp hydroxylase. Therefore, the association between TDO activity and 5-HT formation is an inverse relationship. Kanai et al 7 reported that TDO expression was higher in hippocampus than in the striatum and cerebral cortex. In the present experiment, the increase in L-Trp between control and Tdo–/– mice fed the 0.17% L-Trp diet were 12-fold, 16-fold, and 10-fold in the hippocampus, striatum, and cerebral cortex, respectively. These findings did not show the strong inverse relationship between TDO expression and the concentration of L-Trp under the present experimental conditions. Funakoshi and collegues3,4 revealed that brain 5-HT was higher in Tdo–/– mice than in WT mice. However, in the present study, the concentrations of 5-HT in striatum in the Tdo–/– mice fed a 0.17% L-Trp diet were not significantly different compared to those of the WT mice. This discrepancy might be attributed the dietary L-Trp concentration: A diet used in Funakoshi's experiment3,4 contains about 0.29% L-Trp (2.9 g L-Trp/kg diet), which is about twice compared with the standard diet (0.17% L-Trp diet). High levels of 5-HT can cause mental disturbance.3,4,22 In fact, Tdo–/– mice fed the commercial non-purified diet elicited abnormal behavior due to high levels of 5-HT in the brain.3,4 In addition, the swim stress in rats has been demonstrated to lead to a decrease in TDO activity and increased 5-HT levels in the brain; 23 tolmetin and sulindac have been shown to inhibit TDO activity in the liver and to increase the level of 5-HT in the hippocampus. 24
Approximately 95% of total 5-HT in the whole body is present in the gut. 2 The 5-HT concentration in the small intestine of Tdo–/– mice fed a 0.06% Trp diet were not significantly different from Tdo–/– mice fed the standard diet, 0.17% L-Trp diet. Unexpectedly, the concentration of 5-HT in the small intestine was slightly higher in the group of Tdo–/– mice fed the 0.08% L-Trp diet than in the groups of Tdo–/– mice fed the 0.06% and 0.17% L-Trp diets. But the concentration was not observed the difference between the groups of Tdo–/– mice fed the 0.08% L-Trp diet and of WT mice fed the 0.17% L-Trp diet. Therefore, we like to think that the slightly higher concentration of 5-HT in small intestine of Tdo–/– mice fed the 0.08% L-Trp diet happened by chance.
Data regarding the requirement of L-Trp for mice are lacking. However, for rats, 0.17% L-Trp as part of a diet is sufficient to sustain growth. 13 We selected this concentration to be an appropriate amount for WT mice. Feeding the 0.17% L-Trp diet resulted in higher concentrations of L-Trp and 5-HT in Tdo–/– mice than in WT mice. This finding suggests that the 0.17% L-Trp diet was an excess L-Trp diet for Tdo–/– mice. Studies have demonstrated that excess intake of L-Trp can induce adverse effects.9,10 Thus, we reduced the amount of dietary L-Trp from 0.17% to 0.06% and 0.08%. Feeding the 0.17% L-Trp diet to Tdo–/– mice did not induce any apparent adverse effects such as body weight gain, food intake and tissue weights compared to WT mice fed the 0.17% L-Trp diet. In addition, no adverse visual appearance of Tdo–/– mice fed the 0.17% L-Trp diet was observed. However, the concentrations of L-Trp and 5-HT in plasma as well as the concentrations of L-Trp, 5-HT and 5-HIAA in some brain regions were higher in Tdo–/– mice fed the 0.17% L-Trp diet than in WT mice fed the 0.17% L-Trp diet. These effects were diminished by changing the diet from the 0.17% L-Trp diet to the 0.08% L-Trp and 0.06% L-Trp diets in Tdo–/– mice.
The present study indicated that feeding the 0.17% L-Trp diet resulted in an excess of L-Trp for Tdo–/– mice because the urinary excretions of L-Trp, 5-HT, and 5-HIAA were higher in Tdo–/– mice fed the 0.17% L-Trp diet than in WT mice fed the 0,17% L-Trp diet. These greater urinary excretions were diminished by changing the diet from the 0.17% L-Trp diet to the 0.08% L-Trp and 0.06% L-Trp diets.
In conclusion, an appropriate amount of L-Trp for Tdo–/– mice is 0.06% of a diet. We hypothesized that the requirements of indispensable nutrients are dependent upon catabolic abilities: these data provided evidence for this hypothesis.
Author Contributions
AM, TF, and KS designed the research. AM conducted the research. AM and KS analyzed data; AM and KS drafted the manuscript. TN and HF developed the Tdo-knockout mice. KS had a primary responsibility for the final content. All authors approved the final manuscript.
Funding
This investigation was part of the project “Studies on the nutritional evaluation of amino acids and B-group vitamins” (Principal investigator, Katsumi Shibata), which was supported by a Research Grant for Grants-in-Aid for Scientific Research from the Japan Society for the Promotion of Science.
Competing Interests
Author(s) disclose no potential conflicts of interest.
Disclosures and Eethics
As a requirement of publication the authors have provided signed confirmation of their compliance with ethical and legal obligations including but not limited to compliance with ICMJE authorship and competing interests guidelines, that the article is neither under consideration for publication nor published elsewhere, of their compliance with legal and ethical guidelines concerning human and animal research participants (if applicable), and that permission has been obtained for reproduction of any copyrighted material. This article was subject to blind, independent, expert peer review. The reviewers reported no competing interests.
Footnotes
Supplementary Data
Various tissue weights corrected by body weight of control (WT mice fed the 0.17% L-Trp diet) and Tdo–/– mice fed the 0.17% L-Trp diet, 0.08% L-Trp diet and 0.06% L-Trp diet.

| Control | Tdo–/– mice |
|||
|---|---|---|---|---|
| 0.17% L-Trp | 0.08% L-Trp | 0.06% L-Trp | ||
| Liver (g/100 g body weight) | 4.98 ± 0.25 | 4.60 ± 0.07 | 4.68 ± 0.13 | 4.52 ± 0.17 |
| Small intestine (g/100 g body weight) | 2.92 ± 0.10 | 3.35± 0.17 | 2.79 ± 0.20 | 3.00 ± 0.14 |
| Hippocampus (mg/100 g body weight) | 122 ± 5 | 111 ±4 | 107 ± 2 | 115 ± 4 |
| Striatum (mg/100 g body weight) | 89.2± 11.2 | 88.5 ± 2.6 | 92.9 ± 7.3 | 70.2 ± 5.5 |
| Cerebral cortex (mg/100 g body weight) | 665 ± 25 | 655 ± 27 | 603 ± 25 | 657 ± 25 |