
Abstract
The purpose of this study was to determine, using the high-performance liquid chromatographic methods recently modified by us, the fate of dietary tryptophan in 17 healthy female Japanese adults who ate self-selected food. The experimental period was 22 days. The habitual intake of tryptophan was 3328.4 μmol/day. 24-hour urine samples were collected at the beginning of the experiment and then once per week. Blood was collected at the beginning and end of the experiment. Levels of tryptophan and its metabolites were measured in blood and urine. Tryptophan, nicotinamide and 2-oxoadipic acid were the major compounds of the blood. The urinary excretion amounts of tryptophan, 5-hydroxyindole-3-acetic acid, kynurenine, anthranilic acid, kynurenic acid, 3-hydroxykynurenine, xanthurenic acid, 3-hydroxyanthranilic acid and quinolinic acid were about 40, 20, 4, 1, 10, 4, 3, 5 and 20 μmol/day, respectively.
Keywords
Introduction
In 1901, Hopkins discovered that tryptophan (Trp) was an amino acid contained in proteins. The mean Trp protein content in the human body is 1.2 g/100 g of protein, which is much lower than that of other essential amino acids such as lysine (7.6%), leucine (7.1%) and threonine (4.0%). 1 The requirement of protein for healthy Japanese females is approximately (≈) 50 g/day. 2 They can maintain a state of the protein dynamic equilibrium under these conditions (Fig. 1). In other words, ≈0.6 g of Trp is supplied from daily meals and is also catabolized daily by the body.

Major metabolic pathway of tryptophan.
Apart from protein turnover, hydrolysis and biosynthesis in cells, mounting evidence suggests that metabolites of Trp have a significant role. These metabolites can be precursors of the vitamin nicotinamide (Nam),3,4 including the neuromodulators kynurenic acid (KA) 5 and 3-hydroxykynurenine (3-HK), 6 the neurotoxin quinolinic acid (QA), 7 the neurotransmitter 8 and regulator of intestinal movement 9 serotonin (5-HT), and a hormone found in the pineal gland called melatonin 10 (Fig. 1). There are differences in Trp metabolism (including Nam metabolism) among strains and species. For example, the induction of tryptophan 2,3-dioxygenase (TDO) by Trp was observed in cats but the response was less than that seen in rats. 11 TDO is the first enzyme in the Trp-Nam pathway that catalyses the reaction of Trp↠N-formylkynurenine in liver. In extra-hepatic tissues, another enzyme called indoleamine-2, 3-dioxygenase (IDO) also catalyzes the reaction of Trp↠N-formylkynurenine. This enzyme is induced by several factors such as interferon-γ, 12 interleulin-1, 13 and lipopolysaccharide. 14
Excretion amounts of Trp metabolites are known to be increased by pregnancy, contraceptive corticosteroids, and corticosteroid hormones.15,16 Hankes and colleagues 17 compared loading testing with Trp and kynurenine in Caucasian and African—Americans in the USA, and reported that the differences seen between them were small. Payne and colleagues 18 studied the dietary intakes of Trp and niacin as well as the urinary excretion of the metabolites of Trp in schizophrenic subjects as compared to non-schizophrenic subjects and found some differences between groups. Shibata and colleagues compared the urinary excretion of niacin and its metabolites in various mammals, 19 and noted that the metabolism of Nam was different among rodents. 20 Yeh and Brown 21 compared Trp metabolism among rats, guinea pigs, hamsters and female humans and reported that a high percentage of the Trp administered was excreted as KA and QA in rat urine, and as acetylkynurenine and kynurenine in hamster urine. Alternatively, none of the Trp metabolites in guinea pigs urine or human urine accounted for more than 1% to 2% of Trp administered.
Techniques that allow quantitative measurement of Trp metabolism have not been developed, but Trp metabolism has been investigated in various research studies. 22 In these studies, Trp was found to be degraded primarily through the kynurenine pathway. Ninety percent of the Trp that is degraded is converted to kynurenine, but <1% of ingested Trp is used for serotonin synthesis, 23 and ≈2% of ingested Trp is used for nicotinamide synthesis. 24 Shibata and colleagues developed a reliable and straightforward high-performance liquid chromatography (HPLC) method for Trp 25 and its metabolites. These metabolites included kynurenin, 26 anthranilic acid (AnA), 27 KA, 28 3-HK, 29 xanthurenic acid (XA), 30 3-hydroxyanthranilic acid (3-HA), 30 Nam, N 1 -methyl-2-pyridone-5-carboxamide (2-Py), N 1 -methyl-4-pyridone-3-carboxamide (4-Py), 31 N 1 -methylnicotinamide (MNA), 32 5-HT, 33 5-hydroxyindole-3-acetic acid (5-HIAA) 33 and 2-oxoadipic acid (2-OAA). 34 Physiologically important intermediates are present in the Trp pathway, and metabolic disorders can be diagnosed through the urinary excretion of Trp metabolites. Recently, we modified the methods for pre-treatment of the HPLC samples to measure Trp and its metabolites. In the current study, we investigated the fate of Trp in young Japanese women using these techniques.
Materials and Methods
Subjects
This study was approved by the Ethical Committee of the University of Shiga Prefecture (Hikone, Japan). The purpose and protocol of this study was explained to all participants before they joined the study. Written informed consent was obtained from all participants. We excluded participants who were diagnosed with cold or influenza, who had taken a multi-vitamin supplement at least once during the previous month, or whose 24-h urine collection was considered to be incomplete with a collection time outside the 22–26-h range, with a urine volume < 250 mL. We also excluded participants with creatinine excretion in relation to body weight (creatinine (mg) divided by body weight (kg)) outside the 10.8–25.2 mg/kg range, or with an extremely low or high energy intake (<2,092 kJ/day or >16,736 kJ/day). After these screenings, 17 female students were found to be eligible.
Chemicals
Trp, 5-HT creatinine sulfate, AnA, 3-HK, QA, Nam, pyridoxal phosphate (PLP) and riboflavin were purchased from Wako Pure Chemical Industries (Osaka, Japan). 4-Pyridoxic acid (4-PIC) was manufactured by ICN Pharmaceuticals (Costa Mesa, CA, USA) and obtained through Wako Pure Chemical Industries. Kynurenine sulfate, MNA chloride, XA, KA and 3-HA were obtained from Tokyo Kasei Kogyo (Tokyo, Japan). 5-HIAA and 2-OAA were purchased from Sigma-Aldrich Chemicals (St. Louis, MO, USA). 1,2-diamino-4,5-methylenebenzene was purchased from Dojinkagaku Labs (Kumamoto, Japan). 2-Py and 4-Py were synthesized using the methods of Pullman and Colowick 35 and of Shibata and colleagues, 31 respectively. All other chemicals were of the highest purity available from commercial sources.
Experimental design
The experiment began at 9 am on September 10 2010 (designated as day 1) and completed on Oct 1 2010 so that the end of the experiment was at 9 am on day 23. The experimental period was 22 days.
Seventeen healthy female students aged 18–26 years old (mean ± SD = 20.2 ± 2.0), participated in the present study. Height, body weight, and the body mass index information is shown in Table 1. The body weight of each subject did not change between the beginning and end of the experiment.
Basic characteristics of subjects.

Caluclated as assumed by 60 mg of Trp is equivalent with 1 mg of Nam.
Niacin equivalent = niacin + niacin from Trp.
The 24-hour urine samples were collected on four occasions. These included the second urination at day 1 to the first urination at day 2 (designated “d-1 urine”), the second urination at day 8 to the first urination at day 9 (d-8 urine), the second urination at day 15 to the first urination at day 16 (d-15 urine), and from the second urination at day 22 to the first urination at day 23 (d-22 urine). Urine samples were stored in the dark and at room temperature. After the collection of urine samples, urine volume was measured. The sample was acidified to stabilize Trp and its metabolites by adding concentrated HCl to make 0.1 mol/L the final concentration (except for QA). For the measurement of QA level, urine samples were used directly.
To obtain plasma samples, 30 mL of blood samples were collected in ethylenediamine tetra-acetic acid-2 K (EDTA-2 K) tubes (Venoject II vacuum tube, TERUMO, Tokyo, Japan) after the urine samples had been collected. Blood samples were collected from arm veins before breakfast as well as between 7:30 am and 8:30 a.m. on days 1 and 23. Blood samples were centrifuged at 7,000 × g for 30 minutes at 4 °C, and the resulting plasma was stored at −20 °C until use.
Habitual intakes of nutrients were calculated by a self-administered comprehensive diet history questionnaire (DHQ),36,37 which was completed at the end of the experiment.
Analyses of Trp and its metabolites Trp
For the measurement of Trp in plasma, 0.3 mL of plasma was added to 0.3 mL of 5% trichloroacetic acid (TCA). For the measurement of Trp in urine, 0.5 mL of the acidified 24-hour urine sample was added to 0.5 mL of 5% TCA. Each mixture was left to stand for 10 min in cold water, centrifuged at 10,000 × g for 5 minutes at 4 °C, and the resulting supernatant passed through a 0.45-μm microfilter. The filtrate (for plasma, 20 μL; for urine, 10 μL) was injected directly into the same HPLC system as that developed by Shibata and colleagues. 25 Trp was separated using a Tosoh ODS 80 Ts column (particle size, 5 μm, 150 × 4.6 mm i.d.) eluted with 20 mmol/L KH2PO4 (pH adjusted to 3.7 by the addition of H3PO4) containing 1 g/L sodium heptanesulfonate and 3 mg/L EDTA-2 Na: acetonitrile (93:7, v/v) at a flow rate of 1.0 mL/min. Trp content in plasma was estimated by electrochemical means at +900 mV compared with that seen with Ag/AgCl. Trp content in urine was estimated by fluorometric means at an excitation wavelength of 280 nm and an emission wavelength of 340 nm. The column temperature was maintained at 40 °C. The total analysis time was 12 min. Trp was eluted at ≈10 min under these conditions.
Kynurenine
For the measurement of kynurenine in plasma, 0.4 mL of plasma was added to 0.4 mL of 10% TCA and treated “as in the case of Trp”. For the measurement of kynurenine in urine, the acidified urine sample was passed through a 0.45-μm microfilter. The filtrate (for plasma, 20 μL; for urine, 10 μL) was directly injected into the HPLC. 26 Kynurenine was separated by reversed-phase chromatography. A Tosoh ODS 80 Ts (particle size 5 μm, 250 mm × 4.6 mm i.d.) was used as the analytical column and eluted using a mixture of 20 mmol/L KH2PO4 (pH adjusted to 3.7 by the addition of H3PO4) containing 1-heptanesulfonate sodium salt (1 g): acetonitrile = 10:1 (v/v) as the mobile phase. The flow rate was 1.0 mL/min and the detection wavelength was 360 nm. The column temperature was maintained at 40 °C. The total analysis time was 20 min. Kynurenine is eluted at ≈7 min under these conditions.
AnA
For the measurement of AnA in plasma, 0.4 mL of plasma was added to 0.4 mL of 10% TCA and treated using the method described for Trp. For the measurement of AnA in urine, the acidified urine sample was passed through a 0.45-μm microfilter. The filtrate (for blood, 20 μL; for urine, 20 μL) was injected directly into the HPLC. AnA was measured by the HPLC method developed by Shibata. 27 This method employs a Tosoh ODS 80 Ts (particle size 5 μm, 250 mm × 4.6 mm i.d.) column eluted with 50 mmol/L KH2PO4 (pH adjusted to 3.0 by H3PO4): acetonitrile (65:35, v/v) at a flow rate of 1.0 mL/min. AnA was measured at an excitation wavelength of 340 nm and an emission wavelength of 410 nm. The column temperature was maintained at 40 °C. The total analysis time was 10 min. AnA was eluted at ≈5 min under these conditions.
KA
For the measurement of KA in plasma, 0.4 mL of plasma was added to 0.4 mL of 10% TCA and treated using the method described for Trp. For the measurement of KA in urine, the acidified urine sample was passed through a 0.45-μm microfilter. The filtrate (for blood, 20 μL; for urine, 20 μL) was injected directly into the HPLC. KA was measured by the HPLC method developed by Shibata. 28 This method employs a Tosoh ODS 80 Ts (particle size 5 μm, 150 mm × 4.6 mm i.d.) column eluted with 10 mmol/L CH3COOH-CH3COONa buffer (pH 4.5) and acetonitrile (96:5, v/v) at a flow rate of 1.0 mL/min. After separation under these conditions, KA was reacted with 1 mol/L zinc acetate (used as the post-column reagent) delivered at a flow rate of 1.0 mL/min. Kynurenic acid-Zn2+ was measured at an excitation wavelength of 344 nm and an emission wavelength of 398 nm. The column temperature was maintained at 40 °C. The total analysis time was 20 min. KA is eluted at ≈14 min under these conditions.
3-HK
For the measurement of 3-HK in plasma, 0.4 mL of plasma was added to 0.4 mL of 10% TCA and the resulting supernatant obtained. For the measurement of 3-HK in urine, 3-HK in the acidified urine was reacted with p-toluenesulphonyl chloride in a basic medium. A total of 50 μL of 5% NaHCO3 and 0.2 mL of 0.5% p-toluenesulphonyl chloride in acetone were added to 0.15 mL of the sample, and then allowed to react for 10 min at room temperature. Then, the reaction mixture was passed through a 0.45-μm microfilter, and the filtrate (for blood, 20 μL; for urine, 20 μL) was injected directly into the HPLC system. 29 The analytical method for measurement of the fluorescent compound employed a Tosoh ODS 80 Ts (particle size 5 μm, 250 mm × 4.6 mm i.d.) column eluted with 10 mmol/L KH2PO4 (pH adjusted to 4.0 by the addition of H3PO4):acetonitrile (3:2, v/v) and detection at an excitation wavelength of 375 nm and an emission wavelength of 455 nm. The column temperature was maintained at 40 °C. The total analysis time was 15 min. 3-HK was eluted at ≈12.5 min under these conditions.
XA and 3-HA
For the simultaneous measurement of XA and 3-HA in plasma, 0.4 mL of plasma was added to 0.4 mL of 10% TCA and treated using the method described for Trp. For the simultaneous measurement of XA and 3-HA in urine, the acidified urine sample was passed through a 0.45-μm microfilter. The filtrate (for blood, 100 μL; for urine, 40 μL) was injected directly into the HPLC system. The amounts of XA and 3-HA were measured simultaneously by the HPLC system. 30 This method employed an STR ODS II (250 mm × 4.6 mm i.d.) column eluted with 50 mmol/L KH2PO4 (pH adjusted to 3.0 by the addition of H3PO4) containing 3 mg/L of EDTA-2 Na:acetonitrile (10:1, v/v) at a flow rate of 1.0 mL/min. XA was measured at 340 nm by an ultraviolet (UV) detector. 3-HA was measured by electrochemical means at +500 mV compared with Ag/AgCl. The column temperature was 40 °C. The total analysis time was 25 min. XA and 3-HA were eluted at ≈6.8 and 8 min, respectively, under these conditions.
QA
For the measurement of QA in urine, the urine sample was passed through a 0.45-μm microfilter. The filtrate (20 μL) was injected directly into the HPLC system. 38 This method employed a Unisil QC18 (250 mm × 4.6 mm i.d.) column eluted with 35 mmol/L KH2PO4 (pH adjusted to 3.8 by the addition of 0.2 mol/L citric acid) containing 350 mmol/L H2O2 and 0.05 mmol/L tetramethylammonium hydroxide at a flow rate of 0.6 mL/min. QA in the column effluent was irradiated with UV light to produce fluorescence. This fluorescence was monitored with an excitation wavelength of 326 nm and an emission wavelength of 380 nm. The column temperature was maintained at 40 °C. The total analysis time was 30 min. QA was eluted at ≈8 min under these conditions. The acidified urine was not suitable for the HPLC method described here.
MNA
MNA in the acidified urine was reacted with acetophenone in a strong alkali medium at 4 °C in the presence of a large amount of isonicotinamide for 10 min. After the reaction, formic acid was added, the mixture was cooled at 4 °C for 15 min, and then it was heated at 95 °C for 5 min. The reaction mixture was passed through a 0.45-μm microfilter. The reaction product, 1-methyl-7-phenyl-1,5-dihydro-5-oxo-1, 6-naphthyridine, was analyzed by injecting into the HPLC system. 32 The method used a Tosoh ODS 80 Ts (particle size 5 μm, 250 mm × 4.6 mm i.d.) column eluted with a mixture of 30 mmol/L KH2PO4 (pH adjusted to 3.0 by the addition of H3PO4) containing 1 g of sodium heptanesulfonate: acetonitrile (10:3, v/v) at a flow rate of 1.0 mL/min. The MNA derivative was measured at an excitation wavelength of 382 nm and an emission wavelength of 440 nm, and the column temperature was 40 °C. The total analysis time was 10 min. The derivative of MNA was eluted at ≈6 min under these conditions.
Nam, 2-Py and 4-Py
For the simultaneous measurements of Nam, 2-Py, and 4-Py in blood, 0.4 mL of whole blood was added to 0.4 mL of 10% TCA and treated using the method described for Trp. For the simultaneous measurements of Nam, 2-Py, and 4-Py in blood and urine, Nam, 2-Py, and 4-Py in the acidified samples were extracted into diethyl ether under saturated K2CO3 conditions. The Nam, 2-Py, and 4-Py in the extracted solution were passed through a 0.45-μm microfilter, and measured simultaneously by a HPLC method described previously 31 This method employed a Chemcosorb 7-ODS-L (particle size 7 μm, 250 mm × 4.6 mm i.d.) column eluted with 10 mmol/L KH2PO4:acetonitrile (96:4, v/v; with pH adjusted to 3.0 by the addition of concentrated H3PO4) at a flow rate of 1.0 mL/min. The UV detector was set at 260 nm, and the column temperature was 25 °C. The total analysis time was 15 min. Nam, 2-Py, and 4-Py were eluted at ≈5.8, 6.8 and 9.0 min under the conditions, respectively.
2-OAA
For the measurement of 2-OAA in plasma, 0.4 mL of plasma was added to 0.4 mL of 10% TCA and treated using the method described for Trp. For the measurement of 2-OAA in the acidified samples, the sample was reacted with 1,2-diamino-4,5-methylenebenzene to produce a fluorescent derivative. 34 The reaction mixture was passed through a 0.45-μm microfilter and the reaction product (for blood, 50 μL; for urine, 50 μL) was separated using a Tosoh ODS-80 Ts (particle size 5 μm, 250 mm × 4.6 mm i.d.) column with 20 mmol/L of KH2PO4-K2HPO4 buffer (pH 7.0) containing 26% methanol at a flow rate 0.8 mL/min. The excitation wavelength of detection was 367 nm and the emission wavelength was 446 nm. The column temperature was maintained at 40 °C. The total analysis time was 50 min. 2-OAA was eluted at ≈15 min under these conditions.
5HT and 5-HIAA
For the simultaneous measurement of 5-HT and 5-HIAA in blood, 20 μL of whole blood was added to 0.98 mL of cold 5% TCA containing 0.1% cysteine and 0.06 μg/mL 5-hydroxy-Nω-methyltryptamine (M-5-HT; used as an internal standard), and the resulting supernatant was used as an sample for measuring 5-HT and 5-HIAA. The acidified urine (50 μL) was treated with 0.95 mL of cold 0.6 mol/L perchloric acid containing 0.1% cysteine and 1.07 μg/mL M-5-HT. Each of the diluted mixtures was mixed for 10 min, allowed to stand for 5 min and then centrifuged at 10,000 × g for 3 min at 4 °C. The resulting supernatants were passed through a 0.45-mm filter, and each aliquot (20 μL) was analyzed directly by HPLC. 33 For the analysis of blood samples, the following conditions were used: column, 7-ODS-L (particle size 7 μm, 250 mm × 4.6 mm i.d.); mobile phase, 40 mmol/L KH2PO4 containing 3 mg/L of EDTA-2 Na (pH 4.5):methanol (9:1, v/v); flow rate, 1.0 mL/min. The applied voltage was set to +600 mV. The column temperature was maintained at 40 °C. The total analysis time was 20 min. 5-HT, M-5-HT (internal standard), and 5-HIAA were eluted at ≈10, 11.5 and 13 min under these conditions, respectively. For the analysis of urine samples, the following conditions were used: column, 5-ODS-H (particle size 5 μm, 150 × 4.6 mm i.d.); mobile phase, 40 mmol/L KH2PO4 containing 3 mg/L EDTA-2 Na and 100 mg/L sodium octanesulfonate (pH adjusted to 3.5 by the addition of H3PO4): methanol (8:2, v/v); flow rate 0.7 mL/min. The applied voltage was set to +600 mV. The column temperature was maintained at 40 °C. The total analysis time was 20 min. 5-HIAA, 5-HT, and M-5-HT (internal standard) were eluted at ≈11, 15 and 16.5 min under these conditions, respectively.
Vitamin B2
For assessment of the nutritional status of vitamin B2, we measured the contents of vitamin B2 in blood and urine. For measuring vitamin B2 in blood, 0.1 mL of whole blood was added to 0.44 mL of water and 0.26 mL of 0.5 mol/L H2SO4. The mixture was heated at 80 °C for 15 min, and then cooled to room temperature. The treated mixture was added to 0.2 mL of 10% TCA, and centrifuged at 10,000 × g for 3 minutes at 4 °C. The resulting supernatant (0.2 mL) was transferred in a glass tube and 0.2 mL of 1 mol/L NaOH was added. The alkalized mixture was irradiated with fluorescent light for 30 min at room temperature to convert riboflavin, flavin mononucleotide (FMN), and flavin adenine dinucleotide (FAD) into lumiflavin. The reaction was stopped by the addition of 20 μL of glacial acetic acid. The acidified mixture was passed through a 0.45-μm microfilter. The filtrate (20 μL) was injected directly into a HPLC system. 39 A Tosoh ODS 80Ts (particle size 5 μm, 250 mm × 4.6 mm i.d.) column eluted with a mixture of 7 mL of 1 mol/L NaH2PO4 (pH 5.5), 150 mL of acetonitrile, and 843 mL of water at a flow rate of 0.8 mL/minutes was used. Lumiflavin was measured at an excitation wavelength of 445 nm and an emission wavelength of 530 nm, and the column temperature was 40 °C. The total analysis time was 20 min. Lumiflavin was eluted at ≈14 min under these conditions. For the measurement of riboflavin in urine, the acidified urine sample was passed through a 0.45-μm microfilter. The filtrate (20 μL) was analyzed by injecting into the HPLC system. 40 The HPLC system was exactly the same as that used for measuring lumiflavin. The total analysis time was 20 min. Riboflavin was eluted at ≈9.3 min under these conditions.
Vitamin B6
For assessment of the nutritional status of vitamin B6, we measured the contents of vitamin B6 in blood and urine. For measuring pyridoxal phosphate (PLP), a coenzyme form of vitamin B6, 0.1 mL of plasma was added to 0.1 mL of 5% metaphosphoric acid. The mixture was agitated for 5 min at room temperature and then centrifuged at 10,000 × g for 3 min at 4 °C. The resulting supernatant (0.1 mL) was added to 50 μL of dichloromethane, agitated for 2 minutes at room temperature, and then centrifuged at 10,000 × g for 3 min at 4 °C. The supernatant obtained was passed through a 0.45-μm microfilter. The filtrate (20 μL) was analyzed by injection into the HPLC system. 41 This method involved using a Tosoh ODS 80 Ts (particle size 5 μm, 250 × 4.6 mm i.d.) column eluted with a mixture of 100 mmol/L NaH2PO4 (pH adjusted to 3.1 by the addition of H3PO4) and acetonitrile (95:5, v/v) at a flow rate of 0.7 mL/min. The column temperature was maintained at 35 °C. PLP separated under these conditions was treated with 22 mmol/L sodium chloride (used as a post-column reagent) delivered at a flow rate of 0.1 mL/min. The mixture was reacted by passing a coil (550 mm × 3 mm i.d.) heated at 75 °C. PLP was measured at an excitation wavelength of 325 nm and an emission wavelength of 425 nm. The total analysis time was 20 min. The derivative of PLP was eluted at ≈11.4 min under these conditions.
For measuring 4-PIC, a catabolite of vitamin B6 in urine, the acidified urine sample was passed through a 0.45-μm microfilter. The filtrate (20 μL) was analyzed via injection into the HPLC system. 42 This method involved using a Tosoh ODS 120 A (particle size 5 μm, 250 mm × 4.6 mm i.d.) column eluted with a mixture of 2.3 mL of 85% phosphoric acid, 100 mL of methanol, and 900 mL of water (pH adjusted to 2.2 by the addition of 50% NaOH at a flow rate of 1.0 mL/min). 4-PIC was measured at an excitation wavelength of 355 nm and an emission wavelength of 436 nm, and the column temperature was 30 °C. The total analysis time was 20 min. 4-PIC was eluted at ≈6.2 min under these conditions.
General biomarkers in blood
The whole blood collected was sent to Shiga Health Center and general biomarkers in blood were measured. Parts of 24-hour urine samples were sent to Mitsubishi Chemical Medience Corporation (Tokyo, Japan) and the contents of K+, Na+, and urinary urea nitrogen (UUN) were ascertained.
Statistical analyses
Mean values are reported in terms of mean ± SD. The significance of the differences in the mean values between the beginning and end of the experiment was tested using Student's two-tailed paired
Results
Characteristics of the subjects and intakes of major nutrients and Trp
The intakes of major nutrients and Trp are shown in Table 1. These values are the same as those for normal young Japanese women.
General biomarkers in blood and urine
The general biomarkers in blood and urine are shown in Table 2. These values were all within the normal range.
General biomarkers in blood and urine.

Blood
The blood contents of Trp and its metabolites, the vitamins involved in the metabolism of Trp, as well as vitamins B2 and B6 at the beginning and end of the experiment are shown in Table 3.
Contents of Trp and its metabolites, and vitamins B2 and B6 in blood of Japanese young women.
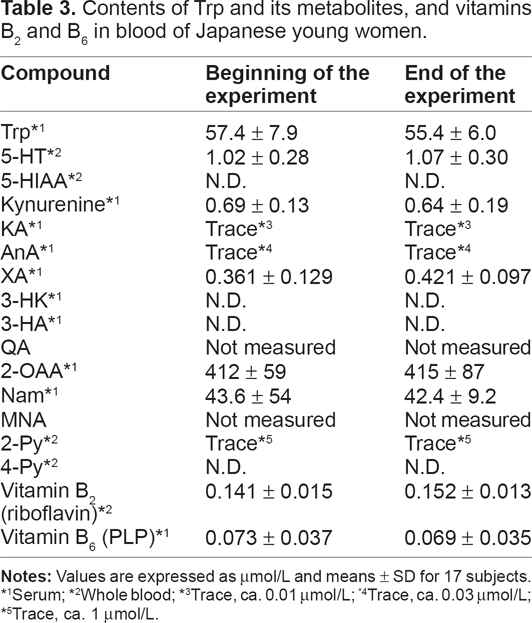
Serum;
Whole blood;
Trace, ca. 0.01 μmol/L;
Trace, ca. 0.03 μmol/L;
Trace, ca. 1 μmol/L.
The blood concentrations of Trp were almost similar and the value was ≈55 μmol/L.
The serotonin concentration was ≈1 μmol/L, whereas that of 5-HIAA was under the limit of detection.
Intermediates such as kynurenine, KA, AnA, 3-HK, XA, 3-HA and QA were very low, at trace levels, or under the limit of detection.
The level of 2-OAA, which is an intermediate of lysine as well as Trp, was relatively high (≈400 μmol/L).
The concentration of Nam (ie, the sum of the contents of the free type of Nam and the coenzyme forms of Nam, NAD(P)+ and NAD(P)H was ≈40–45 μmol/L. The amounts of Nam catabolites such as 2-Py and 4-Py were at trace levels or under the limit of detection.
The concentrations of vitamin B2 and PLP, a coenzyme form of vitamin B6, were within normal ranges (vitamin B2 ≈ 150–200 nmol/L; PLP ≈ 50–70 nmol/L).
Urine
The average daily urine volume was 1,127 ± 449 mL in 17 subjects. The daily creatinine excretion was 11.1 ± 3.6 mmol/day.
The urinary excretion of vitamin B2 and 4-PIC, a catabolite of vitamin B6, were 407 ± 270 nmol/day and 3.38 ± 0.88 μmol/day, respectively.
The urinary excretion profiles of Trp and intermediates of the kynurenine pathway are shown in Supplemental Fig. 1. The average urinary excretion amounts are shown in Table 4.
Relationship between urinary excretion of Trp and each of Trp metabolite.

Values are presented as μmol/d, and the average ± SD for the urine samples in 17 subjects;
β stands for a number in the slope of the linear equation between the excretion amount of Trp and the urinary excretion amount of each of the Trp metabolite);
Pearson correlation coefficients were calculated to determine the relationship between the urinary excretion amount of Trp and the urinary excretion amount of each Trp metabolite.
The urinary excretion profiles of 5-HT and its catabolite 5-HIAA are shown in Supplemental Figure 2. The average urinary excretion amounts are shown in Table 4.

The fate of Trp in Japanese young women.
The urinary excretion of 2-OAA is shown in Supplemental Figure 3. 2-OAA is not only a Trp metabolite but also a metabolite of lysine. The average urinary excretion of 2-OAA was 46.4 ± 11.4 μmol/day (Table 4).
The urinary excretion of Nam and its catabolites reflects not only Trp intake but also the intake of Nam itself. The urinary excretion of Nam was very low (0.42 ± 0.20 μmol/day) and near the limit of detection (Supplemental Fig. 4A). The excretions of catabolites such as MNA and 2-Py were relatively high compared with those of other Trp metabolites (Supplemental Fig. 4B and C). The average urinary excretion amounts of MNA and 2-Py were shown in Table 4. The excretion of another catabolite, 4-Py, was not high (6.58 ± 1.31 μmol/day).
The fate of Trp
Figure 2 summarizes the fate of Trp in young Japanese women. The values were calculated using a comparison of the intake of Trp and the urinary excretion of Trp and each of its metabolites at day 22.
The mean basal intake of Trp was 3328.4 μmol/day, namely 0.7 g/day. The urinary excretion percentage of Trp to the intake of Trp was 1.5% in a molar ratio, whereas that of kynurenine excretion was 0.2%, that of AnA was 0.04%, that of KA was 0.3%, that of 3-HK was 0.15%, that of XA was 0.07%, that of 3-HA was 0.2%, that of QA was 0.5%, that of 5-HT was 0.1%, that of 5-HIAA was 0.6%, and that of 2-OAA was 1.5%.
Relationship between urinary excretion of Trp and each Trp metabolite
Table 4 shows the relationship between the urinary excretion amount of Trp and the urinary excretion amount of each of the Trp metabolites, including 5-HT, 5-HIAA, kynurenine, KA, AnA, XA, 3-HK, 3-HA, QA, 2-OAA, Nam, MNA, 2-Py, and 4-Py. The association between the urinary excretion amount of Trp and the amount of each of these metabolites was not significantly different.
Discussion
As described above, there are physiologically important intermediates in the Trp pathway. Therefore, several investigators have developed analytical methods 43 to reveal the fate of Trp in humans.11,15–24,44 They have demonstrated that the abnormal increase in Trp metabolites such as XA in the urine of vitamin B6-deficient or vitamin B6-dependent individuals usually follows a Trp load of 2 g. 21 The level of another intermediate of Trp, 3-HK, is known to increase in cases of active tuberculosis, fever of various types, leukemia, multiple myeloma lymphosarcoma, and Hodgkin's disease. 45 Furthermore, deficiency of vitamin B2 causes an increase in the urinary excretion of AnA because the enzyme kynurenine hydroxylase needs FAD as a coenzyme. 46 However, techniques to allow adequate quantitative measurements have not been fully developed, because all of these reports were published before 1980. In particular, the data about the fate of Trp at the basal level (ie, the fate of Trp without Trp loading) are considered unreliable. Recently, modern chromatographic separation of Trp and its metabolites has been reported.47–49 Shibata and co-workers25–34 developed HPLC measurements of Trp and its metabolites in urine samples, gradually modified these methods, and recently developed the HPLC measurement of 2-OAA, which is an intermediate of the Trp-glutarate pathway. Now, we can measure the levels of Trp, 25 5-HT, 33 5-HIAA, 33 kynurenine, 26 AnA, 27 KA, 28 XA, 30 3-HA, 30 3-HK, 29 QA, 38 Nam, 31 MNA, 32 2-Py, 31 4-Py 31 and 2-OAA 34 in urine and blood. In addition, we can measure the contents of riboflavin39,40 and 4-PIC (a catabolite of vitamin B6) 42 in urine and also measure the level of total vitamin B2 (ie, the sum of the free forms of riboflavin, FMN, and FAD) in blood, and PLP in plasma. 37 Therefore, we were able to investigate the fate of Trp in human subjects who ate self-selected food and lived freely, using these analytical methods.
The young Japanese women took ≈ 0.7 g/day (3,300 μmol/day) of Trp. They excreted ≈ 40 μmol of Trp per day, which accounted for 1.5% of ingested Trp. The respective quantities were: kynurenine, ≈ 4 μmol/day, 0.2%; AnA, ≈ 1.0 μmol/day, 0.04%; KA, ≈ 10 μmol/day, 0.3%; 3-HK, ≈4 μmol/day, 0.15%; XA, ≈ 3 μmol/day, 0.07%; 3-HA, ≈ 5 μmol/day, 0.2%; QA, ≈ 20 μmol/day, 0.5%; 5-HT, ≈ 4 μmol/day, 0.1%; 5-HIAA, ≈ 20 μmol/day, 0.6%; and 2-OAA, ≈ 50 μmol/day, 1.5%. The ratios of the urinary excretions of Nam, MNA, 2-Py and 4-Py could not be calculated because the subjects took Nam itself from their food. The values obtained from the methods reported previously11,15,17,22,23 gave higher values for Trp metabolites than the values reported in the present study. The blood contents of Trp metabolites such as kynurenine, AnA, KA, XA, 3-HK, 3-HA, and 5-HIAA were under the limit of detection.
In 1971, Leklem 22 reviewed the quantitative aspects of Trp metabolism in humans. It was found that the mean excretion of kynurenine was 10 and 14 μmol/day, KA was 12 and 23 μmol/day, XA was 9 and 15 μmol/day, 3-HK was 12, 27 and 40 μmol/day 3-HA was 20 and 50 μmol/day, and QA was 27 and 46 μmol/day. Donald and Bosse 50 reported that American college-aged women excreted kynurenine that was under the limit of detection, with the rate of excretion for KA being ≈ 10 μmol/day, and the rate of excretion for XA being ≈ 9 μmol/day.
The subjects participating in the present study were typical young Japanese women with normal anthropometric characteristics and habitual intake of energy and nutrients. 2 The mean intake of Trp during the survey period of 22 days was ≈700 mg/day, which was estimated by a self-administered DHQ.36,37 This was higher than the estimated average requirement of Trp 300 mg/day. 51 The intakes of vitamins B2 and B6 (which are involved in Trp metabolism) were also higher than the recommended dietary allowance. 2 General biomarkers in blood and urine in the subjects were all within normal ranges. Trp metabolism is known to affect female hormones;22,43 the data from the present study did not consider the physiological cycles of women.
Trp metabolism is known to be affected by disorders such as schizophrenia, 52 multiple trauma, 53 celiac disease, 54 alcoholism, 55 HIV infection, 56 malignant tumor disease, 57 cardiovascular disease, 58 and hormones such as steroid hormones. 59 In the present study, the relationship between the urinary excretion of Trp and each of the Trp metabolites was not significantly different, suggesting that the fate of Trp in healthy humans remained constant. The HPLC methods developed and modified by our research team were found to be suitable for determining the fate of Trp via kynurenine, 5-HT, Nam, and glutaric acid pathways.
Conclusion
The HPLC methods developed and modified by us were found to be sophisticated techniques for determining the fate of Trp via kynurenine, serotonin, nicotinamide, and glutaric acid pathways.
Funding
This investigation was part of the project “Studies on the nutritional evaluation of amino acids and B-group vitamins” (principal investigator, Katsumi Shibata), which was supported by a Research Grant for Grants-in-Aid for Scientific Research from Japan Society for the Promotion of Science. This study was also part of the project entitled “Development of an index of metabolic upper intake level instead of tolerable upper intake level of tryptophan for humans” (principal investigator, Katsumi Shibata), which was supported by The International Council on Amino Acid Science (ICAAS) Research Funding.
Competing Interests
Author(s) disclose no potential conflicts of interest.
Author Contributions
The authors' responsibilities are as follows: CH, TF, and KS designed research; CH conducted research; CH and KS analyzed data; CH and KS drafted the paper; KS had primary responsibility for final content. All authors read and approved the final manuscript. The authors declare that they have no conflict of interest.
Disclosures and Ethics
As a requirement of publication author(s) have provided to the publisher signed confirmation of compliance with legal and ethical obligations including but not limited to the following: authorship and contributorship, conflicts of interest, privacy and confidentiality and (where applicable) protection of human and animal research subjects. The authors have read and confirmed their agreement with the ICMJE authorship and conflict of interest criteria. The authors have also confirmed that this article is unique and not under consideration or published in any other publication, and that they have permission from rights holders to reproduce any copyrighted material. Any disclosures are made in this section. The external blind peer reviewers report no conflicts of interest.