
Abstract
Tryptophan metabolism is directly involved with B-group vitamins such as vitamin B2, niacin, and vitamin B6, and indirectly with vitamin B1 and pantothenic acid. We evaluated the validity of requirements of B-group vitamins set by the
Introduction
The vitamin niacin can be synthesized from the essential amino acid tryptophan (Trp). 1 B-group vitamins are involved in the metabolism of Trp: the pyridoxal 5′-phosphate (PLP)-dependent enzyme kynureninase,2,3 the flavin adenine dinucleotide-dependent enzyme kynurenine 3-monooxygenase (which needs the reduced form of nicotinamide adenine dinucleotide phosphate as a coenzyme),4,5 and the PLP-dependent enzyme kynurenine aminotransferase 6 (Fig. 1).

Trp to QA and related pathways for B-group vitamins. ACMS, α-amino-β-carboxymuconate-∊-semialdehyde; AMS, α-aminomuconate-∊-semialdehyde; NaMN, nicotinic acid mononucleotide; PRPP, 5-phosphoribosyl-1-pyrophosphate. (1) tryptophan 2,3-dioxygenase (TDO), (2) formylase, (3) kynureninase, (4) kynurenine 3-monooxygense, (5) kynurenine aminotransferase, (6) 3-hydroxyanthranilic acid 3,4-dioxygenase (3-HADO), (7) α-amino-β-carboxymuconate-∊-semialdehyde decarboxylase, (8), non-enzymatic reaction (occurs spontaneously), (9) quinolinic acid phosphoribosyltransferase.
After ingestion of Trp, riboflavin-deficient rats were shown to excrete abnormally high amounts of anthranilic acid (AnA) and kynurenic acid (KA).7,8 The reduced flux from the conversion of kynurenine to 3-hydroxykynurenine gives rise to the formation of KA and AnA. Rats deficient in vitamin B6 excrete abnormally large amounts of xanthurenic acid (XA). 9
Based on the information detailed above, we developed a method to evaluate the requirements of B-group vitamins set by the
The method proposed in this manuscript is for an evaluation of the necessity of B-group vitamins based on the individual Trp metabolism ability, and therefore, is applied to evaluate those in DRIs of many countries.
Methods
The study protocol was approved by the Ethics Committee of the University of Shiga Prefecture (Shiga, Japan) and was conducted according to the guidelines laid down in the Declaration of Helsinki. All subjects provided written informed consent to participate in the study after being informed of its protocol and purpose.
Chemicals
AnA and QA were purchased from Wako Pure Chemical Industries (Osaka, Japan). XA, KA, and 3-hydroxyanthranilic acid (3-HA) were purchased from Tokyo Chemical Industry (Tokyo, Japan).
Subjects
Male students and faculty members were recruited from the University of Shiga Prefecture. Participants diagnosed with a cold or influenza, and those who had taken multivitamin supplements at least once during the previous month, were excluded. All subjects were non-smokers and passed a standard medical examination at the university. Of the 12 apparently healthy male Japanese subjects who participated in this study, 10 subjects (age, 19–55 (mean ± standard deviation (SD), 26.8 ± 11.0) years) completed the study.
Study design
All subjects (
Breakfast consisted of bread (126 g), butter (7 g), ham (38 g), yoghurt (90 g), tomatoes (40 g), lettuce (40 g), and milk (200 mL). Lunch comprised rice (300 g), toasted and seasoned laver (1.4 g), luncheon meat (95 g), boiled egg (55 g), raw cabbage (50 g), mayonnaise (10 g), miso soup (miso, 10 g), and Japanese tea (200 mL). Dinner consisted of rice (300 g), soy sauce-flavored Pacific saury (70 g), tofu (soybean curd) (150 g),
Composition of the diet fed to male Japanese subjects during the study.
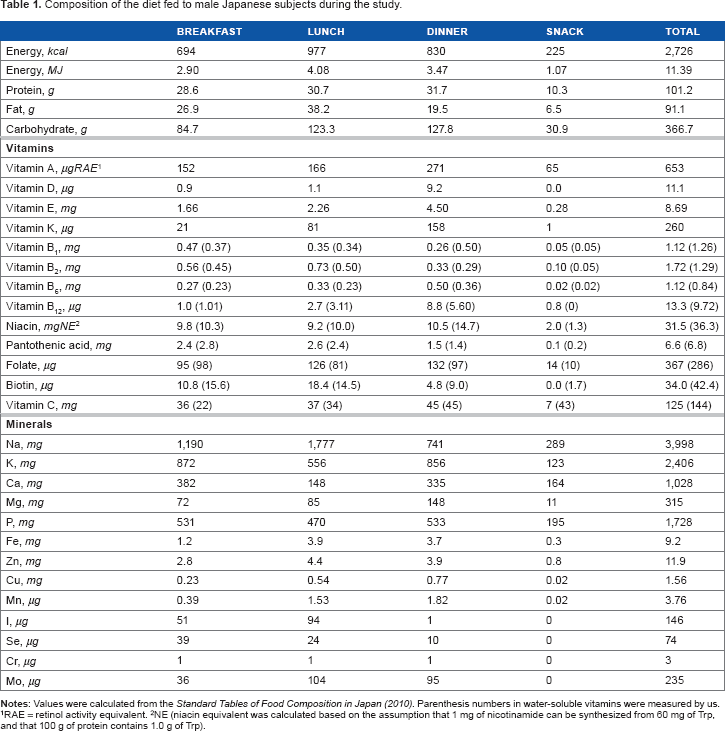
RAE = retinol activity equivalent.
NE (niacin equivalent was calculated based on the assumption that 1 mg of nicotinamide can be synthesized from 60 mg of Trp, and that 100 g of protein contains 1.0 g of Trp).
Subjects were allowed to drink natural mineral water freely (
Subjects consumed the diet from day-1 to day-5 each week. However, the dietary regimen was relaxed on day-6 and day-7 of each week. This period of 5 days was considered to permit attainment of a steady nutritional status for these vitamins.12,13 Approximately one-fold, three-fold, and seven-fold amounts of synthesized water-soluble vitamin mixtures as vitamin mixtures “α”, “β”, and “γ” as shown in the
Composition of the vitamin mixture administered during weeks 2, 3, and 4.

Pyridoxine hydrochloride was used and the value expressed as pyridoxine itself.
Ca pantothenate was used and the value expressed as pantothenic acid itself.
Relative biological values of synthesized vitamins against dietary vitamins are used: vitamin B1, 1.7; vitamin B2, 1.5; vitamin B6, 1.4; niacin, 1.7; pantothenic acid, 1.4; vitamin B12, 2.0; folate, 2.0; biotin, 1.3; vitamin C, 1. These values were taken from [39] and [40].
Twenty four-hour urine samples were collected on day-1 and day-5 of each week. That is, urine samples were collected on a total of eight occasions (days 1, 5, 8, 12, 15, 19, 22, and 26).
Analyses
Trp metabolites KA, 14 AnA, 15 XA, 16 3-HA, 16 and QA 17 were measured as described previously. In briefly, for the measurements of these compounds in urine, the acidified urine sample was passed through a 0.45-μm microfilter. The filtrate (20 μL) was injected directly into the respective HPLC systems.
Statistical analyses
Nonparametric Friedman test for repeated measures following Dunn's post test was used to analyze statistical differences. Intra- and inter-individual variations were calculated using analysis of variance. Pearson's correlation coefficients were calculated to determine the association between experimental days and the concentration of each compound detected in urine.
Results
Extent of urinary excretion of Trp metabolites
Figure 2 shows the mean changes in urinary excretion of AnA, KA, XA, 3-HA, and QA. Administration of a vitamin mixture did not affect urinary excretion of Trp metabolites. Urinary excretion amounts (mean ± SD, n = 80) of AnA, KA, XA, 3-HA, and QA were 1.7 ± 0.8, 11 ± 2.4, 3.7 ± 0.8, 6.6 ± 1.9, and 17 ± 4.6 μmol/day, respectively. Figure 3 shows the individual changes in urinary excretion of Trp metabolites. Table 3 shows the individual mean daily values of L-Trp metabolites collected eight times during the experimental period. These urine excretion amounts were observed differences among subjects. Intra-individual coefficient of variation (CV) of AnA, KA, 3-HA, and QA was 7, 18, 15, 17, and 49%, respectively. Inter-individual CV of AnA, KA, XA, 3-HA, and QA was 55, 80, 35, 61, and 71%, respectively. Intra-individual CV of these metabolites was lower than the inter-individual CV. As information, we showed “Supplemental Table 1”, which was shown the values in terms of creatinine.

Daily mean changes in urinary excretion of AnA (A), KA (B), XA (C), 3-HA (D), and QA (E) during the study. Each symbol represents the mean ± SD (n = 10). Week 1, diet only; week 2, diet with vitamin mixture “α” (two-fold); week 3, diet with vitamin mixture “β” (four-fold); week 4, diet with vitamin mixture “γ” (seven-fold).
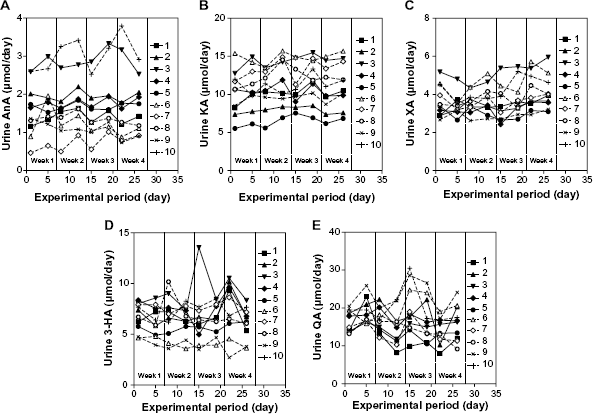
Individual daily changes in urinary excretion of AnA (A), KA (B), XA (C), 3-HA (D), and QA (E) during the study. Each symbol represents the value for each subject. The numbers in figure indicate the subject number. Intra-individual coefficient of variation (CV) of AnA, KA, 3-HA, and QA was 7.4, 17.7, 15.1, 17.4, and 48.9%, respectively. Inter-individual CV of AnA, KA, XA, 3-HA, and QA was 43.2, 79.8, 35.0, 61.1, and 71.3%, respectively.
Individual mean values of daily L-Trp metabolites collected eight times in male Japanese subjects.

Percentage urinary excretion of Trp metabolites
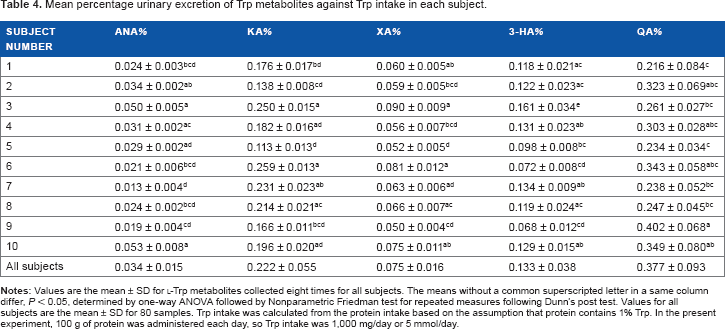
Trp intake was calculated from the protein intake based on the assumption that Trp content in protein is 1%. In the present study, 100 g of protein was administered every day, so Trp intake was 1,000 mg/day or 5 mmol/day Percentage urinary excretion (mean ± SD, n = 80) of AnA, KA, XA, 3-HA, and QA was 0.034 ± 0.015, 0.22 ± 0.055, 0.075 ± 0.016, 0.13 ± 0.038, and 0.38 ± 0.093% against the Trp intake, respectively. Table 4 shows the individual mean percentage urinary excretion. These were observed differences among subjects.
Mean percentage urinary excretion of Trp metabolites against Trp intake in each subject.
Association between each metabolite of Trp
Relationships between each metabolite of Trp were analyzed (Fig. 4). Direct proportional relationships were observed between AnA and 3-HA (Fig. 4C), KA and XA (Fig. 4E), and XA and 3-HA (Fig. 4H). An inverse proportional relationship was observed between 3-HA and QA (Fig. 4J).

Association between each metabolite of Trp. (A), AnA and KA; (B) AnA and XA; (C) AnA and 3-HA; (D) AnA and QA; (E), KA and XA; (F) KA and 3-HA; (G) KA and QA; (H), XA and 3-HA; (I) XA and QA; (J) 3-HA and QA. Pearson's coefficient and
Discussion
The metabolism of the Trp–QA pathway is affected by female hormones,18–20 so the present study was conducted in male Japanese subjects. It is known that rats deficient in vitamin B6 excrete abnormally large amounts of XA. 2 Kynureninase is a PLP enzyme present in the soluble fraction. 9 Deficiency of vitamin B6 reduces the activity of this enzyme. Kynurenine aminotransferase is also a PLP enzyme 6 but its activity is tolerant to deficiency of vitamin B6 because the enzyme is localized in the inner membrane of mitochondria. 3 Thus, in vitamin B6-deficient rats, kynurenine is metabolized to 3-hydroxykynurenine, but the conversion of 3-hydroxykynurenine to 3-HA (catalyzed by kynureninase) decreases, 3 with the accumulated 3-hydroxykynurenine being metabolized to XA. It is well known that the urinary excretion of XA abnormally increases when a large amount of Trp is administered to rats and humans with a deficiency of vitamin B6. 9 But, we did not perform such a Trp administration experiment.
The concentrations of pyridine nucleotide coenzymes in liver, kidney, and other tissues are regulated by the point of nicotinamide phosphoribosyltransferase reaction which gets a feed-back regulation by NAD+; nicotinamide phosphoribosyltransferase is inhibited by a physiological concentration of NAD+ in all tissues. 21 Thus, the tissue concentrations of pyridine nucleotide coenzymes are kept constant. Even if nicotinamide itself is administered, the concentrations of tissue pyridine nucleotide coenzymes do not increase. Therefore, administration of vitamin mixture in the present experiment might not affect the activities of kynurenine 3-monooxygenase which needs NADPH as a coenzyme, and of Trp 2,3-dioxygenase which is inhibited by high concentration of NADPH. 22
We found that administration of B-group vitamins did not affect any of the amounts of Trp metabolites, regardless of the vitamin amounts. These results suggest that a deficiency of vitamins affects Trp metabolism, but that surplus administration of vitamins does not have any effect on Trp metabolism. These observations show that the intake levels of B-group vitamins set by
Previously, we reported that the young Japanese women consumed ≈0.7 g/day (3.5 mmol/day) of Trp. 23 Comparisons between Japanese men and women are not precise. However, differences in the results of dietary Trp were not observed between men and women. 23
The most striking proportional relationship was obtained between urinary levels of KA and XA. The reactions kynurenine ↠ KA and 3-hydroxykynurenine ↠ XA are catalyzed by the same enzyme: kynurenine aminotransferase. This might be one of the reasons why a close relationship was observed. Differences were observed in the urinary excretion amounts of KA and XA among subjects, so genetic differences in the expression of kynurenine aminotransferase might exist. A moderate proportional relationship was observed between urinary levels of AnA and 3-HA, which may be because the reactions kynurenine ↠ AnA and 3-hydroxykynurenine ↠ 3-HA are catalyzed by the same enzyme: kynureninase. A proportional relationship was also observed between urinary levels of XA and 3-HA, both of which arise from 3-hydroxykynurenine. Formation of XA and 3-HA might be dependent upon the formation of 3-hydroxykynurenine.
Conversely, a weak inverse proportional relationship was observed between urinary levels of 3-HA and QA. This phenomenon is interesting and may be related to the organ-to-organ relationship in Trp metabolism. Terakata et al. 24 showed that the urinary excretion ratio of QA/3-HA (99.1/21.3 nmol/day) was 4.7 in wild-type mice and was 0.35 (18.5/53.3 nmol/day) in tryptophan 2,3-dioxygenase-knockout (TDO-KO) mice. The lower ratio denotes lower TDO activity in the liver. In TDO-KO mice, the liver cannot synthesize 3-HA from Trp because TDO (the initial enzyme of the Trp–kynurenine pathway in the liver) is absent. Thus, hepatic 3-HA in TDO-KO mice originates from extra-hepatic tissues. 3-Hydroxyanthranilic acid 3,4-dioxygenase (3-HADO) activity is > 1000-fold higher than that of the other enzymes associated with Trp metabolism in the liver. 25 Therefore, even if 3-HA is formed in the liver, all of it is metabolized to α-amino-β-carboxymuconate-∊-semialdehyde (ACMS). As a result, if the Trp–kynurenine pathway in the liver is operating well, accumulation of 3-HA does not occur and urinary excretion of 3-HA is negligible. Furthermore, QA is synthesized from 3-HA by the catalysis of 3-HADO in the liver, but the direct product is not QA, it is ACMS. One part of ACMS that could escape from the attack of α-amino-β-carboxymuconate-∊-semialdehyde decarboxylase undergoes cyclization to form QA (see Fig. 1). This spontaneous and non-enzymatic reaction occurs only in the liver because 3-HADO is present in large quantities only in the liver. 24 Hence, the origin of urinary 3-HA is extra-hepatic tissues and that of QA is the liver. The liver can incorporate exogenous 3-HA but not kynurenine and 3-hydroxykynurenine released from extra-hepatic tissues. 26 The inverse relationship that we observed suggests that QA formation is controlled by 3-HA incorporation into the liver from extra-hepatic tissues (Fig. 5).

Proposed metabolism of Trp-QA in humans. Solid lines denote the metabolic reaction. Dotted lines indicate the flow of transport. TDO, tryptophan 2,3-dioxygenase; 3-HADP, 3-hydroxyanthranilic acid 3,4-dioxygenase; ACMSD, α-amino-β-carboxymuconate-∊-semialdehyde decarboxylase; IDO, indoleamine 2,3-dioxygenase. Closed circle is a 3-HA transporter into the liver from extra-hepatic tissues.
Trp metabolism is known to be affected by disorders such as schizophrenia, 27 multiple trauma, 28 celiac disease, 29 alcoholism, 30 HIV infection, 31 malignant tumors, 32 cardiovascular disease, 33 and hormones (eg, steroid hormones). 34 Rayne et al. 30 reported that an increase in dietary levels of niacin are correlated significantly with increases in levels of KA and XA in humans. However, our research team could not reproduce such results in humans 35 or rats. 36 That is, addition of niacin did not elicit increases in urinary excretion of KA and XA.
Surplus administration of B-group vitamins above the required amount did not elicit beneficial effects on the metabolism of Trp to QA. That is, we clarified that if the intake of B-group vitamins is of the required amount, the Trp–QA pathway operates within homeostasis. The values presented here, and those in a previous report,
23
provide a reference value of each Trp metabolite. In addition, we reported that supplementation of healthy women with ≤5.0 g/day of L-Trp confers no adverse effects.13,37 In those studies,13,37 urinary excretion amounts of vitamin B2 and 4-pyridoxic acid (catabolite of vitamin B6) did not change even when subjects (who we administered intake levels of B-group vitamins set by the
Conclusion
Administration of vitamin mixtures did not have an effect on the Trp metabolites AnA, KA, XA, 3-HA, and QA between male Japanese subjects. These results show that intake levels of B-group vitamins set by the
Footnotes
Author Contributions
KS designed the study and drafted the manuscript. KS, JH, TF carried out the experiments. JH, TF reviewed the manuscript and helped in the study design. All authors approved the final manuscript.