
Abstract
We assessed the contribution of selected built environment factors to body weight in a pilot study in urban Visakhapatnam, South India. Participants were 123 men and 60 women (age 16 to 69 years; BMI 17.3–30.5) who had lived in the area for at least 3 years. Individuals with lower BMI tended to be (a) working people (non-home based–-working away from home), (b) non-vegetarians, (c) physically active (activity mostly related to work), and (d) taking afternoon siestas. Psychological stress, quality of life and wellbeing data were used from an earlier study of individuals with diabetes mellitus. The measures included were depression, anxiety, energy, positive wellbeing, satisfaction, impact, and social worry and diabetes worry (Diabetes quality of life). Guttman's Smallest Space Analysis (SSA) suggested the relationships among the psychosocial measures can be accounted for by one facet with three axial sets of variables (a) positive wellbeing and energy, (b) satisfaction, impact, and social worry and diabetes worry, and (c) anxiety and depression. SSAs on male participants suggested that fasting blood glucose and weight were most closely associated with anxiety and energy levels. In female participants, weight and fasting glucose were most closely associated with energy and to a somewhat lesser extent with anxiety. In both sexes, age was closely associated with positive wellbeing. Also in both sexes, age, weight, and fasting glucose levels were closely associated with each other. The results support the importance of understanding the impact of built environment and psychosocial factors on body weight in diabetic individuals for designing prevention strategies.
Introduction
Diabetes mellitus is rampant in India and has shown a worsening trend in the past few years1–3 making it imperative that preventive measures must be initiated to stem the epidemic. 4 Studies 5 in some developed countries have shown that built environment contributes to obesity and diabetes mellitus, suggesting that structuring the urban living environment may be a highly cost-effective way to curb the rise of these ailments. The urban sprawl in cities was a response to physically separate the work place from place of residence when environmental pollution and proximity leading to infectious diseases were prominent concerns. However, spread-out living has been implicated in obesity and its attendant complications. The rapid urbanization in India calls for learning about the adverse physical and social effects of urbanization from the West if it is to avoid the same effects.
Built environment of a region is an outcome of complex interactions of its geographical setup, socio-cultural, economic, technological advancements, natural resources, and other factors. Thus it is important to identify elements of the built environment which impact the behavior of the people in a given region. Therefore, we conducted a pilot study to assess the contribution of selected built environment factors to body weight in an urban area of Visakhapatnam. Specifically, the study was designed to examine which of the various activities of people in the city of Visakhapatnam were predictive of body weight. The study also examined the association of body weight and selected psychosocial variables that pertain to everyday stress, quality of life and psychosocial wellbeing.
Method
Study area
Participant selection
Individuals (age range 16–69) who had lived in the area for at least 3 years were selected from randomly selected households in all residential plots in the two sectors included in the study. If the plot had more than one residential unit, the first household was chosen for the study, the first time. However, for a subsequent plot, where the number of residential units also exceeded one, the second home was chosen. For example, if the nth residential plot consisted of four units; the 1st home in the plot was selected the first time. In the subsequent plot having say two units the 2nd home was chosen. And if the plot had 1 unit, the 1st home was selected and so on. If a selected plot was empty or abandoned, the household in the next randomly numbered plot was selected.
Procedure
Daily activity levels of people living in the colony on a typical day were ascertained by means of a selfreport questionnaire. Data on the energy consumed and energy utilized by the participants were obtained for the purposes of correlating them with Body Mass Index (BMI).
Dependent variable
Body Mass Index was calculated by dividing body weight in kilograms by the square of the height in meters.
Proxy variables
Five proxy variables were derived from the questionnaire: nature of employment (home based or non-home based), Professional Activity (PRA), Shift Work, Sleep, and nature of diet (vegetarian or nonvegetarian).
Nature of employment
Participants were classified as home based (HB) or Non-Home Based (NHB). The latter included participants who had to travel some distance from home either for work or educational purposes.
Professional activity
Professional activity was defined as the major activity a person engages in during the day–-that is, the activity that takes up most of the person's time either at workplace or at home. The conventional 8-hour workday was most prevalent in the sample studied. There were few exceptions where workdays ranged between ± 2 hours of the conventional workday. The participants were divided into four categories based on their metabolic levels of activity as follows: Sedentary (90–150 KCAL/H); Moderately Active (151–300 KCAL/H); Active (301–480 KCAL/H); and Very Active (481–750 KCAL/H).
Shift work
Participants were categorized as working in General Shift from 8.00/9.00 AM to 4.00/5.00 PM and those working in shifts with constant change of timings.
Siesta
Afternoon naps were rated as 2 for less than 1 hour (considered healthy) and 1 for any other duration of time. Participants were divided into two categories–-those who engaged in afternoon siestas and those who did not.
Nature of diet
Participants were categorized as vegetarians or non-vegetarians.
Psychosocial aspects
Considering that psychological stress could contribute to adverse effects of built environment, we evaluated different parameters of psychosocial factors observed in subjects (
Results
Built Environment and BMI
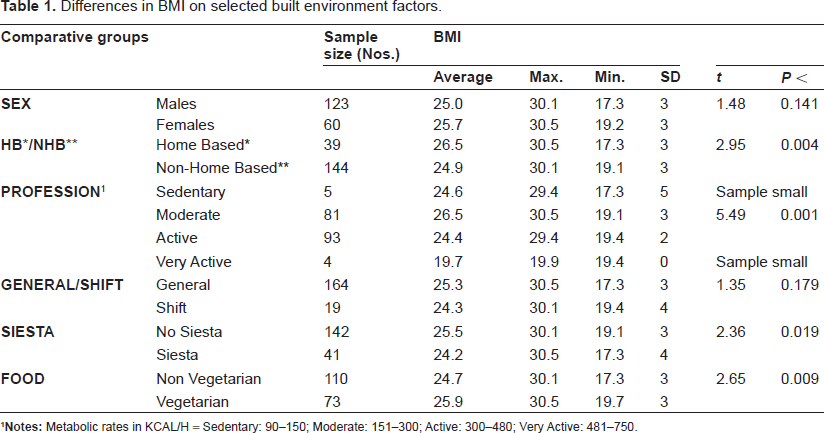
Table 1 summarizes the results of
Differences in BMI on selected built environment factors.
Psychosocial variables
As mentioned earlier, data were gathered from 241 diabetic individuals on 33 psychosocial, however, for the purposes of analysis only 11 variables were considered: Age, Sex, Weight (WT), Fasting Blood Sugar Levels (FBS), Depression (DEP), Anxiety (ANX), Positive Well-Being (PWB), Energy (ENE), Impact (IMP), Satisfaction (SAT) and Social and Diabetes Worry (SWDW). Given the large number of correlations, only correlations that were significant at the 0.01 level were considered. The correlation coefficients reported in Table 2 suggests that only sex was significantly correlated with weight with females reporting higher levels of weight. None of the psychosocial variables were correlated significantly with weight. Fasting Blood Sugar was correlated negatively and significantly with Satisfaction. Depression was correlated significantly and positively with Anxiety and Satisfaction, but negatively with Energy and Positive Wellbeing. Anxiety was correlated significantly and negatively with Energy and Positive Wellbeing. Satisfaction was correlated significantly and positively with Impact and Social and Diabetes Worry, and finally, Social and Diabetes Worry was correlated significantly and positively with Impact.
Correlation coefficients among psychosocial variables.
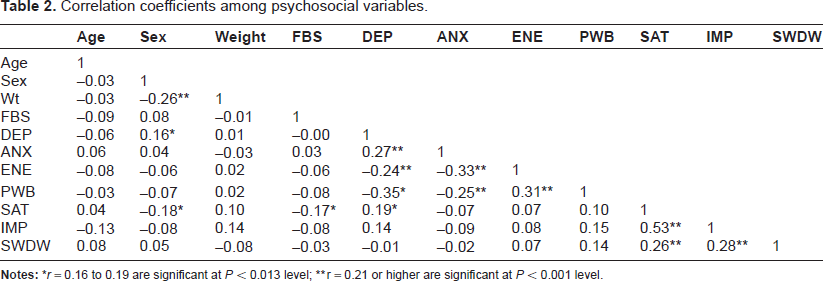
Notes:
r = 0.21 or higher are significant at
Further analyses were done using the Guttman's Smallest Space Analysis 7 to better understand the relationships among the various psychosocial variables.
The Weighted Smallest Space Analysis1 (WSSA1) procedure for a symmetrical matrix of observed relationships 6 was used to obtain facet diagrams. The WSSA1 minimizes the Euclidean distances among pairs of variables (depicted as points) in a multidimensional space in a two or three dimensional space. How well the representation fits the observed data is evaluated by means of a coefficient of alienation, ranging between 0 (best fit) and 1 (worst fit). Typically, values of 0.15 or lower for the coefficient of alienation are considered satisfactory for evaluating lawfulness in the data. However, it is possible that solutions with coefficient's of alienation 0.15 or lower are not interpretable for their lawfulness. Conversely, solutions of higher than 0.15 may indeed be interpretable. Two-dimensional solutions are preferred as they are more stable than 3-D, and “small dimensionality by itself is an empirical lawfulness and facilitates seeing more specific types of lawfulness in the data” (7: 140).
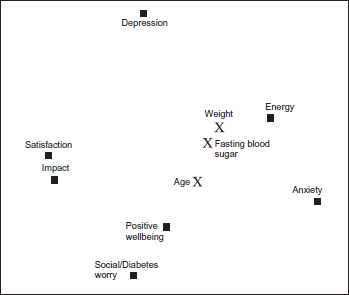
The SSA 2-Dimensional results on just the psychosocial variables (Coefficient of Alienation = 0.02, see Fig. 1) suggested one facet with three axial subsets of variables (a) Positive Wellbeing and energy, (b) Satisfaction, Impact, and Social worry and Diabetes Worry, and (c) Anxiety and Depression. While the correlational analyses reported earlier were generally in agreement with the SSA, the latter provided information on the rather different types of information that may be measured by the three sets of variables.
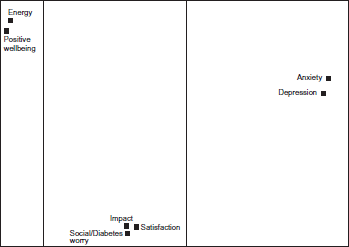
A 2-D SSA Representation of the structure of psychosocial variables.
Further SSA analyses were done with Age, Fasting Blood Sugar levels, and Weight as external variables to see how these variables related with the psychosocial variables separately for male and females. The SSAs on male (
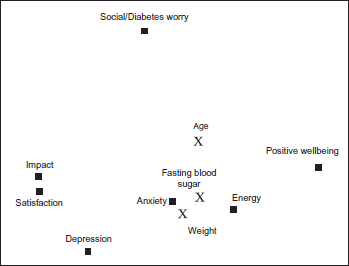
A 2-D SSA Representation Out of 3-D Examining Relationships Among 3 External Variables (Age, Fasting Blood Sugar, & Weight) and Psychosocial Variables (Males).
A 2-D SSA Representation Out 0f 3-D Examining Relationships Among 3 External Variables (Age, Fasting Blood Sugar & Age) and Psychosocial Variables (Females).
Discussion
Obesity and its related conditions such as the insulin resistance syndrome can and must be prevented. In this regard, implementing preventive lifestyle measures are most cost-effective. To ensure their implementation, the cities' architectural environment must be conducive to a way of life that provides adequate time for sleep, rest, relaxation, social interactions, and safe and efficient means of everyday transportation to work. We examined the effect of selected built environment and other factors on body weight in Muvvalavanipalem, a newly developed urban residential area in Visakhapatnam and a rapidly growing port city on the eastern coast of India. The city and its growth can be considered representative of the urban sprawl in developing countries and the governmental response to provide “well planned” living areas in hitherto farm lands. We observed higher BMI scores to be associated with home-based employment, moderate levels of professionally related physical activity vis-à-vis active levels, lack of afternoon sleep, and a vegetarian diet.
These results suggest that working away from home contributes to a more active everyday life, which in turn helps in regulating the BMI at lower levels. However, it also seems that it is important to balance activity with rest by taking an afternoon siesta to minimize the ill effects of everyday stress. The relationship of a vegetarian diet with BMI was unexpected and is worth examining in a future study in terms of not only what the diet contains, but its interactions with level of activity and psychosocial wellbeing and stress which are known influences in obesity and type 2 diabetes mellitus. 1
We further examined the relationships of different aspects of psychosocial well being and quality of life with body weight, fasting blood glucose levels, and age in a different cohort of individuals with type 2 diabetes mellitus. Two types of analyses were undertaken on psychosocial variables included in the study: (a) computing first order correlations between all pairs of variables (see Table 2), and (b) Guttman's Smallest Space Analysis (SSA), a multivariate procedure for examining the relationships among all of the variables simultaneously.
The first order correlations computed on both male and female participants seem to present a similar picture about the nature of relationships among the various psychosocial variables inasmuch as they suggest that that there are three key sets of psychosocial variable: (a) Positive Wellbeing and Energy; (b) Satisfaction, Impact, and Social Worry and Diabetes Worry, and (c) Anxiety and Depression. Separate SSAs on male and female participants (Figs. 2 and 3, respectively) suggest that Energy is most closely associated with Fasting Blood Sugar levels and Weight. This is understandable given that monitoring and regulating blood sugar levels and weight is of most concern in diabetes. Anxiety appears to be more closely associated with Fasting Blood Glucose levels and Weight in males than in females, but nevertheless important in both sexes. Age appears to be an important factor in participants' sense of positive well-being in both males and female participants even though the first order correlations were negligible. As the SSA for males and females suggest that Satisfaction and Impact are closely related–-higher levels of satisfaction with received medical care appears to lower the perceived negative impact of the disease, but these two variables seem less related to energy and anxiety levels. Thus assessing more general aspects of activity in everyday life influenced by built environment is important.
A study is needed which examines directly the impact of built environment factors on psychosocial factors. The underlying concept of adverse built environment is a chain of events where lower physical activity leads to obesity and related lifestyle diseases (Fig. 4).

Relationship of poor built environment and adverse health.
It is apparent that urban and streetscape design influence physical activity, but the relation between environment and lifestyle is broader, when considered in terms of energy balance (viz. consumption versus expenditure). 8 Such an approach is needed to environmental design for creating barriers (eg, making public transportation available at some distance from residential areas) to a non-active lifestyle and/or for fostering physical activity (eg, recreational parks with walking, running, bicycling paths) or more generally for promoting healthy lifestyle practices. 8 Changes in lifestyle would be difficult to sustain without relevant environmental structures which support such changes. For example, the ease of availability of highly calorie beverages in vending machines in schools would require a tremendous amount of will power on the part of children to resist drinking such beverages, a known influence in obesity. It will be simpler to make them less available or stock vending machines with low caloric beverages.
A recent projection suggests that the burden and costs of chronic diseases such as diabetes are increasing in developing countries. 9 With lifestyle modification being shown to be effective in preventing and delaying the onset of obesity and its attendant complications, efforts are being made to evaluate factors that make lifestyle changes difficult to adopt. More recently, researchers have been emphasizing the notion of Obesogenic environment which is defined as “the sum of influences that the surroundings, opportunities or conditions of life have on promoting obesity”. 10 Built environment and aspects related to daily living are crucial factors in fostering psychosocial activity and social cohesion.
Studies in India have shown that there is a difference in prevalence of risk factors for diabetes between urban and peri-urban areas: individuals from urban areas tended to having higher body mass index, waist circumference, hypertension and dyslipidemia 11 A more recent rural to urban migration study in India reported that migration was associated with rapid increases in obesity and diabetes, resulting in part from poor lifestyle habits such as lack of physical activity, 12 which are in turn affected by built environment factors. 13
However it should be apparent that urban migration per se may not be solely responsible, for example, in increasing adverse cardiovascular risk factors. Opportunities and barriers have a crucial role, as a Finnish study showed where poor lifestyle and health were more prevalent in the rural poor compared to urban and semi-urban areas. Educational background, physical activity and smoking were also responsible. 14 This underscores the necessary integration of social ecological model with multiple inputs. In other words, changes in built environment must be meshed with individuals' education and empowerment to make adequate use of the available facilities. 15 Focus must shift from high-risk approach to applying changes to the obesogenic built environment.16,17
Disclosure
This manuscript has been read and approved by all authors. This paper is unique and is not under consideration by any other publication and has not been published elsewhere. The authors and peer reviewers of this paper report no conflicts of interest. The authors confirm that they have permission to reproduce any copyrighted material.