
Abstract
This paper includes a conceptual framework for cell cycle modeling into which the experimenter can map observed data and evaluate mechanisms of cell cycle control. The basic model exhibits qualitative stability, meaning that regardless of magnitudes of system parameters its instances are guaranteed to be stable in the sense that all feasible trajectories converge to a certain trajectory. Qualitative stability can also be described by the signs of real parts of eigenvalues of the system matrix. On the biological side, the resulting model can be tuned to approximate experimental data pertaining to human fibroblast cell lines treated with ionizing radiation, with or without disabled DNA damage checkpoints. Together these properties validate a fundamental, first order systems view of cell dynamics.
Classification Codes: 15A68
Keywords
Introduction
The top-down goal this paper is synthesis of biological models that cogently explain and predict experimental data with simple and parsimonious use of mathematical equations and parameters. Pursuit of this goal has led to description of a linear dynamical system model that has a type of qualitative stability, a topic of theoretical interest in itself. The bottom-up goal, regarding our particular line of cell biology research, is to reveal from cell cultures the patterns of disturbance of cell cycle stages after exposure to ionizing radiation with the sequential timing and recovery rates of checkpoint arrests activated by responses to DNA damage.
More specifically, our top-down discovery is that a certain linear design for models of cell cycling is inherently stable in the sense that all trajectories (with initially positive values) must asymptotically approach one particular trajectory, namely, the trajectory that amounts to simple exponential growth as cells proliferate. We make use of the basic plan of cell cycling with four stages called G1 (gap 1, the state of cells that are metabolically active but not dividing), S (synthesis of new DNA), G2 (a second gap in the division cycle wherein cells have double copies of normal DNA molecules), and M (mitosis, the division of the cell and formation of two new cells in G1).
The topological consequence of the basic equations (patterns of signs of matrix entries as well as quantiative equality of pairs of entries) is that, given a particular but arbitrary choice of system coefficients, all trajectories with initially feasible (nonnegative and at least one positive) populations of cell cycle stages must converge to a common, exponentially increasing trajectory. Technically this means that all eigenvalues except one of the system matrix are guaranteed to have negative real parts, just by the layout of matrix entries; the exceptional eigenvalue must be real and positive. The common, exponentially increasing trajectory, called herein a canonical trajectory, describes a ray from the origin of four-space into the positive orthant.
Once a linear model captures canonical trajectory dynamics, it can be made nontrivial and highly nonlinear by addition of effects of ionizing radiation. That is, certain allowable functions will be used to describe transient reductions in the coefficients of rates of transfer from one stage to the next. The allowable functions are simple but sufficiently flexible to enable accurate, automatic approximations of experimentally determined effects of DNA damage and repair in cells.
The bottom-up discoveries are the necessary sequences and intensities of checkpoint arrests (partial or complete cessation of transfer of cells from one stage the next) for a successful model of cell cycle dynamics with DNA damage response.1–3 Cell cycle checkpoints represent natural points of control that ensure the proper order of cycle events, stabilize stalled or arrested DNA replication forks, activate apoptosis, and provide increased time for repair of DNA damage before DNA replication and mitosis. The importance of cell cycle checkpoints includes protection against carcinogenesis. A cell that fails to repair damaged DNA in a timely manner can be signaled to undergo apoptosis (cell suicide). Failure of this DNA quality assurance machinery can be the first step in development of a tumor. Thus understanding cellular DNA quality control is of great importance in oncology.
In more detail, Bartkova et al 4 reported that early precursor lesions in several tumor types commonly expressed markers of an activated DNA damage response. Gorgoulis et al 5 reported hyperplasias showing allelic imbalance at loci that are prone to DNA double-strand break formation (at common fragile sites), and proposed that, from its earliest stages, cancer development is associated with DNA replication stress, leading to DNA double-strand breaks and genomic instability. 6 Thus defects at cell cycle checkpoints have been associated with uncontrolled growth and accelerated carcinogenesis.7 It is therefore imperative to understand the mechanisms of DNA surveillance and repair functions and their failures during multistage development of cancer.
An early cell cycle model of Smith and Martin 8 used a simple transition probability for cells leaving G1 to undergo division. Subsequent models used two transition events to better fit experimental data. However, Boyd 9 found unavoidable discrepancies between experiments and transition models, and so devised a model based only on the assumption that the cell cycle is an ordered, deterministic sequence of chemical reactions. In parallel, other approaches have been explored using queuing theory or stochastic processes. 10 At each time step the material in one compartment is transferred according to a transition probability to the next compartment in a linear or circular processing system (arrival-departure or birth-death modeling). Indeed, we investigated hybridization of the two approaches to allow for substages such as early G1, late G1, etc, but we found that doing so added complexity (contrary to the top-down goal) and contributed little to quality of approximations of experimental data (contrary to the bottom-up goal). Thus the present paper reflects only the chemical reaction approach of Boyd. In its favor, Boyd's model was shown to fit data for the subsequent dynamics of a cell population following synchronization in G1 as well as the case in which all cells are initially distributed through the cell cycle but are subsequently prevented from leaving M. 9 Furthermore, Boyd's cell cycle model type has been more recently used in the application of engineering control theory to the important problem of scheduling fractionated cancer radiotherapy. 11
Regarding other types of sophisticated approaches, a number of cell cycle models have been developed that employ saddle-node bifurcations, investigating the view that cell cycling arises from bistable toggling. The seminal and representative work of Tyson et al12–14 includes dynamical systems and bifurcation diagrams. In a model employing Hopf bifurcations, Qu et al 15 considered some 13 signal species, proposed certain forms of differential equations, and listed 31 rate constants to construct a generic cell cycle model. Their dynamical system included positive and negative feedbacks that combine to exhibit limit cycle behavior. Pomerening et al devised a model cell cycle oscillator that exhibits hysteresis and bistability in the activation of Cdc2. 16
These and other models explain why cells cycle; another approach is to assume that cells do cycle in accord with mass action kinetics and coefficients of transfer among the cell cycle stages that vary according to cell treatments as fundamental variables (ignoring signal species). A notable example is the model of Ubezio et al 17 in which stages are subdivided by time (half-hour age classes), each with a coefficient giving the probability of advancing to the next stage. Their model successfully captured experimentally observed arrest in G1 as a response to low doses of several chemotherapy agents.
The model in the present paper employs only the four basic stages and transfer coefficients that are assumed to vary in response to treatment by ionizing radiation. Specifically, the coefficients drop, after tuneable time delays, to tuneable low levels, remain at the low levels for tuneable intervals, then exponentially recover to pre-treatment values. We find that, depending upon competence of checkpoint mechanisms, automatic computation of good fits of published experimental data generate checkpoint response curves with cogent interpretations. Thus fitting data of cell stage populations automatically and correctly predicts checkpoint behaviors described in the literature.
Our focus is on how in cellular response to ionizing radiation (IR)-induced DNA damage is reflected in some generalized manner by changes in transfer coefficient functions. The general shape of allowed coefficient functions is shown in Figure 1.
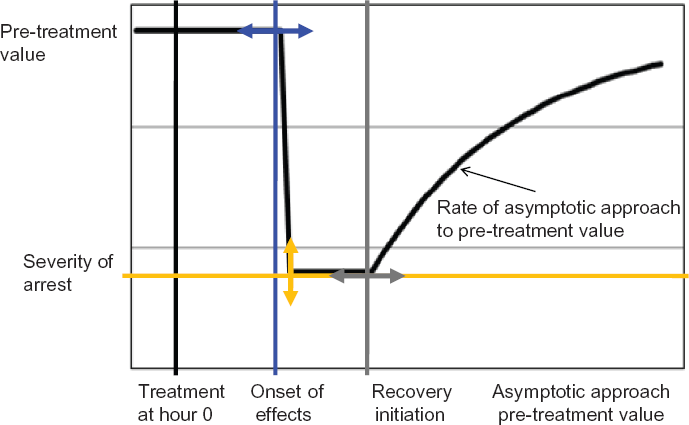
General form of a coefficient function considered to manifest response to stressful treatment and post-treatment recovery. The arrows indicate the types of flexibility allowed. Onset of effects can be at a variable time after treatment (blue double-ended arrow), and the coefficient is assumed to fall to zero or an adjustable positive value (orange arrow). The coefficient can begin recovery at the next time step or later (gray arrow). The exponential asymptotic approach rate to the pre-treatment level is a fourth variable.
We also appled the same model template to data from IR-induced responses in two other types of cells, namely, cells with somatic mutations that compromised p53 functions (allowing no impact of treatment on the G1/S rate) or compromised ATM functions (allowing reduced impact of treatment on the G2/M rate). These mutations of tumor cells occur frequently in melanoma. Fitting experimental trajectories anew required quantitative but not qualitative adjustments in the rate coefficient functions for G1/S, G2/M, and M/G1. Importantly, we found that few parameters must be tuned to accommodate the three types of experimental data points. Furthermore, the adjustments are clearly intrepretable in terms of successes or failures of known DNA damage response mechanisms.
Convenient computer models for all of the three cases are included in the supplement. Any interested reader can open and run them to observe the stated convergence.
Fitting Models and Experimental Data
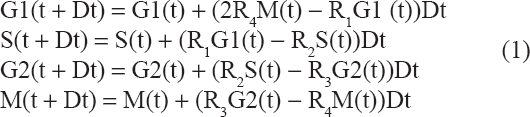
In difference equation format for cells populating G1, S, G2, and M, the Boyd model
9
can be represented by equation (1).
This is an application of mass action kinetics modeling 18 to idealized, exponential growth of proliferating cells. Senescent sequestration, apoptosis, and other mechanisms of cell removal from the proliferating population are not presently considered.
The rate at which cells depart a phase is the product of the population of cells in that phase with a coefficient; the coefficient in pre-treatment is assumed to be a constant and in post-treatment, a variable. The rate of change of untreated total T(t) cell count fits equation (2).

In the system (1), the {Ri} constants are constant rate coefficients that must be computed to achieve a given doubling rate and the four stage proportions. The number 2 in the first line of (1) reflects doubling as cells complete the mitosis phase. Thus (1) is a very simple model that captures exponential growth. By computer experiment, we found that sufficient numerical stability and accuracy of our models could be achieved by updating stages every 0.25 hours (h).
The untreated immortalized human fibroblasts in data forming the basis of this study were observed to double in cell number every ~24 h during exponential growth.
19
Suppose the initial total number T(0) of cells that double in 24 hours is normalized to one unit, and that typical fractions prior to treatment are determined from data to be as in (3).

These data are representative values. 19
To achieve doubling in 24 h with Dt = 0.25, equation (2) requires ε = 0.0145. This requirement plus the four equations in (1) lead to the matrix equation in (4) where {Ri} are per hour rate coefficients and the updates are every 0.25 hour.
The linear system (4) is solved by R1 = 0.077, R2 = 0.096, R3 = 0.314, R4 = 1.389. These are the default values of our model that ensure, in the absence of treatment, a doubling period of 24 h and the four constant proportions in (3). By direct substitution, a solution of (4) is automatically a solution of (1) in which every stage variable grows exponentially. Thus selection of four rate coefficients enables fitting of five criteria.
The stability of (1) can be described as follows. All four components of the default trajectory with constant proportions increase exponentially, reflecting instability in that sense. However, it can be shown that perturbing initial conditions from those proportions to other positive values and using sufficiently small Dt always results in asymptotic approach to the canonical trajectory (24-hour doubling of populations with chosen proportions). In fact, the very form of system (1) will be shown to be “qualitatively stable” in the sense that using any positive doubling period and any long-term proportions inevitably results in a model exhibiting asymptotic approach to such a default, canonical trajectory.
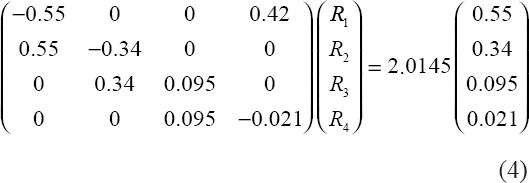
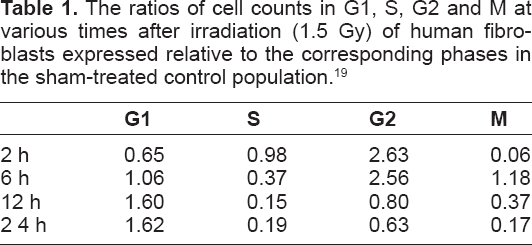
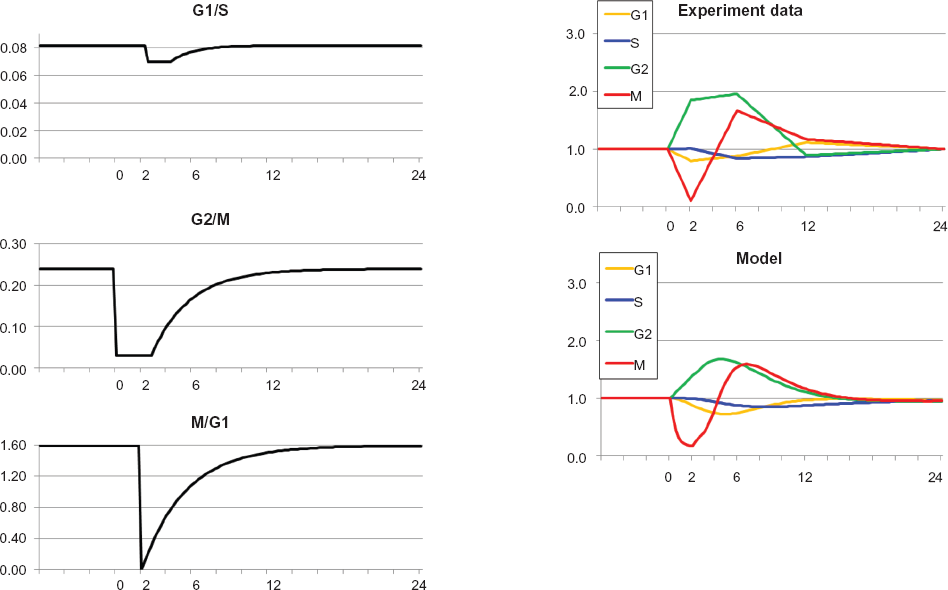
Regarding the effects of IR treatment, our starting point was distillation of experiments reported by Zhou et al 19 shown graphically as “irradiated” experimental data within Figure 2 (numerical data in Table 1).
Optimal approximation of model versus experiment for cells irradiated at time = 0. The model curve for G2 at times 2 h and 6 h is much smaller than the experimental value, but as noted in the text, it does not seem theoretically possible for experimental G2 at 2 hours to be more than 1.46 (shown as black square in model and irradiated graphs). Otherwise, model and experiment are in agreement. The sequence of arrests is G2/M, then G1/S, then M/G1. This sequence is absolutely essential to the quality of approximation. Also, G1/S arrest is not followed by any recovery for the duration of the experiment (24 h), again necessary for optimal approximation.
The ratios of cell counts in G1, S, G2 and M at various times after irradiation (1.5 Gy) of human fibroblasts expressed relative to the corresponding phases in the sham-treated control population. 19
The parameters of Figure 1 for each checkpoint must be tuned so that the model trajectories approximate the experimental values. Our definition of optimal approximation is as follows.
Optimal Approximation is achieved in general by starting with default, untreated parameters for all four rate coefficients. However, we discounted the S/G2 checkpoint, leaving 12 parameters to tune. We found that a time step of 0.25 h yielded stable, smooth-appearing trajectories. Smaller time steps are certainly possible but in our experience not beneficial. The quality of approximation is simply the sum of all the absolute values up to 24 hours of the differences of model values versus experimental values for G1, S, G2, M.
Initially all three rate coefficient functions are very simple: they drop to zero at time zero and stay at zero for the duration of 24 h. In a type of gradient descent approximation, all 12 parameters are thereafter allowed to change by a small, random amount. If such a step results in an improved (lower) error sum, then the new values for rate coefficients are kept; else, fresh random perturbations are selected. The descent terminates when many consecutive steps (such as 100) never result in a significant improvement in the sum.
The spreadsheets in the Supplement allow convenient, automatic implementation of this algorithm. Much more sophisticated approaches such as those described by Ljung 20 were not needed but could be used in more elaborate models.
The results of seeking an Optimal Approximation for the data for irradiated cells with fully functional checkpoints 19 are shown in Figure 2.
The fundamental state variables in Figure 2 were the ratios of phases of treated cells relative to untreated cells; hence prior to treatment the four variables were all 1. Two hours after irradiation the proportion of cells in G2 rose relative to G2 in untreated cells and the percentage of cells in M fell as the mitotic compartment emptied behind the closed G2 checkpoint. By 6 h after irradiation, the accumulation in G2 persisted and the G2 checkpoint recovered somewhat, allowing refilling of the mitotic compartment. Meanwhile the S phase compartment decreased downstream of the closed G1 checkpoint. By 12 h after irradiation the S phase compartment emptied severely and the G2 compartment was returning to the pre-treatment value. At 24 h after treatment a secondary reduction in M reflected emptying of the mitotic compartment due to the earlier emptying of the S compartment.
Visually speaking, the main shortcoming of the model trajectories is the failure of approximation of G2 at 2 hours. However, from (1), even if influx to G2 remained at untreated levels and efflux from G2 were zero, the G2 curve could only grow to a value of 1.46 (the black square), not 2.56 as shown in the experimental data. Hence experimental data for G2 at 2 hours might be questioned. Replicate experiments with two other human fibroblast lines yielded values for G2 at 1.59 and 1.78, further implying an anomalous response in the index fibroblast line.
The results shown in Figure 2 demonstrate that the model can approximate the empirical data to a high degree of concordance. The approximation was dependent upon simple alterations in transition rate coefficients for G1/S, G2/M and M/G1 of the type in Figure 1. Radiation-induced G1 and G2 checkpoint responses are well-understood and kinetic behaviors of the transition rate constants shown in Figure 2 are qualitatively as expected. The G1 to S transition is regulated by ATM- and p53-dependent induction of the cyclin-dependent kinase inhibitor p21 Waf1. Recovery from G1 arrest is dependent upon repair of DNA double-strand breaks, inactivation of p53 by dephosphorylation and proteolysis, and proteolysis of p21 Waf1. The G2 to M transition is regulated by ATM-dependent (but p53-independent) inhibition and cytoplasmic sequestration of cyclin B1/Cdk2. Recovery from G2/M arrest is dependent upon repair of DNA double-strand breaks, recovery of Cdc25C phosphatase activity, and activation of Plk1.
The Optimal Approximation of the empirical data also required that IR-treated cells experience a delay in progression from M to G1. This delay in completion of mitosis was not immediate but occurred after an ~4 h delay. Thus, the delay did not occur in IR-treated M phase cells, but in cells that were in G2 or late S when irradiated. Consistent with this, DNA damage has been reported to trigger a delay in progression through mitosis.21,22
Linear Model with Qualitative Stability
Verbal reasoning alone cannot enable understanding of the vast complexities of cell cycle regulation. Thus some researchers have advocated a strong role for matrix algebra in deduction of genetic networks, possibly becoming a foundation of a future in which biological systems are modeled as physical systems are today. 23 At any rate, the purpose of this section is application of matrix stability theory to the problem of construction of informative, testable models of the impact of IR on cell cultures.
As shown by the Theorem below, the system (1) is qualitatively stable, meaning that starting at other nonnegative cell cycle proportions always results in asymptotic approach to the same equilibrium proportions, all as determined by {Ri}. For example, if cells in the explicit model (4) we employed were initially synchronized in G1, then with time the equilibrium proportions would resume (in fact to within one part in 100 after 23.25 hours, data not shown).
Generally, those system models with consistent, qualitative behavior are favorably represented in nature, such as the damped harmonic oscillator in all its physical forms and ecosystem energy flow models with complex but orderly graph topology. 24 This lends general credibility to the study of qualitatively stable systems.
The generalized dynamical system version of (1) is a linear system with the 4-by-4 Jacobian matrix F relative to the exponential trajectory as shown in (6):
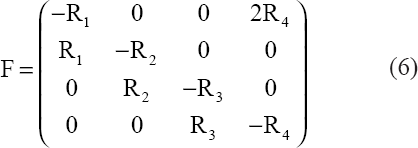
Theorem. Regardless of choice of positive {Ri} values, all trajectories of dX/dt = FX with initially positive values must asymptotically approach an exponentially increasing trajectory with components in constant proportions.
Proof. Background concepts in this proof may be found in introductory texts that connect linear algebra and dynamical systems. 25
The chararcteristic polynomial of (6) is
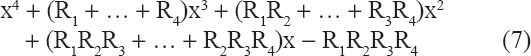
In particular, the determinant of (6) is—R1R2R3R4 < 0. No eigenvalue for any choice of (positive) {Ri} can be zero because that would force the determinant to be zero. Futhermore the four eigenvalues cannot all be purely imaginary for any choice of {Ri} because that would force the determinant to be positive. It follows that for all choices of {Ri} at least one eigenvalue must be real and positive (denoted γ) and at least one must be real and negative (denoted –μ).
Suppose the existence for some choice of {Ri} the roots of (7) are γ, –μ, and a purely imaginary pair ± iβ. Without loss of generality, we may assume β = 1. It follows that the characteristic polynomial is

Equating the coefficients in (7) and (8) shows that γμ = R1R2R3R4 and –γ + μ = R1 + R2 + R3 + R4 = R1R2R3 + R1R2R4 + R1R3R4 + R2R3R4. Also, 1 = R1R2R3R4 + R1R2 + … + R3R4. These values imply that R1R2R3 + … + R2R3R4 = (R1 + … + R4) (R1R2R3R4 + R1R2+ … + R3R4), an equation impossible to solve with all positive {Ri}. Thus there can be no purely imaginary eigenvalue of the matrix in (6).
In the case that all {Ri} = 1, the eigenvalues of (6) are approximately 0.19, –2.19, and –1.00 ± 1.19i. In particular one is positive and the other three have negative real parts. Since the eigenvalues of a matrix are the roots of its characteristic polynomial, since the roots are continuous functions of matrix coefficients, and since as {Ri} vary the eigenvalues cannot assume values on the imaginary axis, it follows that for all choices of {Ri} there must be one positive and real eigenvalue and the other three must have negative real parts.
For any choice of {Ri}, the trajectories of the linear system with matrix (6) must be linear combinations of the eigentrajectories, three of which exponentially approach the origin of four-dimensional space and one that, if initially in the postive orthant, exponentially increases. This establishes in the positive orthant the existence of a unique, global attractor trajectory that exponentially accelerates along a ray in the positive orthant. QED
Regarding computation of the {Ri} from any positive four cell cycle stage proportions and any doubling rate, all 16 entries in the inverse of any matrix of the form (6) can be shown to be positive, so the generalization of (4) always has a positive solution.
Model Verification by Use of Data on Cells with Compromised Checkpoints
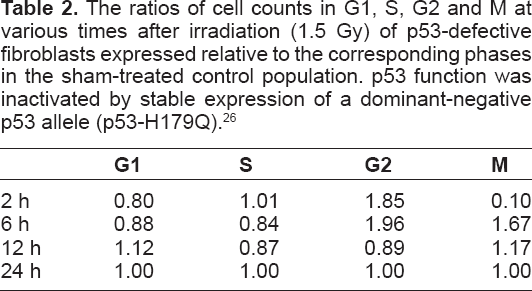
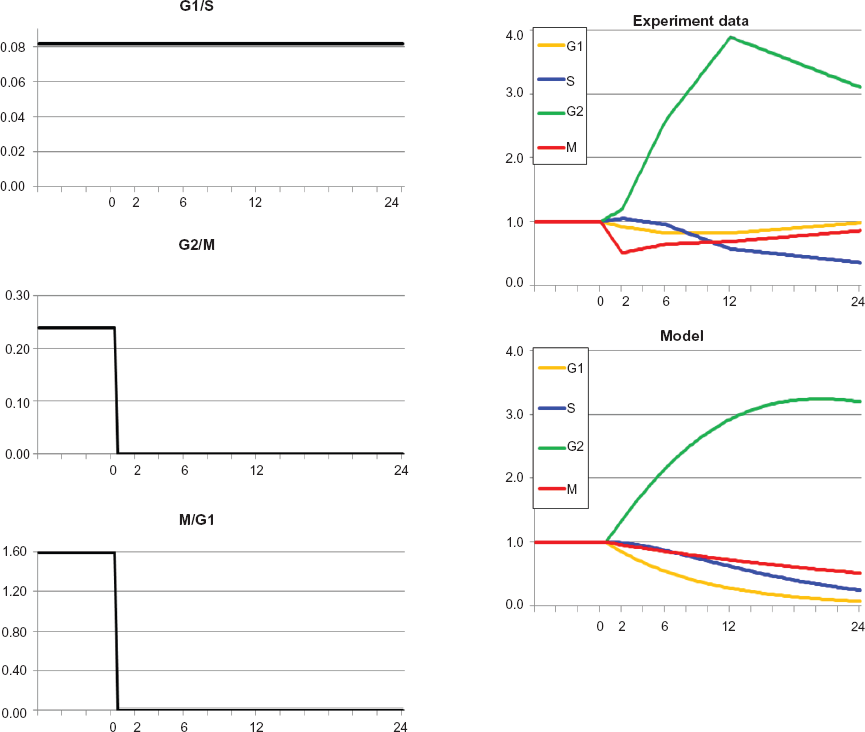
Upon observation of Figure 2, we hypothesized that irradiation effects in cells with compromised checkpoints would be captured by a simple alteration of parameters in Figure 1. Thus we next considered the outcome of irradiation of cells with p53 inactivation as described by Simpson et al. 26 The data were again for 2, 6, 12, and 24 hours post-treatment (Table 2). Optimal approximation was achieved with nearly complete inactivation of G1/S for the full 24 h as shown in Figure 3.
The ratios of cell counts in G1, S, G2 and M at various times after irradiation (1.5 Gy) of p53-defective fibroblasts expressed relative to the corresponding phases in the sham-treated control population. p53 function was inactivated by stable expression of a dominant-negative p53 allele (p53-H179Q). 26
Optimal approximation of model to experiment for cells with G1/S disabled. The model fits the irradiated cell data well with changes in G2/M and M/G1 transition rates.
The immediate G2 checkpoint response to IR was p53-independent, as reflected in the severe emptying of the mitotic compartment at 2 h post irradiation and the accumulation of G2 cells 2 h and 6 h after irradiation. Because the S phase did not empty behind the G1 checkpoint, and the recovery from the G2 checkpoint was rapid; the secondary emptying of the mitotic compartment seen in the control cells at 24 h (Fig. 2) did not occur in p53-defective cells. The good fit of the data again required an IR-induced delay in the M to G1 transition. Thus, in this model the empirical data (16 data points) were well fitted by tuning only seven parameters. Data are shown in Table 2.
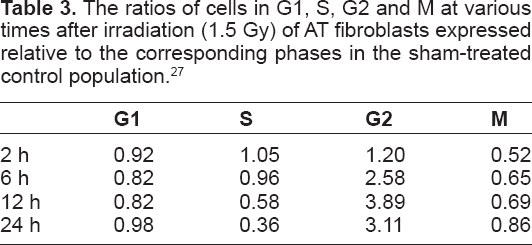
Next we considered the outcome of ATM inactivation. ATM is required for both G1 and G2 checkpoint responses to IR. 27 The data were for 2, 6, 12, and 24 hours post-treatment of skin fibroblast lines from patients with ataxia telangiectasia (AT). 27
ATM is known to phosphorylate and activate p53 so the normal emptying of the S compartment at 6 and 12 h was expected to be severely attenuated. Similarly, ATM is required for the G2 checkpoint, so blocking by G2/M was also expected.
The inhibition of mitosis in Figure 4 was associated with a significant and prolonged accumulation of irradiated AT cells in G2, a phenomenon that is well described in the literature 28 and probably reflects signaling by other PI-3-like checkpoint kinases, ATR and DNA-PK. ATM and ATR share substantial overlap in substrate specificity and both kinases are known to cooperate to enforce the G2 checkpoint. 29 The delayed reduction in the S compartment in irradiated AT cells may reflect a secondary effect of the prolonged G2 accumulation. Data are shown in Table 3.
Optimal approximation of model to experiment for AT cells with inactivation of ATM. The model and experiment are in good agreement. Note that in contrast to the previous example in Figure 3, G2/M and M/G1 are arrested completely.
The ratios of cells in G1, S, G2 and M at various times after irradiation (1.5 Gy) of AT fibroblasts expressed relative to the corresponding phases in the sham-treated control population. 27
The model trajectories automatically approximated the empirical data with good concordance. The alterations in the transition rate constants that supported the model trajectories suggested that ATM may influence the rate of recovery from checkpoint responses more than the initial induction of the checkpoint response.
Conclusions
This paper has applied modeling strategies to attempt to surmise DNA damage checkpoint responses in normal human fibroblasts.
In response to DNA damage, G1/S, G2/M, and M/G1 phase transitions were inhibited. A good fit of experimental data was obtained by dropping the coefficient to a low value (possibly zero) after a time delay (possibly zero), and holding the coefficient at the low value for a time interval (also possibly zero or for the duration of the experiment). The coefficient was then allowed to recover by exponentially converging to its pre-treatment value. This approach captured many aspects of the experimental data with parsimonious selection of non-default parameters, a hallmark of successful models of complex systems.
In all simulations, the initial coefficient functions for G1/S, G2/M, and M/G1 simply dropped to a value of zero at time zero and stayed at zero for the duration of 24 h. The model automatically restored nonzero values as shown in our figures.
The model generated the expected post-irradiation delays in G1/S and G2/M, as induced by the G1 and G2 checkpoints, respectively. The model did not require a change in the S to G2 transition rate to model cell proliferation successfully. Although the 1.5 Gy dose of IR that was tested is known to inhibit replicon initiation in S phase cells, the inhibition is only partial and appears to decay to zero within a few hours of irradiation. 30 Thus, although cells experience a transient delay in progression through S after treatment with 1.5 Gy IR, the overall rate of progression from S to G2 may vary little from the control.
The model also included a delayed induction of a M/G1 arrest. IR has been demonstrated to induce a delay in the metaphase to anaphase transition that would slow M/G1 progression.21,22 This metaphase delay was found to be independent of p53 and ATM, consistent with the results shown here in which an M/G1 delay contributed to the IR-induced changes in cell cycle compartments in cells with defective ATM and p53 21 The IR-induced metaphase-to-anaphase delay appears to depend upon Plk1, a kinase that is required for completion of mitosis. 21 ATM is known to inhibit Plk1 kinase so it is possible that ATM signaling to inhibit Plk1 could expand the time that cells require to transition from metaphase to anaphase. 31 Although Plk1 is not required for the G2/M transition in the absence of DNA damage, it is required for the recovery from the prolonged IR-induced G2 arrest that is triggered after much higher doses of IR than that used here.32,33 Another study has demonstrated that the delay in the metaphase-to-anaphase transition after high levels of DNA damage included signaling through the Mad2-dependent spindle damage checkpoint that regulates activation of the anaphase-promoting complex to trigger the metaphase-to-anaphase transition 22 In our model, the IR-induced delay in the M/G1 transition did not occur until after the irradiated mitotic cells had left mitosis and entered G1. Seemingly, during the IR-induced G2 arrest, changes in cellular biochemistry alter the requirements for mitotic entry and exit after repair of the DNA damage and inactivation of the G2 checkpoint.
The value of a good model is in part determined by its ability to generate new hypotheses. The results presented here suggest that it would be fruitful to quantify the timing of progression through mitosis in human fibroblasts following treatment with IR when in S or G2.
The severe attenuation of activation of p53 in AT cells34,35 explains the inactivation of the G1 arrest. ATM has been shown to accelerate the metaphase-to-anaphase transition consistent with the model's prediction that the recovery of the M to G1 transition rate in IR-treated cels was delayed in AT cells with defective ATM function. 36 AT cells presented prolonged G2/M mitotic arrest. Remarkably, while ATM appears to be stringently required for the immediate G1 arrest in human fibroblasts, it is only partially required for the immediate G2 arrest. ATM-independent checkpoint responses to IR-induced DNA damage include contibutions from ATR and DNA-PK, and both kinases have been implicated in the G2 checkpoint response.29,32,37 ATM may cooperate with ATR and DNA-PK to recover from the G2 and mitotic arrests. DNA-PK is activated rapidly after IR-induced DNA damage as its Ku regulatory subunit finds and binds with high avidity to DNA double strand breaks. 29 ATR is activated through processing of the DNA double-strand break by the Mre11/Rad50/Nbs1 complex 38 DNA-PK is required for repair of DNA double-strand breaks by the non-homologous end-joining pathway.39–41 Furthermore, ATM appears to be required for repair of DNA double-strand breaks through activation of the BRCA1-dependent recombinational repair pathway 42 and through a KAP1/HP1-dependent pathway for remodeling of heterochromatin. 43 Thus, inactivation of ATM in AT cells may impair repair of DNA double-strand breaks and sustain G2 checkpoint signaling through ATR and DNA-PK.
Regarding future work, we note the recent paper of Fernet et al 44 describing two molecularly distinct G2 arrest mechanisms. Whether or not a cell is in G2 during treatment with ionizing radiation determines which of the two G2/M checkpoints it encounters. This finding parallels our view that that checkpoint responses may vary according the cycle phase in which damage occurs and that M/G1 delay does not occur in M cells (under the conditions studied in this paper) but rather in cells that were in S or G2 when damaged (the delay of about four hours in M/G1 response in Fig 2). Capturing the dynamic responses reported and analyzed by Fernet et al might be accomplished with two models much like the one in this paper that are linked to allow mingling of cells distinguished at irradiation by membership or not in G2.
In summary, we have found that the IR-induced changes in progression through the various phases of the cell cycle can be modeled successfully using a computational approach. The model emphasizes that DNA damage checkpoint responses include initial time-dependent signaling events to delay or arrest cycle phase transitions and secondary time-dependent signaling events to recover from the arrest and resume the transitions. This computational model will be developed further to incorporate rates of repair of DNA damage and to estimate the burden of replication of damaged DNA in carcinogen-treated cell populations.
Abbreviations
ionizing radiation;
the total cell count at time t;
for i = 1,2,3,4 four rate coefficients that are constant in untreated cells but functions of time t in IR-treated cells.
Author Contributions
Conceived and designed the experiments: TZ, DAS, WKK. Analysed the data: CDJ, CRJ, TZ, DAS, WKK. Wrote the first draft of the manuscript: CDJ. Contributed to the writing of the manuscript: CDJ, CRJ, TZ, DAS, WKK. Agree with manuscript results and conclusions: CDJ, CRJ, TZ, DAS, WKK. Jointly developed the structure and arguments for the paper: CDJ, CRJ, WKK. Made critical revisions and approved final version: CDJ, CRJ, DAS, WKK. All authors reviewed and approved of the final manuscript.
Funding
The research reflected in this paper was supported in part by the Center for Environmental Health and Susceptibility, NIH grants ES014635, GM066940, and ES10126, and the San Francisco Foundation.
Footnotes
As a requirement of publication author(s) have provided to the publisher signed confirmation of compliance with legal and ethical obligations including but not limited to the following: authorship and contributorship, conflicts of interest, privacy and confidentiality and (where applicable) protection of human and animal research subjects. The authors have read and confirmed their agreement with the ICMJE authorship and conflict of interest criteria. The authors have also confirmed that this article is unique and not under consideration or published in any other publication, and that they have permission from rights holders to reproduce any copyrighted material. Any disclosures are made in this section. The external blind peer reviewers report no conflicts of interest.