
Abstract
The cellular and molecular mechanisms behind the process of atherosclerotic plaque destabilization are complex, and molecular data from aortic plaques are difficult to interpret. Biological network models may overcome these difficulties and precisely quantify the molecular mechanisms impacted during disease progression. The atherosclerosis plaque destabilization biological network model was constructed with the semiautomated curation pipeline, BELIEF. Cellular and molecular mechanisms promoting plaque destabilization or rupture were captured in the network model. Public transcriptomic data sets were used to demonstrate the specificity of the network model and to capture the different mechanisms that were impacted in ApoE–/– mouse aorta at 6 and 32 weeks. We concluded that network models combined with the network perturbation amplitude algorithm provide a sensitive, quantitative method to follow disease progression at the molecular level. This approach can be used to investigate and quantify molecular mechanisms during plaque progression.
Introduction
Quantitative methodologies to evaluate high-throughput omics data are indispensable for biological risk assessment. Frequently used methods to interpret the transcriptomic analysis and to understand the biological response upon different exposures include gene set enrichment analysis (GSEA) 1 or pathway analyses [eg, the Database for Annotation, Visualization and Integrated Discovery (DAVID,https://david.ncifcrf.gov/) and Ingenuity Pathways Analysis (IPA,http://www.ingenuity.com/)]. While these tools are relevant for finding the most affected biological processes or pathways in large-scale data sets,1–3 the results obtained are typically qualitative and are not specific for a particular tissue type or disease. To quantify the impact of exposure or potentially affected biological processes in disease, biological network models (BNMs) have emerged as powerful and useful tools in the field of systems biology. 4 The major advantage of the BNM approach is to capture unstructured knowledge into interconnected and organized knowledge that describes biological processes precisely and accurately. There are several modeling languages, such as the Markup Language (SMBL: http://sbml.org/) 5 and Biological Pathways Exchange (BioPAX), 6 that can be employed to convert scientific results into a computable form. The Biological Expression Language (BEL) (http://www.openbel.org)7,8 represents scientific information as statements with causal or noncausal relationships between biological entities. 7 BEL also addresses the common challenge in traditional pathway analyses, which is missing condition and cell-specific information (Fig. 1). 9 Today, more than 80 commercial pharmaceutical and life science projects use BEL to build causal BNMs. 10

Five-step approach describing the use of the text mining tool for model network building and transcriptomics data for validation of the network.
To aid in the curation of biological knowledge into BEL, the Biological Expression Language Information Extraction Workflow (BELIEF) has an integrated text mining tool11,12 and simplifies the conversion of biological entities and relationships into BEL.13–16 The compiled BEL statements can be visualized in the form of a BNM that is a static representation of the extracted biological knowledge. This model can be used for the analysis and interpretation of large-scale data. 17 Algorithms were developed to score such network models employing the causal structure of the model as well as transcriptomic data.18–20
Here, we describe a particular network model constructed from literature knowledge focusing on atherosclerosis plaque destabilization in ApoE–/– mice. We further demonstrate that in combination with the scoring algorithm, the network model can be used to accurately quantify the impact of plaque development in aging ApoE–/– mice, which allows the interpretation of the precise mechanisms involved. Figure 1 shows the high-level workflow for the building and scoring of BNMs described in this article.
Methods
Biological Expression Language
The BEL (http://www.openbel.org) was specially designed to represent causal relationships across a wide range of mechanistic events (eg, protein–protein functional or physical interactions, protein–diseases interactions, and protein–biological processes interactions) in the scientific literature. A BEL statement is a semantic triplet expressed in the form of subject-relationship-object, where the subject and object are coded by biological entity and where the relationship is a causal predicate (increase, decrease, directly decrease, directly increase; Fig. 2). Each BEL entity is defined by the BEL function (abundance chemical, abundance protein, gene, mRNA, abundance activity) and a referencing namespace (HUGO Gene Nomenclature Committee [HGNC], Mouse Genome Informatics [MGI], or Gene Ontology Consortium [GO]).15,21 BEL also captures the experimental context and includes information about the biological and experimental system in which the relationships were observed (tissue type, species, cell line, or disease).
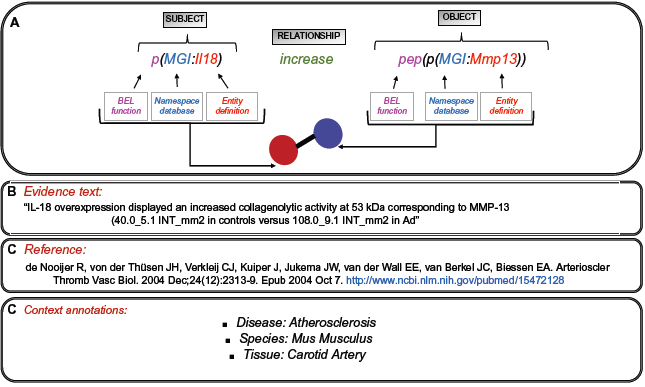
Global representation of the BEL used in BELIEF.
The BELIEF workflow
Thirty-three relevant articles (Supplementary File 1) derived from original experiments describing biological mechanisms involved in the plaque destabilization process in atherosclerosis in mice with the ApoE–/– genetic background were identified using specific key words such as “atherosclerosis plaque destabilization”, “vulnerable lesion”, and “advanced lesions” in PubMed (http://www.ncbi.nlm.nih.gov/pubmed). After the conversion of PDF files (abstract, materials and methods, and results sections) into text files using ABBYY FineReader 11 (http://www.abbyy.com/finereader/), the articles were uploaded into BELIEF11,16 and relevant biological terms in the text were recognized by the text mining software integrated in the BELIEF software, as described elsewhere (Fig. 2). 16 Each processed text document was opened in the curation interface, and the automatically assembled BEL triplets were reviewed, corrected, and annotated for the biological context (in this case, tissue, disease, cell, and species) to form a complete and accurate BEL document. To fulfill this process, the verified BEL statements in the BEL document were compiled to generate a knowledge assembly model, and exported into the eXtensible Graph Markup and Modeling Language (XGMML) format, to be visualized in Cytoscape.
Transcriptomic data sets for verification of the atherosclerosis plaque destabilization network model
To test the ability of the plaque destabilization network model to provide a quantitative measure of plaque progression based on transcriptomic data from the aorta, we investigated publicly available data sets from studies describing aortic tissue affected by atherosclerosis or by nonatherosclerotic disease, as a negative control. The GSE10000 and GSE9371 data sets were obtained from Gene Expression Omnibus (GEO, http://www.ncbi.nlm.nih.gov/gds). The GSE1000 data set examined age-dependent gene expression in the aorta of ApoE–/– mice aged 6, 32, and 78 weeks versus that in C57BL/6J mice (http://www.ncbi.nlm.nih.gov/pmc/articles/PMC2626665/). In this study, the ApoE–/– mice at 32 and 78 weeks represented a disease model with the high activation of mechanisms implicated in the atherosclerosis plaque destabilization process. The GSE9371 data set examined the role of alpha and beta estrogen receptors in the mouse aorta 22 ; hence, such data are from the aorta of mice without the atherosclerotic disease.
Network perturbation amplitude (NPA) methodology
The NPA methodology is used to analyze the transcriptomics data sets in the context of the plaque destabilization network model. Briefly, network scoring exploits the functional layer described in the previous section. The signs of the relationships between the backbone and the functional layer represent the increase or decrease in the abundance of individual mRNAs and are used to infer the activation of a backbone node using transcriptomics data. Because not all backbone nodes have downstream mRNA nodes, the network models need to be prepared for scoring to improve the specificity and relevancy of the overall NPA score. Only backbone nodes that are on a directed path that starts and ends with a node that has downstream mRNA nodes are considered. After removing the nodes that do not satisfy this criterion, the largest connected component is kept. Finally, the edges “causesNoChange” are disregarded for the scoring.
The NPA methodology
23
aims at contextualizing the high-dimensional transcriptomics data by combining gene expression (log2) fold changes, β, into fewer differential node values (one value for each node of the network), f. The differential node values are determined by a fitting procedure that infers the values that best satisfy the directionality of the causal relationships (positive or negative signs) contained in the network model, while being constrained by the experimental data (the gene log2 fold changes, which are described as downstream effects of the network itself):

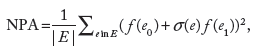
Details of the methodology are described in a previous publication. 23 For the NPA scores, a confidence interval accounting for experimental variation and associated P-values are computed. In addition, companion statistics, derived to determine the specificity of the NPA score with respect to the biology described in the network model, are shown as *O and K* if their P-values are below the significance level (0.05). A network is considered to be significantly impacted if the three values (the confidence interval, *O, and K* statistics) are below 0.05.
Results
The network model representing mechanisms involved in atherosclerosis plaque destabilization
The atherosclerotic plaque network model represents a comprehensive collection of biological mechanisms that regulate the plaque destabilization process in the ApoE–/– mouse aorta. 16 A network model is a representation of the causal relationships between the biological entities in the determined cellular systems coded in the BEL (Fig. 2). The nodes of the network correspond to biological entities or processes and diseases; relationships are represented by edges that connect two nodes and represent the cause-and-effect relationship between the corresponding objects (Fig. 2). This first layer constitutes the backbone network. In addition to the backbone network model, the network contains a downstream layer, called the functional layer; this functional layer includes downstream nodes of a particular node from the backbone network. Downstream entities are in this case the differential expression of the genes causally affected by the considered nodes, which allows the integration of gene expression measurements into the model. This process is called “backward” reasoning and relies on the premise that the activity of the specific activities (eg, enzymes or transcription factors) is deduced from the changes in the expression of its downstream genes. 23 By definition, in the two-layered structure, there are no edges between genes in the transcript layer as we assume that the functional layer drives relationships between genes. The majority of these edges were retrieved from the Selventa Knowledgebase, 19 and some new downstream nodes were also created via literature curation, as described above.
Evaluation of the plaque destabilization network model
The GSE10000 (http://www.ncbi.nlm.nih.gov/geo/query/acc.cgi?acc=GSE10000) published dataset was used to test the network model and the NPA methodology. The GSE10000 captures the gene expression changes in aortic tissue in response to aging. This study compared the aorta transcriptomes of C57BL6/J and ApoE–/– knockout mice at different ages. In the ApoE–/– genetic background, age is considered a biological stimulus of atherogenesis and a strong inducer of the mechanisms implicated in the atherosclerotic destabilization process. 24 The 6-week-old ApoE–/– mice described in the GSE10000 data set had minor atherosclerotic lesions that advanced with time to become the advanced atherosclerotic lesions observed in the aorta of 32- and 78-week-old mice. 24 The GSE9371 (http://www.ncbi.nlm.nih.gov/geo/query/acc.cgi?acc=GSE9371) data set examined the implication of alpha and beta estrogen receptors in mouse arteries. This data set was used as a negative control to assess the specificity of our atherosclerosis plaque destabilization network model.
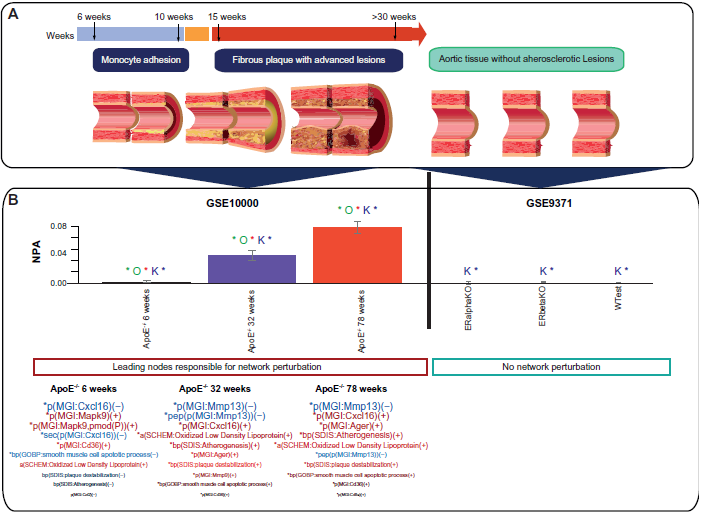
Figure 4 shows the values for the perturbation amplitude for the network as a whole. The NPA score peaked at the age of 78 weeks, whereas at 6 weeks, only slight perturbation of the network was observed (Fig. 4). By contrast, evaluation of the data set from the study investigating estrogen receptors in the aorta (GSE9371) did not result in significant perturbation of the plaque destabilization network model. The key nodes contributing to the amplitude of network perturbation are referred to as the leading nodes, which are shown below the NPA bar graph (Fig. 4). Interestingly, while the NPA was substantially lower in ApoE–/– mice, at the age of 6 weeks, mitogen-activated protein kinase 9 (Mapk9), Cd36 antigen (Cd36), and “oxidation of low-density lipoprotein (LDL)” were inferred to be activated, whereas Cxcl16 and the “smooth muscle cell apoptosis process” were inferred to be suppressed. These leading nodes were different from the ones obtained with the data from older mice in the study. The most primary controllers implicated in the atherosclerosis plaque destabilization process at 32 and 78 weeks were Mmp13, Cxcl16, advanced glycosylation end product-specific receptor Ager, Mmp9, and Cd36 (Fig. 4).
The firm regulation of these biological entities was also associated with the robust activation of biological mechanisms such as “oxidation of LDL”, followed by “atherogenesis” and “plaque destabilization.”
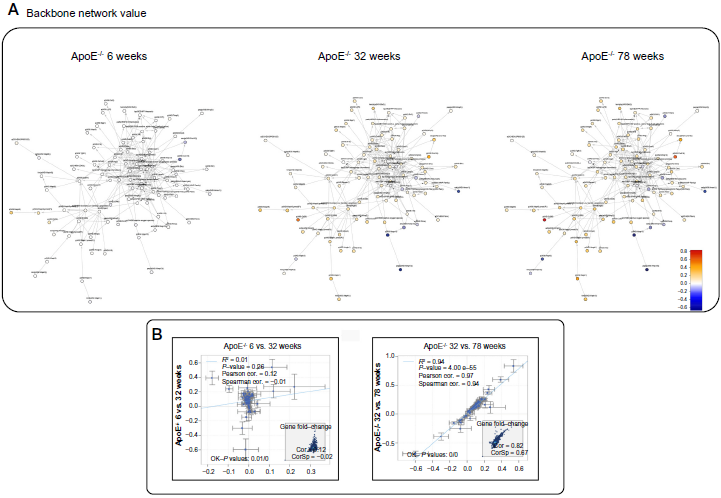
Figure 5A shows a graphic representation of the response of the network model to plaque progression in the ApoE–/–mouse aorta based on transcriptomics data. While the network model is marginally impacted when scoring the sample of 6-week-old mice, the number of affected nodes gradually increases as the mice age, and plaques develop in the ApoE-/-background. As shown in Figure 5B, the mechanisms regulated in the network at 6 and 32 weeks in ApoE–/– mice were considerably different (Pearson correlation: 0.12). This was in line with the fact that at 6 weeks, the ApoE–/– aorta does not yet show pathology, which was observed later, toward 32 weeks. By contrast, the mechanisms that were impacted at 32 and 78 weeks were quite similar, as demonstrated by a robust positive correlation (Pearson correlation: 0.97) between the activation of the backbone network model at these two ages.
Figure 6 shows a graphic representation of the leading nodes in the plaque destabilization model, when scored with transcriptomics data from the ApoE–/– mouse aorta. In 6-week-old mice, the activation of nodes, such as Cd36 and oxidized LDL, was predicted to be principally responsible for macrophages chemotaxis. At 32 weeks, the macrophages chemotaxis was accompanied by the development of inflammation through macrophages activation, which could lead to smooth muscle cell apoptosis and plaque destabilization. The mechanisms that were predicted to be impacted at 32 weeks were also the most important contributors to the effect at 78 weeks. In addition, inflammatory players, such as the cytotoxic CD8+ T-lymphocytes, were predicted to be activated, which indicated progression of the plaque destabilization process.
Discussion
The cellular and molecular mechanisms behind the process of atherosclerosis plaque destabilization are complex and still relatively poorly understood.25–27 Here, we demonstrated how a five-step approach combining semiautomated curation with transcriptomics data and a perturbation network algorithm could be used to study the process of atherosclerosis plaque destabilization in great detail at the molecular level. The central component of our analysis is the causal BNM describing molecular relationships that take place during plaque instability in ApoE-/- mouse aorta. While being a static representation, this computable causal model could serve as the basis for developing a dynamical model describing the dynamics of its molecular entities, in line with the perspectives discussed in Ref. 28. Dynamical models describing, for example, the initiation of atherosclerosis through a small number of molecular species have been previously published. 29 With the use of two public datasets, we have demonstrated that the atherosclerosis plaque destabilization network model is accurate to the atherosclerotic disease and is very sensitive to data from advanced lesions. However, the network model was extracted in propriety from ApoE–/– model; the mechanism of atherosclerotic disease could be used in another disease model to investigate the severity of atherosclerotic plaque. High connected nodes were captured as the backbone network model (Fig. 3) to allow the NPA scoring (Fig. 3). The results suggest that lesions observed at 78 weeks present the most elevated risk for the plaque destabilization process in ApoE–/– mice. Interestingly, the network was already slightly impacted in ApoE–/–mouse aorta at 6 weeks, when no plaques should be present. However, the significant molecular contributors to the perturbation differed from those observed for more advanced lesions, as demonstrated by the leading node and correlation analyses. The inferred downregulation of CXCL16 in the younger mice could be related to enhanced macrophage recruitment to the aortic arch, which could promote the acceleration of the inflammatory response and atherosclerosis, as has been previously proposed. 30 This enhanced macrophage recruitment could be additionally enhanced through CD36 activation, as suggested by the NPA analysis. CD36 is an essential scavenger receptor strongly implicated in the capture of lipids and macrophages in the subendothelial layer; overexpression of CD36 has been shown to lead to the development of an inflammatory response mediated through lipid oxidation. 31 Together, these findings suggest that in ApoE–/– mice aged 6 weeks, mechanisms related to the recruitment of lipids and inflammatory cells are predominantly activated and that these mechanisms strongly involve CXCL16 and CD36 (Fig. 6). Our network model further integrated the crucial role of MMPs in the plaque destabilization process and showed that MMP13 was strongly deactivated, whereas MMP9 and AGER were strongly activated in the network model scored with 32-week ApoE–/– mouse data. Together, these results suggest that pro- and antiplaque destabilization mechanisms are regulated at 32 weeks. While MMP13 inhibition promotes collagen accumulation in atherosclerotic lesions, even in established plaques, and participates in preventing plaque rupture,32,33 the pro-rupture mechanisms related to MMP9 and AGER degrade the extracellular matrix and could promote smooth muscle cell apoptosis. However, antiplaque destabilization mechanisms seemed to be regulated at 32 weeks; the imbalance between matrix accumulation and degradation reduces plaque stability, as suggested by the activation of “smooth muscle cell apoptosis” and the “plaque destabilization process,” which occurs despite MMP13 deactivation. 34 At 78 weeks, the atherosclerosis plaque destabilization process had progressed further, as indicated by the reinforcement of mechanisms already inferred to be activated at 32 weeks. Despite the substantial agreement between the leading nodes activated at 32 and 78 weeks, we observed that additional mechanisms mediated by CD8 were increasingly activated at 78 weeks (Fig. 6). Cd8a is a biomarker for cytotoxic CD8+ T-lymphocytes. The activation of such lymphocytes suggests that the advanced lesions at 78 weeks present infiltration of not only macrophages but also cytotoxic Cd8a+ T-lymphocytes. As demonstrated in the literature, CD8+ T-lymphocytes play a critical role in the plaque destabilization process; the infiltration of Cd8+ T-lymphocytes promotes the induction of macrophages, endothelial cells, and smooth muscle cell apoptosis, leading to plaque instability.32,33 Our conclusion demonstrating the additional effects of CD8+ T-lymphocytes on the plaque destabilization process is in accordance with literature results that revealed that the advanced atherosclerotic lesions promote the infiltration of CD8+ T-lymphocytes, which account for plaque rupture.27,33
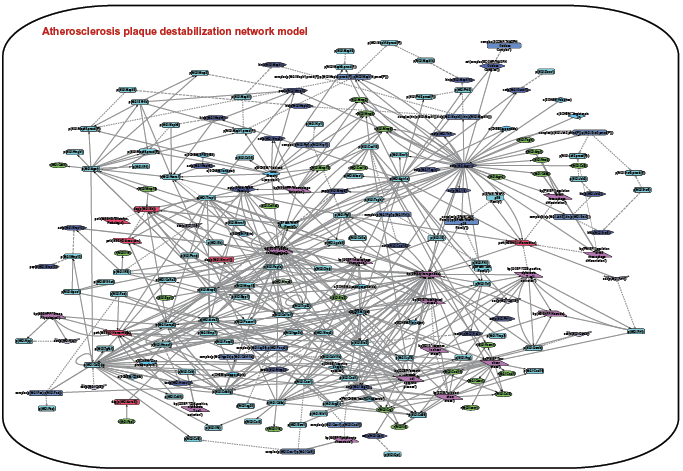
Atherosclerosis plaque destabilization network model containing 203 nodes (colored boxes) and 511 edges (gray lines connecting nodes).
Perturbation of the atherosclerosis plaque destabilization network model as a whole.
Comparability of aortic tissue response between 6, 32, and 78 weeks.
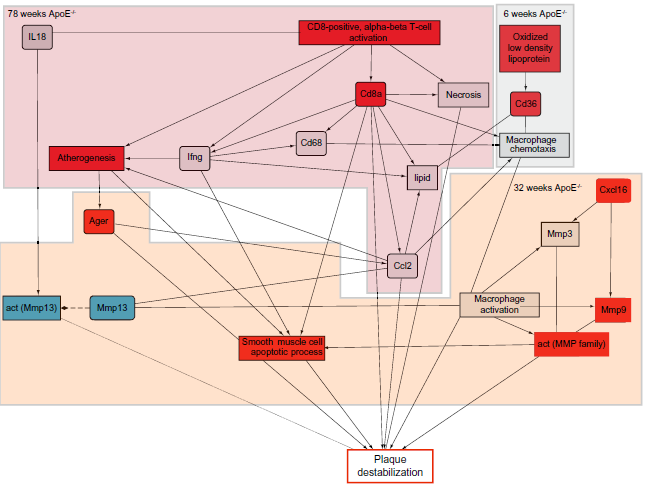
Mechanistic representation of the leading nodes at 6, 32, and 78 weeks in ApoE –/– mice.
Conclusion
As demonstrated in this study, BNMs in combination with the NPA algorithm provide a sensitive, quantitative method to follow disease progression at the molecular level. 20 In this study, we additionally demonstrated that the mechanisms playing important roles in atherosclerotic lesions at 6, 32, and 78 weeks differed markedly. While the mechanisms at 6 weeks focused on lipids and macrophage adhesion, the mechanisms in advanced lesions were strongly associated with the promotion of macrophages and Cd8+ T-cell activation, maintaining the essential role of inflammatory cells in advanced lesions. The causal BNMs describing the atherosclerotic plaques destabilization could be utilized for scoring of different data sets to determine the severity of atherosclerotic lesions and could help in the discrimination of vulnerable and nonvulnerable lesions. Although we focused on the atherosclerosis plaque destabilization process, the approach described here could be used in various contexts or diseases; the NPA methodology is not restricted to a particular domain and can be widely used in pharmaceutical and toxicological contexts. In fact, semiautomated curation using BELIEF tools is a flexible approach; BELIEF integrates the gene, protein, chemical, and disease database namespaces and allows the recognition of biological entities and their associated relationships in various biological and toxicological contexts. Although BELIEF strongly supports the creation of BNMs, direct visualization of the structured network knowledge in BELIEF is not currently possible. The BELIEF tool could benefit from a dynamic visualization tool, which is suggested as the next step to advance this approach. Finally, a key advantage of network models built using a text mining tool is that they can be regularly updated and maintained to keep the knowledge up to date.
Author contributions
Carried curation process and network building: JS. Drafted the manuscript: JS, MT. Scored the network model with transcriptomics data: FM. Participated in the design and conception of the study: JH, MCP. All the authors read and approved the final manuscript.
Footnotes
Acknowledgments
The authors acknowledge and thank Stephanie Boue, Alain Sewer, and Samantha Elmhurst for their contributions to this project.