
Abstract
The goal of the present study was to compare hepatic toxicogenomic signatures across in vitro and in vivo mouse models following exposure to acetaminophen (APAP) or its relatively nontoxic regioisomer 3′-hydroxyacetanilide (AMAP). Two different Affymetrix microarray platforms and one Agilent Oligonucleotide microarray were utilized. APAP and AMAP treatments resulted in significant and large changes in gene expression that were quite disparate, and likely related to their different toxicologic profiles. Ten transcripts, all of which have been implicated in p53 signaling, were identified as differentially regulated at all time-points following APAP and AMAP treatments across multiple microarray platforms. Protein-level quantification of p53 activity aligned with results from the transcriptomic analysis, thus supporting the implicated mechanism of APAP-induced toxicity. Therefore, the results of this study provide good evidence that APAP-induced p53 phosphorylation and an altered p53-driven transcriptional response are fundamental steps in APAP-induced toxicity.
Introduction
Acetaminophen (APAP, paracetamol, acetyl-p-aminophenol) is a widely used analgesic and antipyretic. While considered safe at recommended doses, APAP overdose cases are quite common and lead to over 50,000 emergency room visits annually in the United States alone.1,2 The toxicity associated with APAP overdose cases is related to cytochrome P450-mediated bioactivation of APAP into N-acetyl-p-quinoneimine (NAPQI), 3 which can form APAP adducts on proteins leading to toxicity. Although a great deal is understood regarding the mechanisms underlying the pathophysiology of APAP-induced liver injury, the most important pathways involved continue to be debated.
Toxicogenomics is a field in which global changes in gene expression can be assessed quickly and efficiently to generate hypotheses and relate changes in expression to toxicity. 4 Early experiments in the field of toxicogenomics found microarray technology to be a sensitive and powerful tool able to not only correlate gene expression with histopathology 5 but also generate highly reproducible results. 6 While it has been demonstrated that microarray data generated from multiple sites can maintain a good degree of consistency and reproducibility when utilizing the same platform, 7 consistent and reproducible data from labs using the same samples and different platforms can be difficult to obtain. 8 In addition to platform variation, the type of system, variability in lab techniques, and unique methods for sample preparation make relating different genomic studies quite difficult. Therefore, consistent microarray results obtained from different laboratories using the same platforms should be considered quite robust.
A number of toxicogenomic studies have been performed on APAP-treated samples to identify transcriptomic hallmarks that may be related to APAP-induced toxicity.9–14 In order to obtain a clearer picture of the transcriptomic changes occurring during APAP-induced toxicity, structure–toxicity relationships can be utilized to differentiate between cellular changes related to the pharmacology of APAP and those related to toxicity. 3′-Hydroxyacetanilide (AMAP, acetyl-m-aminophenol) is a relatively nontoxic positional isomer of APAP that has analgesic and antipyretic activity similar to APAP in mice, 15 and therefore can be used to discriminate between APAP-induced changes related to the pharmacologic and therapeutic activity of hydroxyacetanilides and APAP-induced changes related to toxicity. This comparative toxicogenomic approach has been utilized in a handful of previous studies attempting to identify genes associated with APAP-induced toxicity rather than its pharmacologic effects.7,16,17
One important consideration when comparing drug- induced gene expression profiles, especially with compounds as structurally similar as APAP and AMAP, is that while each regioisomer will likely produce unique expression, it may be difficult to distinguish toxic and pharmacologic mechanisms due to significant overlap. To overcome this hurdle, it was imperative to collect as many transcriptomes as possible across multiple concentrations and time-points to differentiate between effects associated with various treatment conditions. 18 In the present study, three microarray experiments were compared in two model systems across four time-points using three different microarray platforms to identify robust transcript expression responsible for the different toxicologic outcomes associated with APAP and AMAP treatment. More specifically, gene expression was compared between transforming growth factor alpha 1 (TGF-α)-transfected mouse hepatocytes (TAMH cells) using two Affymetrix platforms (Mouse Genome 430 2.0 and Mouse Gene 1.0 ST arrays) 17 and C57BL/6 mice on an Agilent Mouse Oligonucleotide array. 7
Despite the diversity of cell models and microarray platforms employed in this study, the detection of common gene expression patterns was observed. In general, APAP treatment altered gene expression to a greater extent than AMAP treatment. Furthermore, significant changes in gene expression, likely related to pharmacological effects, were relatively well conserved between the regioisomers in vitro, but not in vivo. However, gene expression changes that were significant and large were much less conserved between APAP and AMAP both in vitro and in vivo and were likely related to toxicological differences. The most conspicuous gene targets identified by these experiments related to APAP-induced toxicity included Atf3, Btg2, Cdkn1a, Egrl, Gdf15, Jun, Lif, Mdm2, Myd116, and Plk3. Interestingly, 9 out of 10 of these transcripts (ie, all except Jun) have been shown to positively regulate the activity of p53, thus implicating a role for p53 in the toxicogenomic response to APAP-induced hepatotoxicity.
The tumor suppressor p53 has been extensively studied for over 30 years. 19 Its activity is regulated via reversible post-translational modifications, which include phosphorylation, acetylation, ubiquitination, and neddylation. 20 These modifications occur in response to numerous stimuli such as cell stress and DNA damage, which are well-established events in APAP overdose situations. 21 Previous studies have demonstrated increased phosphorylation at the N-terminus of p53 following APAP-induced oxidative DNA damage (eg, serine-15, serine-20, and serine-37).22,23 These results were validated in the present study, in addition to the observation that APAP treatment led to increased phosphorylation at serine-329 in the C-terminal region of p53 compared to AMAP treatment and vehicle-treated controls. Increased p53 phosphorylation at serine-392 in response to DNA damage following UV exposure has been established.24–26 However, to our knowledge, this is the first published evidence of APAP-induced p53 phosphorylation at this site.
Materials and Methods
Materials
Acetaminophen, 3′-hydroxyacetanilide, glycine, dexamethasone, nicotinamide, ethanol, and soybean trypsin inhibitor were obtained from Sigma-Aldrich. Gentamicin, trypsin, Dulbecco's Modified Eagle's Medium/Ham's F12 (1:1), Dulbecco's PBS (DPBS), Hank's balanced salt solution, and Trizol reagent were purchased from Invitrogen. ITS premix was obtained from BD Bioscience. Tissue culture plates, dishes, and scrapers were purchased from Fisher. Chloroform was purchased from MP Biomedicals. Needles (22G) were purchased from Becton, Dickinson and Company. Nuclease-free water and RNeasy kits were purchased from Qiagen. All reagents used in the processing of total RNA for Affymetrix microarrays were supplied in the One-Cycle Target Labeling and Control Reagents Kit from Affymetrix. The reagents used for processing RNA for Agilent arrays were purchased from Agilent Technologies. All antibodies for immunoblotting were purchased through Cell Signaling Technology.
Cell culture
TAMH cells (passages between 25 and 35) were grown in serum-free Dulbecco's Modified Eagle's/Ham's F12 (1:1) medium supplemented with (final concentrations) 100 nM dexamethasone, 10 nM nicotinamide, 0.1% (v/v) gentamicin, and an ITS premix containing insulin (5 ng/mL), transferrin (5 ng/mL), and selenium (5 ng/mL). Cells were grown at 37 °C in a humidified incubator with 5% CO2 and 95% air, and passaged as previously described. 17
In vitro RNA isolation
RNA was isolated from TAMH cells dosed with 2 mM APAP, 2 mM AMAP, or control culture media for 2, 6, or 24 hours. For each treatment, cells were grown to confluence in two 150 mm2 tissue culture dishes and dosed. At the end of each treatment, cells were harvested using a rubber scraper and collected by centrifugation. Following an ice-cold Dulbecco's phosphate buffered saline (DPBS) wash step, Trizol reagent was added directly to the cell dish. Once vortexed, the cell suspension was passed through a 22G needle multiple times to ensure complete cell lysis. Following the addition of a chloroform solution and a centrifugation step, the aqueous phase of the sample mixture was isolated and dissolved in 70% ethanol. The resulting mixture was loaded onto a Qiagen RNeasy column, and purified total RNAs were eluted according to the manufacturer's protocol.
Affymetrix mouse genome 430 2.0 arrays
RNA integrity was assessed using the Agilent 2100 Bioanalyzer, and only samples passing quality control were further processed. The manufacturer's protocol was then followed for the determination of gene expression data using nine Affymetrix Mouse Genome 430 2.0 arrays (n = 1 per group). Included in these methods are first and second strand cDNA synthesis, double-stranded cDNA purification, cRNA synthesis, biotin-labeled cRNA quantification, and cRNA fragmentation followed by subsequent hybridization. Following hybridization and washing, the Affymetrix arrays were scanned with an Affymetrix GeneChip 3000 scanner. Image generation and feature extraction were performed using the Affymetrix AGCC Software. Only data from arrays that passed the manufacturer's quality specifications were used for further analysis. It is worth mentioning that all tables containing expression data convey gene changes as log2 fold changes. All microarray data derived from Affymetrix Mouse Genome 430 2.0 arrays used in this study have been deposited in the Gene Expression Omnibus Database under accession number GSE56576 (http://www.ncbi.nlm.nih.gov/geo/).
Affymetrix mouse gene 1.0 ST arrays
RNA integrity was assessed using the Agilent 2100 Bioanalyzer, and only samples passing quality control were further processed. The manufacturer's protocol was then followed for the determination of gene expression data using 28 Affymetrix Mouse Gene 1.0 ST arrays (n = 3 per group). Included in these methods are first and second strand cDNA synthesis, double-stranded cDNA purification, cRNA synthesis, biotin-labeled cRNA quantification, and cRNA fragmentation followed by subsequent hybridization. Following hybridization and washing, Affymetrix arrays were scanned with an Affymetrix GeneChip 3000 scanner. Image generation and feature extraction were performed using the Affymetrix AGCC Software. Only data from arrays that passed the manufacturer's quality specifications were used for further analysis. All microarray data derived from Affymetrix Mouse Gene 1.0 ST arrays used in this study have been deposited in the Gene Expression Omnibus Database under accession number GSE18614 (http://www.ncbi.nlm.nih.gov/geo/).
Agilent mouse oligonucleotide arrays
Details regarding animal treatments, RNA isolation, and microarray hybridizations can be found in the original publication by the Toxicogenomics Research Consortium. 7 All animal studies for this project were approved by each Institution's respective Animal Care and Use Committee. Briefly, randomly assigned C57BL/6 J mice were dosed with 10 mL/kg body weight of vehicle (methylcellulose, 0.5% wt/vol), AMAP (300 mg/ kg), or APAP (300 mg/kg). Mice were euthanized at 6, 12, or 24 hours after treatment. Total RNA was isolated from liver samples (left lateral lobe) using Qiagen RNeasy mini kits according to the manufacturer's protocol. Total RNA from individual mouse liver samples was amplified and labeled with a fluorescent dye (Cy3), whereas a common reference of pooled C57BL/6 J liver mRNA was amplified and labeled with Cy5 using Agilent Technologies Low RNA Input Linear Amplification Labeling Kit following the manufacturer's protocol. Equal amounts of Cy3 and Cy5-labeled cRNA were hybridized to an Agilent Mouse Oligonucleotide Microarray (~21,000 features, catalog # G4121) and scanned using an Agilent G2565BA scanner. Raw microarray data were processed and analyzed with tools in the Bioconductor 27 software package. This dataset (raw and normalized data files) is publicly available from cebs.niehs.nih.gov (accession number 009–00001–0010-000–1).
Statistical analysis
From the normalized data, genes with evidence for statistically significant differential expression were identified using the limma package 28 in Bioconductor. 27 The P-values were calculated with a modified t-test in conjunction with an empirical Bayes method to moderate the standard errors of the estimated log-fold changes. The P-values were adjusted for multiplicity using Bioconductor's implementation of the Benjamini–Hochberg method, 29 which allows selecting statistically significant genes while controlling the estimated false discovery rate.
Immunoblotting and quantification
TAMH cells were dosed with 2 mM of APAP, 2 mM of AMAP, or control media for 2 and 6 hours (as described previously). Subsequent to treatment, cells were harvested by using a rubber scraper. Pierce BCA protein assay kit was then utilized to determine the protein concentration of each sample. BCA quantification was performed via spectrophotometry using the Biotek Synergy 2 Multi-Mode Microplate Reader. Normalization using total protein analysis, in place of loading controls such as β-actin and β-tubulin, is a well-established model to determine whether equivalent protein loading is achieved. 30 Based on concentration data from the bicinchoninic acid (BCA) assay, appropriate volumes of 1 × SDS sample buffer were added to each sample to ensure that 50 μg of protein was loaded per well. Samples were then heated at 97.5 °C for five minutes followed by centrifugation at 2000 rpm for five minutes. Fifty micrograms of protein per well was loaded on Bio-Rad Any kD Mini-PROTEAN TGX gels, and electrophoresis was performed at 150 V for 45 minutes using the Bio-Rad Mini-PROTEAN Tetra Cell system. Upon completion, transfer to poly(vinylidene fluoride) PVDF membrane was performed using the Bio-Rad TransBlot SD semi-dry transfer cell at 15 V for 60 minutes. Each membrane was blocked in 20 mL of blocking buffer (5% BSA, pH 8) at room temperature with gentle shaking for 60 minutes. Primary antibodies were diluted in 5% BSA blocking buffer (1:1000 for phospho-p53 S15 and 1:500 for phospho-p53 S392, and 1:1000 for total p53) and incubated with membranes overnight at 4 °C. Membranes were then treated with their respective horseradish peroxide (HRP)-linked secondary antibodies (1:1500 for anti-mouse IgG, and 1:1000 for anti-rabbit IgG) at room temperature for 60 minutes and exposed to LumiGLO chemiluminescent substrate (Cell Signaling Technologies) with gentle agitation for one minute. Detection was visualized after 30 minutes on green X-Ray film (Phenix Research Products). Films were then subjected to densitometric analysis via the software ImageJ (developed by Wayne Rashband, National Institutes of Health, Bethesda). All antibodies were purchased from Cell Signaling Technologies, which included phospho- p53 S15 (#9284), phospho-p53 S392 (#9281), p53 (#2524), anti-mouse IgG (#7076), and anti-rabbit IgG (#7074).
Results
Comparison of APAP- and AMAP-induced transcriptomic changes relative to vehicle control using Affymetrix mouse genome 430 2.0 arrays
In order to identify transcriptional changes that may be responsible for the observed differences in toxicity, an exploratory microarray experiment was performed with RNA isolated from TGF-α TAMH exposed to 2 mM APAP or 2 mM AMAP. Microarray analysis was then performed on one sample per treatment condition using Affymetrix Mouse Genome 430 2.0 arrays. The expression of 5753 transcripts changed more than twofold relative to the vehicle control in at least one of the three time-points (2, 6, or 24 hours) following either APAP or AMAP treatment. One dimensional clustering of these 5753 transcripts revealed that the isomers induced very similar large changes in gene expression as evidenced by the fact that samples clustered based on time-point rather than by drug (Supplementary Fig. 1). Unfortunately, statistical significance related to these differences could not be determined due to the lack of replicates at each time-point (n = 1 per treatment condition). Owing to the nature of the array as an exploratory comparison, no validation of transcriptomic changes through quantitative polymerase chain reaction (qPCR) or subsequent western analysis was performed based solely on these results.
Follow-up comparison of APAP- and AMAP-induced transcriptomic changes relative to the vehicle control using affymetrix mouse gene 1.0 ST arrays
A second comparative toxicogenomic experiment was performed in triplicate on the Affymetrix Mouse Gene 1.0 ST platform for two reasons. First, it was important to assign significance to transcriptional changes of interest for the exploratory Affymetrix Mouse Genome 430 2.0 experiments; and second, it was anticipated that consistent changes in gene expression across different Affymetrix platforms would minimize the potential for platform bias. To this end, RNA was isolated from TAMH cells following 2, 6, or 24 hour exposure to 2 mM APAP or 2mM AMAP. Samples were then processed and analyzed by microarray. A total of 9121 transcripts were found to have expression that was significantly altered (P < 0.05) in at least one of the time-points/treatments relative to controls. In fact, APAP and AMAP treatment induced similar transcriptomic changes, as illustrated by the fact that these changes clustered more closely with respect to dosing period rather than with drug treatment (Fig. 1A). However, when a dendrogram was generated for the 524 gene expression changes found to be both significant (P < 0.05) and different by at least 50% from controls (ie, fold change| >1.5) in at least one of the time-points/treatments relative to controls, gene expression patterns clustered according to drug treatment rather than to dosing period (Fig. 1B). This suggests that overall gene expression changes following APAP and AMAP treatment is quite similar in vitro, but that the regioisomers have very different effects on a specific subset of genes in which large changes in expression were observed.
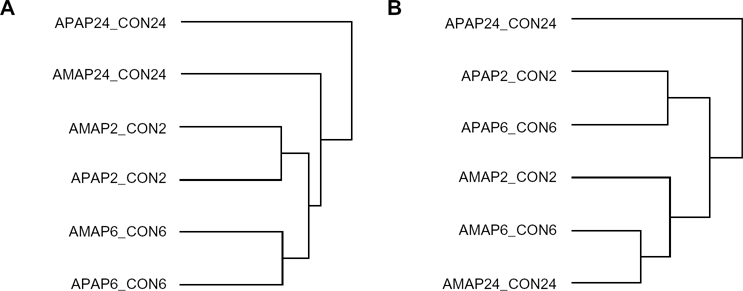
Clustering of significant transcriptomic changes in vitro following APAP or AMAP treatment compared to control. TAMH cells were treated with 2 mM APAP or AMAP for 2, 6, or 24 hours and gene expression was analyzed using Affymetrix Mouse Gene 1.0 ST arrays (n = 3). (
In vivo comparison of APAP- and AMAP-induced transcriptomic changes in liver relative to the vehicle control using agilent mouse oligonucleotide arrays
A third comparative toxicogenomic experiment previously published by the Toxicogenomics Research Consortium 7 was analyzed to 1) identify in vivo transcriptomic changes in C57BL/6J mouse liver that were predicted by the TAMH in vitro model, and 2) to verify that these consistent gene expression changes were platform-independent (Affymetrix platforms vs Agilent). Mice were dosed with 300 mg/kg APAP or AMAP for 6, 12, or 24 hours, an adequate and validated dose for toxicity studies involving APAP in the C57BL/6 model.11,13,31 A total of 14,161 transcripts were found to have expression that was significantly altered (P < 0.05) in at least one of the time-points/treatments relative to controls. However, unlike the TAMH in vitro model, significant gene expression changes clustered more closely with respect to drug treatment rather than dosing time (Fig. 2A). This clustering pattern related to drug treatment persisted when a dendrogram was generated for the 931 gene expression changes found to be both significant (P < 0.05) and relatively large (|fold change| >1.5) (Fig. 2B), similar to what was observed in the TAMH model. The observation that significantly large changes in gene expression were consistently associated with drug treatment both in vivo and in vitro suggests that these highly differentially regulated transcripts can be used with high probability to delineate the toxicologic differences associated with APAP and AMAP treatments.
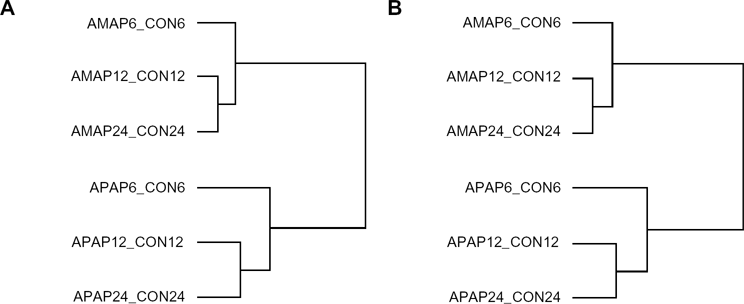
Clustering of significant transcriptomic changes in vivo following APAP or AMAP treatment compared to control. C57BL/6J mice were dosed with 300 mg/kg APAP or AMAP for 6, 12, or 24 hours and analyzed using Agilent Mouse oligonucleotide arrays (n = 23–28).
7
(
Expression of p53-related transcripts was consistently found to be differentially regulated in APAP treatment compared to AMAP treatments
In an attempt to identify transcripts with the most robust changes in expression, genes were identified where differential expression was seen at all time-points in the Affymetrix Mouse Genome 430 2.0 (|fold change| >2), Affymetrix Mouse Gene 1.0 ST (| fold change| >1.5, P < 0.05), and Agilent Mouse Oligonucleotide (|fold change| >1.5, P < 0.05) arrays (Fig. 3). Expression values for the 10 transcripts that were identified by multiple arrays as differentially expressed between the regioisomers (ie, shared Venn regions in Fig. 3) are listed in Table 1. In addition, differential expression values for transcripts exclusive to the Affymetrix Mouse Genome 430 2.0, Affymetrix Mouse Gene 1.0 ST, and Agilent Mouse Oligonucleotide arrays can be found in Supplementary Tables 1, 2, and 3, respectively. Strikingly, all 10 of the transcripts identified in common across the three arrays have published reports linking their activity to p53 signaling, suggesting that perturbations to p53 signaling pathways via differential transcriptomic regulation of p53-related factors are critical for promoting APAP-induced toxicity, AMAP-induced cytoprotection, or both. Interestingly, each dataset was mined retrospectively to assess the expression of p53 itself, and no significant differences in its expression were observed at any time-point when comparing APAP and AMAP treatments.
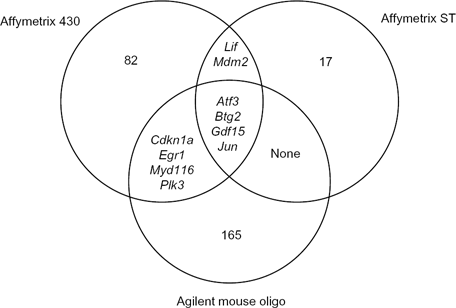
Transcripts differentially expressed at all time-points between APAP versus AMAP treatments. Venn diagrams represent the commonality and exclusivity of transcripts found to be differentially expressed in APAP relative to AMAP treated samples in the Affymetrix mouse Genome 430 2.0 (|fold change| >2), Affymetrix mouse Gene 1.0 St (|fold change| >1.5, P < 0.05), and Agilent mouse oligonucleotide (|fold change| >1.5, P < 0.05) array data sets. Four transcripts were identified as shared across all three platforms: Atf3, Btg2, Gdf15, and Jun.
Transcripts differentially expressed across multiple platforms at all time-points between APAP and AMAP treatments.
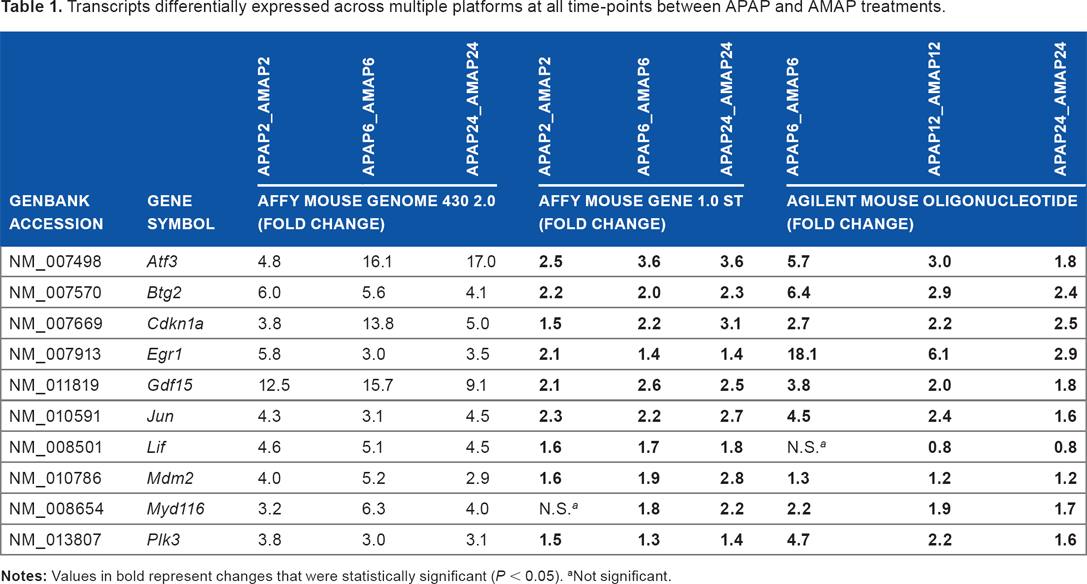
Not significant.
APAP-induced expression of Atf3, Btg2, Gdf15, and Jun was the most consistent transcriptomic signature differentiating APAP and AMAP treatments
Of the 10 transcripts identified by multiple arrays, only Atf3, Btg2, Gdf15, and Jun were identified by all three array platforms as meeting significance and fold-change criteria at all time-points assayed (Table 1). Graphs were then constructed in order to track how gene expression changed for these transcripts over time for each platform (Fig. 4). In vitro expression of Atf3, Btg2, Gdf15, and Jun was relatively constant across all time-points (Fig. 4A and 4B), whereas in vivo expression of these four transcripts decreased after six hours (Fig. 4C). However, differential expression of Atf3, Btg2, Gdf15, and Jun was still maintained to a significant and large extent over all time-points in vivo despite decreased expression at later time-points (Table 1). It is also worth noting that differential expression of these four transcripts was also observed in the only other published toxicogenomic study comparing APAP and AMAP treatments. 16 In fact, differential expression of the numerous transcripts identified herein was also observed in the aforementioned toxicogenomic study (Table 2).
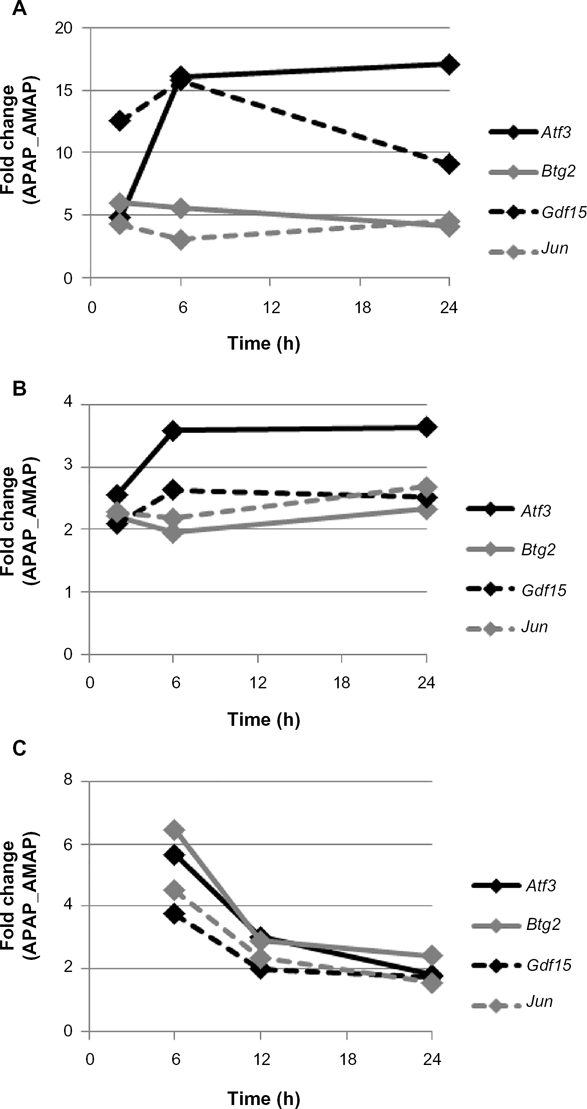
Time course of transcripts differentially expressed across all platforms at all time-points in the APAP versus AMAP comparison. Expression of Atf3, Btg2, Gdf15, and Jun are plotted versus time. In vitro measurements were taken at 2, 6, or 24 hours for the (
Comparison of APAP- and AMAP-induced gene regulation consistent among multiple toxicogenomic studies between four and six hours of treatment.
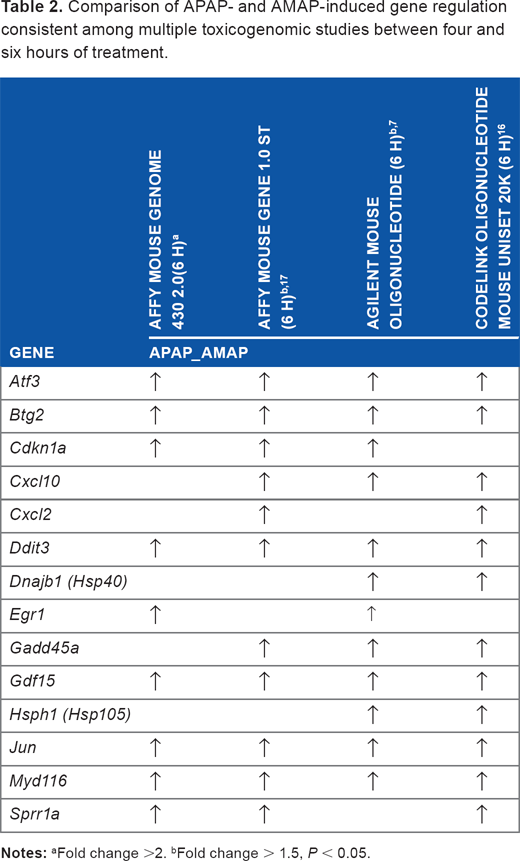
Fold change > 1.5, P < 0.05.
Protein expression of p53 following APAP and AMAP treatment in TAMH cells
An in vitro comparison was performed to assess p53 activity in two biologic replicates from TAMH cells dosed with 2 mM APAP or 2 mM AMAP at two and six hours. Western Blotting and subsequent densitometric analysis demonstrated that total p53 levels were marginally higher following APAP treatment than either control or AMAP treatments at both two- and six-hour time-points (Fig. 5). The greatest increase in total p53 expression was observed between the two-hour APAP and AMAP treatments (1.8-fold). In addition to total p53 measurements, p53 phosphorylation levels were also measured at two independent sites, S15 and S392. More than 4.4-fold increases in S15 phosphorylation were detected in APAP-treated samples for all time-matched comparisons (Fig. 6A). Similar results were observed at S392, in that APAP induced >5.8-fold increases in phosphorylation at this site compared to all other time-matched samples (Fig. 6B). The protein data strongly support the gene expression results by confirming that APAP-induced expression of p53-related transcripts is in fact accompanied by increased p53 phosphorylation.
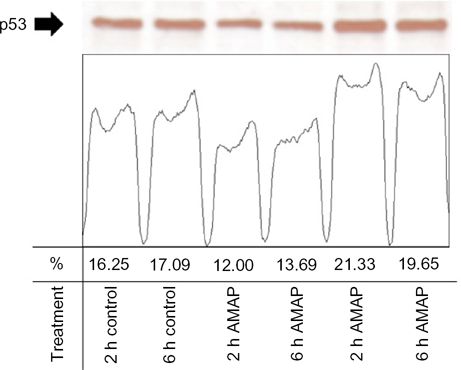
APAP- and AMAP-induced changes in total p53 protein levels. TAMH cells were treated with 2 mM APAP or AMAP for two and six hours. Total cell lysates were analyzed by western immunoblotting using a monoclonal anti-p53 antibody. Peaks represent quantified bands using ImageJ software, as described in the Materials and methods section.
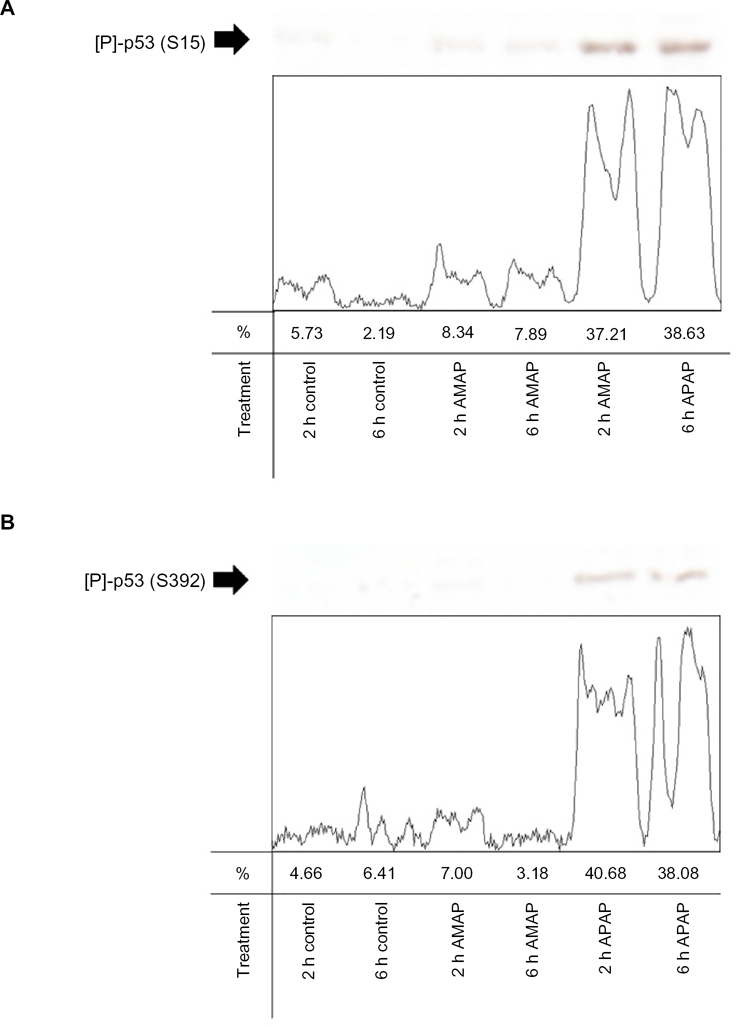
APAP- and AMAP-induced changes in phosphorylated p53 protein levels. TAMH cells were treated with 2 mM APAP or AMAP for two and six hours. Total cell lysates were analyzed by western immunoblotting with either (
Discussion
The goal of the present study was to identify a robust transcriptomic signature distinguishing the toxicologic differences between APAP and AMAP utilizing multiple model systems for APAP-induced toxicity across multiple microarray platforms. The two systems used in this study are well-characterized models for APAP-induced hepatotoxicity. The in vitro model (TAMH), an immortalized mouse hepatocyte line, 32 has been established as an acceptable cell culture model to study toxicologic differences between APAP and AMAP. This is due to the fact that TAMH express CYP2E1 and CYP3A proteins and show characteristic markers of APAP-mediated cell death processes that are accompanied by changes in cell morphology indicative of toxicity.17,33 Results from the exploratory and follow-up TAMH microarray studies were then compared with those of a previously published comprehensive multicenter study that used C57BL/6J mice, 7 a well-characterized in vivo model for APAP-induced hepatocellular injury.13,34,35
Transcripts with significantly large differential expression at all time-points across all array platforms were identified in order to enrich for robust gene expression changes likely responsible for the differential toxicologic outcomes following APAP and AMAP treatment. Only four transcripts, Atf3, Btg2, Gdf15, and Jun, were identified (Fig. 3), and while APAP-induced upregulation of transcripts was consistent in both models at all assayed time-points, there was one obvious discrepancy between the in vitro and in vivo models. In vitro mRNA expression levels of Atf3, Btg2, Gdf15, and Jun were relatively constant across all time-points, whereas in vivo expression levels fell after six hours (Fig. 4). This discrepancy might be due to the high drug concentration throughout the dosing regimen in vitro, which could explain the persistence of large differential expression across all time-points. In contrast, mice have the ability to clear the drugs and their metabolites, which may explain the loss of differential expression over time in vivo.
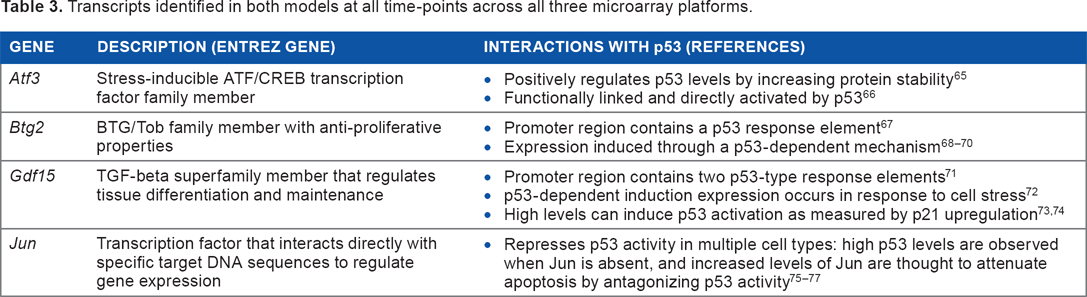
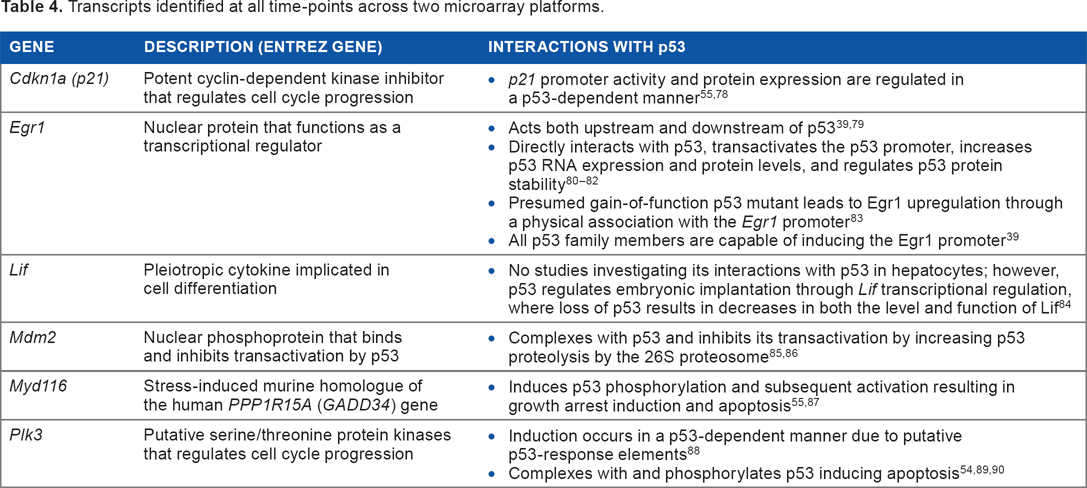
APAP-induced upregulation of six additional transcripts (Lif, Mdm2, Cdkn1a, Egr, Myd116, and Plk3) were identified along with Atf3, Btg2, Gdf15, and Jun when the gene list was expanded to include transcripts where significantly large differential expression at all time-points across multiple platforms was observed (Table 1). These data are consistent with recent findings that hepatotoxicant exposure promotes upregulation of a consensus early response gene signature that includes Egr1, Atf3, and Gdf15. 36 An exhaustive literature search was then performed to identify a common pathway for the majority of these genes. Interestingly, not only could all 10 transcripts be linked to p53 signaling, but all 10 transcripts have been implicated in p53 signaling pathways (Fig. 7). p53 is an extraordinarily well-studied tumor suppressor that plays a key role in the cellular response to genotoxic stress.19,37 Therefore, the identification of 10 transcripts unique to APAP treatment and associated with p53 would implicate a potential genotoxic mechanism in differentiating the toxicologic outcomes of APAP and AMAP. Proposed mechanisms by which the four transcripts identified in both models at all time-points across all three microarray platforms (Atf3, Btg2, Gdf15, and Jun) modulate p53 signaling can be found in Table 3, whereas the proposed mechanism by which the remaining six transcripts identified at all time-points across two microarray platforms (Cdkn1a, Egr1, Lif, Mdm2, Myd116, and Plk3) modulate p53 signaling can be found in Table 4.
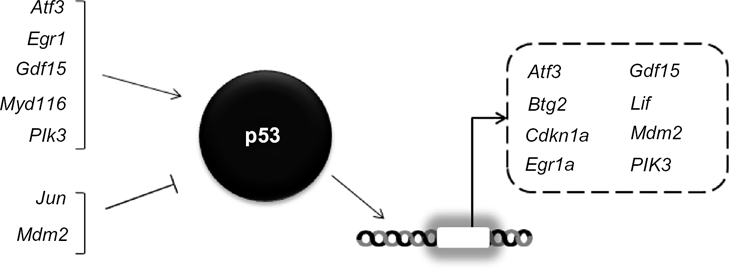
Differential expression of transcripts related to p53 signaling by APAP relative to AMAP treatment was consistently identified in both in vitro and in vivo models. Robust differential expression of the 10 genes associated with p53 signaling listed above (though not p53 itself) were identified following APAP and AMAP treatments at all time-points in multiple microarray platforms. Atf3 and Mdm2 are listed twice as they are known to act both upstream and downstream of p53 signaling.
Transcripts identified in both models at all time-points across all three microarray platforms.
Transcripts identified at all time-points across two microarray platforms.
Taken together, upregulation of these 10 transcripts, all of which are associated with p53 activity at all-time-points in multiple platforms, implicates a role for p53 in differentiating the toxicologic outcomes of APAP and AMAP (Fig. 7), especially considering that all these genes except for Jun and Myd116 have published reports of p53 response elements in their promoter regions.38,39 Only two of the transcripts identified (Jun and Mdm2) are generally associated with negative p53 regulation. While these observations contradict the proposed model for p53-mediated APAP-induced toxicity, there have been reports of concomitant upregulation of Jun and p53 during apoptosis. 40 JNK, an upstream kinase that phosphorylates Jun, also phosphorylates p53, leading to an increase in p53 stability, transcriptional activity, and apoptotic capacity.41–43 APAP-induced JNK activation has not only been shown previously to potentiate APAP-induced hepatocellular injury44–46 but also to distinguish toxicological differences between APAP and AMAP. 17 Likewise, the identification of Mdm2 as a proposed mediator of APAP toxicity may appear counterintuitive since it is a known antagonist of p53 activity. At first glance, it would appear that high levels of Mdm2 mRNA would equate to high Mdm2 protein levels and thus increased p53 degradation. However, the Mdm2- p53 interaction is not so straightforward. Negative regulation of p53 by Mdm2 only occurs at the protein level, and many regulatory factors are capable of acting on Mdm2 to preserve p53 stability and stabilize function. Additionally, post-translational modifications to Mdm2, such as phosphorylation, have been shown to inhibit Mdm2-directed turnover of p53. 47 At the transcriptional level, p53 protein regulates Mdm2 expression through a p53 DNA-binding site and a genetically responsive element demonstrating an Mdm2--p53 autoregulatory loop. 48
The identification of these robust p53-related transcripts associated with APAP-induced toxicity is corroborated by other studies in which similar gene expression changes were observed in comparisons between APAP and AMAP treatments (Table 2). Numerous toxicogenomic studies in murine models investigating APAP-induced changes without AMAP treatment comparisons have also been performed over the past 15 years, many of which utilized biologic assays to phenotypically anchor the involvement of toxicologic mechanisms leading to hepatocellular injury (Table 5). Results from these studies have led to consistent identification of transcriptional biomarkers associated with exposure to toxicologically relevant concentrations of APAP. 49 In fact, 8 of the 14 genes listed in Table 2 have been corroborated by these studies (Atf3, Ddit3, Dnajb1, Egr1, Gadd45a, Hsph1, Jun, Myd116).11–14
Gene expression studies investigating the effects of APAP exposure in murine models both in vitro and in vivo.

studies comparing APAP and AMAP structure-toxicity profiles.
equivalent AMAP dose administered.
While comparisons between the in vitro and the in vivo models provide consistent transcriptomic correlations across different platforms, emphasis should be placed on the key transcripts identified coupled with the p53 protein findings. There is some evidence implicating increased p53 protein levels following APAP treatment in murine liver, 50 which is consistent with the results presented here (Fig. 5). However, other studies in non-hepatic models have demonstrated that APAP-induced changes in p53 protein expression were cell-type-dependent across multiple breast cancer cell lines 51 or decreased in C6 glioma and LLC-PK1 cells. 22 In addition to the use of different model systems, the discrepancy between our results and those presented by Lee et al might be due to their use of a higher APAP dose (5 mM) or the use of dimethylsulfoxide (DMSO) as a vehicle control, which has been shown to alter p53 levels in some cell types. 52 However, it is worth noting that APAP did induce S15 phosphorylation in both TAMH (Fig. 6) and in C6 glioma cells, 22 which is associated with p53 regulation in response to cell stress signals. 53 Furthermore, the consistent upregulation of Myd116 and Plk3 transcripts observed in this study (Table 1) has been associated with increased N-terminal p53 phosphorylation54,55 and modulation of p53 stability and activity.56,57
In this study, APAP treatment also led to increased phosphorylation at S392 compared to AMAP and control (Fig. 6B). This is the first published evidence of dual p53 phosphorylation at both S15 and S392 in APAP-induced liver toxicity. In vitro studies have shown that S392 phosphorylation may prevent nuclear exportation of p53 58 and enhance p53 binding to sequence-specific DNA sites. 59 Increased dual phosphorylation of p53 at S15 and S392 following APAP treatment (Fig. 6) would suggest that not only is DNA damage occurring in response to cell stress (S15 phosphorylation) but p53-mediated transcriptional activity may also be enhanced due to an increase in nuclear stability of p53 (S392 phosphorylation). This proposed mechanism would explain the robust transcriptional response that was observed in p53-responsive genes across microarray platforms and model systems (Table 1). It also bears repeating that no differential expression of p53 mRNA was observed following APAP and AMAP treatments in any model across any time-point, suggesting that p53 activity as opposed to p53 transcription is the driving force behind APAP-induced toxicity compared to AMAP. Coupled with the transcriptomic findings, the protein-based analysis further indicates a cellular stress response and implicates p53 as an important biological pathway involved in the response to tissue damage.
Lastly, it is important to discuss the relationship between oxidative stress and p53 signaling. In 2008, it was reported that p21, Gdf15, Plk3, Atf3, Ddit4, Gadd45a, Btg2, Ndrg1, and Trp53inp1 were the genes most commonly upregulated in response to diquat-induced oxidative stress across three C57BL/6J mouse strains (wild-type, Gpx1−/−, and Sod−/−). 60 All nine of these oxidative-stress-responsive p53 target genes are predominately involved in cell cycle arrest rather than apoptosis. 61 Of greater interest is the fact that five of these nine transcripts were identified in our analysis (Table 1). This consistency further supports a mechanism by which APAP, and not AMAP, exerts its toxicologic effects on cells through p53-mediated processes induced by oxidative stress. Strong evidence already exists suggesting that APAP treatment generates oxidative stress and subsequent JNK activation in mice.17,46,62 Additionally, the prolonged half-life of pro-oxidant APAP metabolites (ie, NAPQI), compared to the shorter-lived and more reactive pro-oxidant AMAP metabolites (ortho/para quinones), leads to greater dispersion of NAPQI throughout the cell (ie, mitochondrial damage), which may result in prolonged exposure to oxidative stress and thus potentiating p53-mediated processes. 63
Conclusion
In conclusion, transcriptomic comparisons between APAP and AMAP using a well-characterized in vitro mouse model (TAMH) across two Affymetrix array platforms (Mouse Genome 430 2.0 and Mouse Gene 1.0 ST) with a well-characterized in vivo system (C57BL/6J mice) on an Agilent Oligonucleotide array 7 identified activation of p53 signaling as an important factor in APAP-induced toxicity at the transcriptional level. Furthermore, upregulation of the majority of the p53-related transcripts identified in this study are oxidative-stress-responsive, and their involvement in cell cycle arrest rather than apoptosis suggests that APAP-induced p53 signaling may contribute to the absence of apoptosis during APAP induced hepatocellular injury. 64 This APAP-induced transcriptional activation is related to increased phosphorylation at serine residues in both the N- and C- termini of p53. Along with the transcriptional data, the activity of p53 was analyzed, enabling us to place the transcriptional changes in the context of the wider biological response. By utilizing AMAP/APAP structure–toxicity relationships, this study demonstrated p53 signaling as a contributor to differentiating the toxicities of the regioisomers.
Author contributions
Conceived and designed the experiments: BDS, MLG, DQN, FMF, SDN. Analyzed the data: BDS, MLG, DQN, RPB, TKB. Wrote the first draft of the manuscript: BDS. Contributed to the writing of the manuscript: BDS, MLG, DQN, TJK, SDN. Agree with manuscript results and conclusions: BDS, MLG, DQN, RPB, TKB, FMF, TJK, SDN. Jointly developed the structure and arguments for the paper: BDS, MLG. Made critical revisions and approved final version: BDS, MLG, TJK. All authors, with the exception of SDN, reviewed and approved of the final manuscript.
Footnotes
Acknowledgment
We would like to dedicate this work to Professor Sid Nelson, an inspirational teacher and scientist who passed away prior to the completion of this manuscript.