
Abstract
Inter-individual variation in CCAAT/enhancer binding protein gamma (CEBPG) transcript expression in normal human bronchial epithelial cells (NBEC) is associated with predisposition to lung cancer. We hypothesize that this inter-individual variation is in part explained by cis-acting genetic variation in CEBPG. To test this hypothesis we measured transcript expression derived from each parental copy of CEBPG (ie, allele-specific expression; ASE). There was a significant 2.9-fold higher cell cycle-specific variation in ASE of CEBPG rs2772 A compared to C allele (
Keywords
Introduction
The CCAAT/enhancer binding protein (CEBP) family of transcription factors is integral to normal functioning of a wide variety of cellular processes in numerous tissues. 1 Dimerization of CEBP transcription factors is required for recognition and binding of palindromic cytidine-cytidine-adenosine-adenosinethymidine (CCAAT) box DNA motifs. 12 Once dimerized and bound to DNA, CEBP family members regulate transcription of nearby genes through recruitment of co-regulatory and basal transcriptional machinery. 1 Regulation is achieved through a trans-regulatory domain shared by all but one CEBP family member, CCAAT/enhancer binding protein gamma (CEBPG). Because it lacks this trans-domain, under certain conditions CEBPG serves as a regulator and buffering reservoir against the transcriptional activities of the other CEBP family members.1,2
Previous studies support the conclusion that CEBPG is the primary transcription factor responsible for regulating key antioxidant and DNA repair transcript levels in normal human bronchial epithelial cells (NBEC),3–5 and that transcriptional regulation by CEBPG is dysregulated in NBEC of those individuals predisposed to lung cancer.4,5 In other studies, mice without CEBPG exhibit emphysematous lung histology, abnormally low type II pneumocyte density and early death, which suggests that expression of CEBPG is in part responsible for the promotion of normal airway epithelial cell development and proliferation. 6 Targeted disruption of only one other CEBP family member, CCAAT/enhancer binding protein alpha (CEBPA), results in abnormal lung histology.7,8 However, in contrast to mice who lack CEBPG, mice without CEBPA display hyperproliferation of type II pneumocytes. These contrasting effects on pneumocyte development and proliferation may be a manifestation of the co-regulatory relationship between CEBPG and CEBPA. 2 It is likely that regulation of CEBPG transcript expression affects airway epithelial proliferative patterns indirectly by modulating CEBPA function and JNK/JunD activity through heterodimerization.9,10 In turn, this relationship regulates E2F1 transcript levels, and both E2F1 and JNK/JunD activity directly participate in the control of cell proliferation.9,10 Recently, a haplotype comprising a polymorphic cluster (rs10518275 and rs4805877) in strong linkage disequilibrium with polymorphic site rs2772 in Exon 2 of CEBPG was found to be associated with altered severity of cystic fibrosis lung disease. 11 These findings, in conjunction with previous reports from our lab and others, suggest that cis-acting genetic variation is in part responsible for altered CEBPG transcript expression levels, which in turn may modify severity and risk for a variety of lung pathologies including lung cancer; possibly through dysregulation of airway epithelial cell proliferation and development, as well as antioxidant and DNA repair capacity.3–6
In this study, we sought to determine if genetic variation at cis-acting sites contributes to inter-individual variation in CEBPG transcript expression in normal human bronchial epithelial cells (NBEC). The effect of cis-acting genetic variants typically is not observable as variation in total mRNA expression due to often more pronounced trans-effects. 12 Thus, to test this hypothesis we measured allele-specific expression (ASE); that is, the transcript expression derived from each parental copy of CEBPG within individual samples. 13 Because each cis-acting allele within the same cell is subject to exactly the same trans-effect at all times, allele-specific expression differences become more apparent.13,14
To better isolate the effect of cis-acting genetic variation on CEBPG expression using ASE we sought to establish an experimental cell-culture system in which substantial variation in trans-factors regulating CEBPG could be induced experimentally. We reasoned that variation in one or more of the trans-factors regulating CEBPG transcript levels would act through cis-regulatory sites and that genetic variation (heterozygosity) at those regulatory sites would result in a different level of transcript produced from each parental chromosome. Using this approach we could narrow down which cis-acting genetic variant(s) influence CEBPG transcript expression, and then derive their general mechanism of action. In previous studies we determined that cell-cycle specific trans-effects regulate CEBPG transcript levels.3,14 Therefore, for these studies we employed a cycle-synchronized cell line model and, as trans-effects varied during the cell cycle, we measured CEBPG ASE using allele-specific competitive PCR. 14 We also investigated whether observed RNA polymerase II (RNAPII) activity exhibited bias in transcription between the parental copies. 15 This approach was designed to answer whether any ASE resulting from trans-effects on cis-acting genetic variation was due to effects on transcription rate, which would be measurable as RNAPII activity, or effects on a mechanisms downstream of RNAPII activity (ie, post-transcriptional; eg, micro-RNA consensus site modification). We applied this same ASE analysis to NBEC complementary DNA (cDNA) from 15 human subjects to also assess whether cis-acting genetic variation alters transcript expression derived from each parental copy in primary normal human airway epithelium.
Materials and Methods
Design of allele-specific competitive template internal standards
A competitive template internal standard was prepared for each allele at the rs2772 polymorphic site in Exon 2 of the CEBPG gene according to previously described ASE measurement methods (Fig. 1A and B). 14 Each internal standard was designed to include: (1) a small internal sequence deletion to permit electrophoretic size separation from the co-amplified native template (Fig. 1B) and (2) the same forward and reverse priming sites as the corresponding native template to ensure equivalent amplification upon use of the same primers. 16 The only differences between competitive templates for each allele were: (1) the 3′-terminus sequence of the priming site directly overlying the polymorphic site of interest and (2) a difference in the size of the small internal deletion allowing for electrophoretic size separation between each competitive template (Fig. 1B). Newly synthesized allele-specific internal standards were individually quantified on an Agilent 2100 Bioanalyzer using DNA Chips with DNA 1000 Kit reagents for visualization according to manufacturer's protocol (Agilent Technologies Deutschland GmbH, Waldbronn, Germany). Quantified internal standards were then combined in a known stochiometric molar ratio (1:1) to create a stock concentrated standardized mixture of internal standards (SMIS). This mixture of allele-specific internal standards was serially diluted to working concentrations, 16 then used in all subsequent experiments as a reference mixture of standards for quantifying absolute and/or relative allelic levels in native DNA samples. Further details regarding the design and use of allele-specific internal standards in competitive PCR are available as supplementary material online.
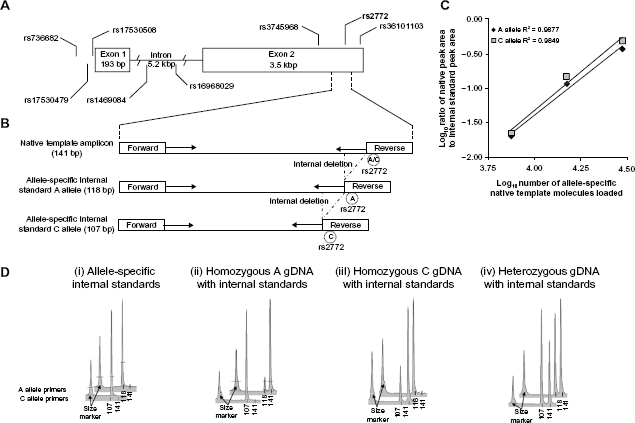
CEBPG allele-specific competitive PCR primer design and performance. (A) Schematic of CEBPG gene including location of polymorphic site rs2772 (A/C alleles) used for allele-specific priming and seven nearby putative c/s-functional polymorphic sites. (B) Schematic of native template and internal standard template for each allele at rs2772, with position of forward and reverse primers. The internal deletions in A allele and C allele internal standards were generated through PCR using reagents presented in supplementary materials online. (C) Plot of the ratio of Native Template to Internal Standard Peak area versus number of internal Standard Molecules loaded for Electropherograms that were within a 1:10 to 10:1 ratio of peak areas. (D) Representative electropherograms of PCR reaction products. Top row of electropherograms = A allele-specific primers (CEBPG rs2772 F1 with CEBPG rs2772 R-A3) and internal standard. Bottom row = C allele specific primers (CEBPG rs2772 F1 with CEBPG rs2772 R-T3) and internal standard. Numbers below electropherogram peaks are in units of base-pairs. Amplicon sizes: A and C allele native amplicons each = 141 bp; A allele internal standard amplicon = 118 bp; C allele internal standard amplicon = 107 bp.
Measurement of allele-specific CEBPG expression
Total RNA was extracted from A549 cell-line and NBEC using TriReagent and reverse transcribed using M-MLV reverse transcriptase and oligo-dT primers as previously described. 4 Genomic DNA was extracted as previously described. In order to maximize information obtainable from the very small NBEC cDNA samples, the region used for allele-specific measurement of CEBPG Exon 2 was pre-amplified using a non allele-specific primer pair (Supplementary Materials Online). CEBPG transcript abundance in terms of transcript copy number/μL cDNA was determined previously for each of the samples used in this study.4,5 Based on these results, it was possible to determine the necessary volume of each cDNA sample to ensure at least 1,000 copies of transcript in each reaction in order to eliminate effect of stochastic sampling variation. 17 The presence of genomic material in cDNA before pre-amplification was controlled for by using commercially available reagents for measurement of genomic DNA contamination (Accugenomics, Wilmington, NC). Following pre-amplification, Exon 2 amplicons were quantified by densitometry using an Agilent 2100 Bioanalyzer, and subsequently diluted to 10–13 molar concentration. Allele-specific competitive PCR was then performed by combining a 1 μL aliquot of pre-amplified Exon 2 from either cDNA or gDNA with a 1 μL aliquot of 10–13 molar standardized mixture of allele-specific internal standards in parallel PCR reactions with a primer set specific to each allele. After allele-specific amplification, products were electrophoretically separated and quantified on an Agilent 2100 Bioanalyzer. Each CEBPG allele was measured in triplicate from a single pre-amplification of each cDNA or gDNA sample. Allele-specific measurement of polymorphic site rs2772 in CEBPG Exon 2 of A549 ChIP DNA was done as described for measurement of allele-specific CEBPG expression in A549 and NBEC cDNA. Sequence information for pre-amplification and allele-specific primers is reported in supplementary materials online.
Cell-line samples
In order to measure transcript expression from each parental copy of CEBPG in a single sample (also known as allele-specific expression; ASE), a genetic marker informing from which parental copy the transcript was derived must be present. Polymorphic site rs2772 (A and C alleles) was chosen as the transcribed marker for these studies, as it is the only known polymorphic site with a minor allele frequency >10% that is present in CEBPG processed mRNA (Fig. 1A). Based on Hardy-Weinberg Equilibrium assumptions, it was anticipated that ~20%–30% of samples would be heterozygous, and thus usable for measuring transcript expression from each parental copy of CEBPG with ASE measurement approach. 8 human lung carcinoma cell-lines were genotyped using traditional sequencing methods for heterozygosity at polymorphic site rs2772 (University of Iowa DNA Sequencing Facility). Of the 8 cell-lines, only A549 cell-line was heterozygous at rs2772, and hence could be used for these studies.
A549 cell culture and cell-cycle synchronization model
A549 was cultured using RPMI 1640% + 10% FBS. A double thymidine block (DTB) was used to achieve cell-cycle synchronization in A549 cell-line as previously described. 18 Cells were seeded into T-75 flasks (no double thymidine block control, 0, 2, 4, 6, 8, 10 and 12 hours post double thymidine block time points) at a predetermined density such that they were 60% confluent at the time of the first thymidine block. Cells were harvested at appropriate time points; no block and 0 hour time points were harvested immediately. For each time point, following cell counting, aliquots were taken for RNA, flow cytometric analysis and Chromatin Immunoprecipitation analysis (ChIP). Total RNA was extracted from 500,000 cells using TriReagent. 1.5 million cells were resuspended and flash frozen in citrate buffer for flow cytometric analysis, and at least 4 million cells were processed for ChIP. Cell-cycle phase distribution was monitored using propidium iodide for nuclear staining, followed by subsequent detection using a Beckman/Coulter EPICS Elite flow cytometer as previously described. 19 The resulting data were analyzed by Multicycle software (Phoenix Flow Systems) and reported as the percentage of cells in S, G1 or G2/M phase. Complete details regarding chromatin immunoprecipitation (ChIP) methodology using normal rabbit polyclonal IgG sc-2027 control (Santa Cruz Biotechnology, Santa Cruz, CA), or rabbit polyclonal to RNA polymerase II CTD repeat YSPTSPS phospho-S2 (Abcam Inc., Cambridge, MA) antibodies can be found in supplementary materials online. For both E2F1 (cell-cycle biological positive control), ACTB (cDNA loading control) and CEBPG genes, total expression as well as total DNA pull down from ChIP was measured using previously described reagents. 4 E2F1 was chosen as a biological positive control for our cell-cycle experiments as its expression is regulated to some extent at the level of transcription. 20
Subjects
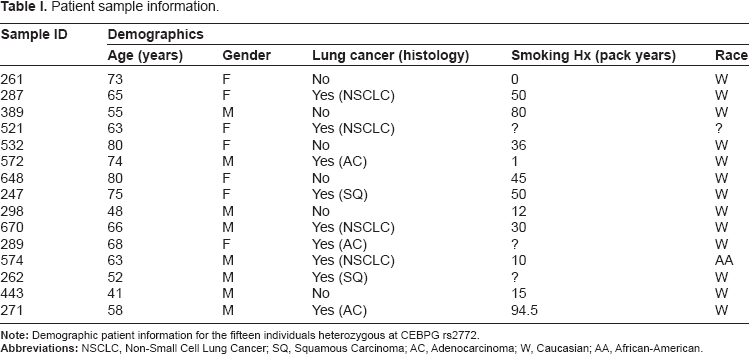
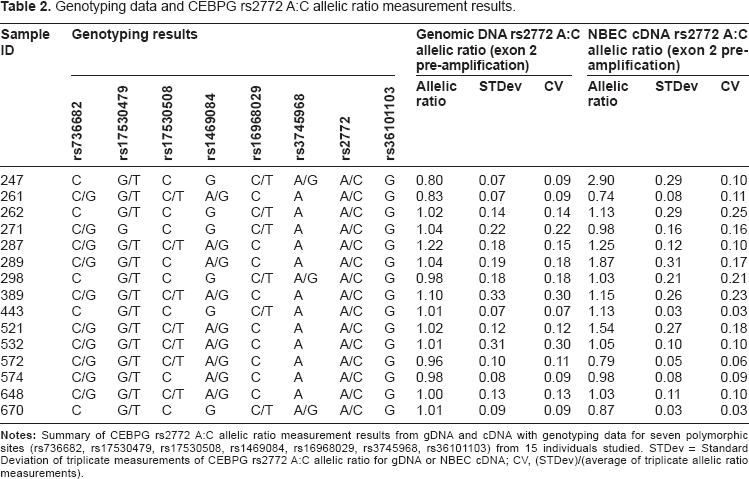
Normal bronchial epithelial cell (NBEC) samples from forty subjects were included in this study. Subjects were recruited at University of Toledo Medical Center (UTMC) according to a protocol approved by the UTMC institutional review board. Inclusion criteria for the subjects were: willingness and ability to give informed consent, scheduled for diagnostic bronchoscopy, and age between 18 and 90. Exclusion criteria were: HIV, Hepatitis B or C, TB infection, or medical instability. Pregnant women and prisoners were also excluded. For each participating subject, a NBEC sample was obtained by 3–5 cytology brush biopsies of grossly normal bronchial epithelium according to previously described methods. 4 For patients with known lung cancer diagnosis, sampling of NBEC was performed in the lung not involved with cancer. There were no patient adverse events resulting from collecting NBEC. All 40 patient samples were genotyped using traditional sequencing methods for heterozygosity at polymorphic site rs2772 (University of Iowa DNA Sequencing Facility). Of these subjects, 15 were heterozygous at polymorphic site rs2772, and subjected to additional genotyping at polymorphic sites in and around CEBPG representing the most common haplotype pairings representing greater than 95% of individuals: rs736682, rs17530479, rs17530508, rs1469084, rs16968029, rs3745968, and rs36101103. Genotyping data and biographical characteristics of the 15 individuals are presented in Tables 1 and 2.
Patient sample information.
Genotyping data and CEBPG rs2772 A:C allelic ratio measurement results.
Statistical analysis
Bartlett's test was used to assess homogeneity of variances between log-transformed ASE measurements performed in all gDNA and cDNA. 21 Fisher's distribution test (F-test) was used to assess inter-group variation in allele-specific CEBPG transcript expression in cDNA samples compared to allele-specific CEBPG products from corresponding gDNA samples. Student's T-test was performed to assess significance of deviation in central tendency of individual NBEC cDNA total and ASE measurements relative to corresponding gDNA controls, as well as measurements obtained from individual time points in A549 cell-cycle synchronized samples. Bonferroni correction for multiple hypothesis testing was applied when appropriate. Pearson's correlation was used to evaluate significance of correlation between total and allele-specific measurement of CEBPG in A549 cDNA and ChIP samples.
Results
Performance testing of allele-specific competitive PCR reagents
4 allele-specific primer sets were designed for each allele at the reporter polymorphic site rs2772, each with a 3′ mismatch over the polymorphic site and 3/4 that contained 1 of 3 possible mismatches at the 3′ penultimate base (Fig. 1A, B and supplementary materials online). 22 All 4 primer sets for each allele were assessed for allelic specificity in parallel PCR reactions with homozygous, heterozygous, or no native template DNA controls in the presence of allele-specific internal standards as previously described (Fig. 1D). 14 Out of the 4 primer sets tested for each allele, only the primer sets combining CEBPG rs2772 F1 primer with either CEBPG rs2772 R-A3 primer (A allele primer) or CEBPG rs2772 R-C3 primer (C allele primer) met allele-specificity performance criteria of less than 5% non-targeted allele amplification, 14 as demonstrated in electropherograms depicted in Figure 1D. As described before, to assess linearity of signal response, we titrated heterozygous native template relative to allele-specific internal standards over a 16-fold range in the presence of a constant amount of allele-specific internal standard mixture. 14 The acceptable threshold performance criterion for each allele was a signal-to-analyte response associated with an R 2 ≥ 0.95 in triplicate (Fig. 1C). Importantly, A and C alleles exhibited nearly identical slopes of signal-to-analyte response (R 2 = 0.9877 and R 2 = 0.9849, respectively; Fig. 1C). Performance observations for each primer set tested are annotated in supplementary materials online. Analytical variation was low both for replicate log-transformed measurements of cDNA samples (average analytical CV = 12.7%) as well as gDNA samples (average analytical CV = 14.9). Importantly, each gDNA sample assessed did not deviate significantly from a 1:1 relationship between A and C alleles at rs2772, indicating absence of genomic copy number variation among all samples assessed.
Cell-cycle synchronization
A549 cells were successfully synchronized using double thymidine block (Fig. 2A and B). The majority of cells (67.4%) in the no-block condition were observed to be in the G1 phase of the cell-cycle. Following synchronization, a majority of cells (60.1%, 63.8%, 77.1% and 60.0%) were in S phase during the 0, 2, 4 and 6 hour time points respectively, while most cells (82.5% and 89.5%) were in G1 during the 10 and 12 hour time points respectively. Notably, 80.0% of cells were evenly split between G1 and G2/M during 8 hour time point, which is consistent with an observed doubling of the number of cells harvested between 8 and 10 hour time points [data not shown].
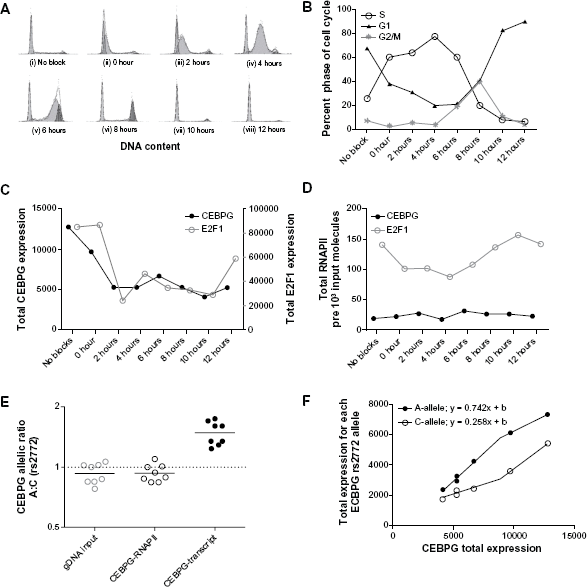
Cell-cycle results in A549 cell-line model. (A) Cell-cycle phase frequency distributions for no block and all time points post DTB. (B) Line plot reporting percentage of cells in G1, S and G2/M phases for results depicted in panel (A). (C) CEBPG and E2F1 transcript expression per 10 6 ACTB. (D) Total actively transcribing RNAPII molecules fixed to CEBPG or E2F1 transcribed region per 1000 input molecules. (E) Ratio of CEBPG transcript derived from parental chromosome with rs2772 A versus C allele. Ratio of actively transcribing RNAPII molecules fixed to CEBPG parental chromosome with rs2772 A versus C allele. (F) Allele-specific CEBPG expression per 10 6 ACTB of rs2772 A and C alleles as a function of total CEBPG cDNA molecules per 10 6 ACTB.
Total expression throughout cell-cycle
E2F1 and CEBPG transcript are at their maximum expression during G1/S transition (No Block and 0 hour time points) and decrease shortly thereafter (Fig. 2B and C). E2F1 total transcript displayed significantly higher expression during no block and 0 hour time points compared to 2, 6, 8 and 10 hours (
Rnapii activity throughout cell-cycle
Cell-cycle dependent changes in expression of E2F1 transcript are, in part, regulated at the level of transcription.
20
For this reason we chose to use RNA polymerase II phosphorlyated at serine 2 (RNAPII) bound to a transcribed portion of E2F1 locus as a biological positive control for changes in transcriptional activity throughout the cell-cycle. In these studies we compared positive control ChIP measurements of level of RNAPII bound to E2F1 gene (E2F1-RNAPII) and RNAPII bound to CEBPG gene (CEBPG-RNAPII). RNAPII bound to E2F1 genomic locus for No Block, and 10 and 12 hour time points were significantly higher than all other time points (
CEBPG Allele-Specific Expression and Rnapii Allele-Specific Activity
In cell-cycle synchronized A549 cells, CEBPG exhibited allele-specific expression ratios at polymorphic site rs2772 (A:C) ranging from 1.24 to 1.75 (normalized to A549 gDNA; average of 0.94) (Fig. 2E). Meanwhile, control measurement of actively transcribing RNAPII bound to CEBPG locus (CEBPG-RNAPII) was not significantly different than the null hypothesis of measuring a ratio of 0.94 (
Allele-specific expression measurement of CEBPG transcript in NBEC samples
CEBPG allele-specific transcript expression was measured in NBEC cDNA samples from 15 individuals heterozygous at transcribed reporter polymorphic site rs2772 and with varying allelotype at other putative regulatory polymorphic sites rs736682, rs17530479, rs17530508, rs1469084, rs16968029, rs3745968 and rs36101103 (Figs. 1 and 3, and Table 2). To control for potential genomic copy number variation, CEBPG allelic ratio was measured in gDNA samples from the same 15 individuals. Observed allele-specific expression ratios according to genotype are displayed in Figure 3. There was significantly higher (
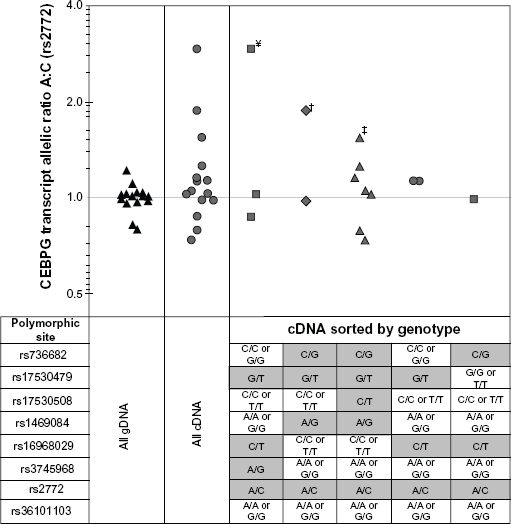
Measurement of CEBPG transcript rs2772 A:C allelic ratio in normal bronchial epithelium. Summary results from allele-specific competitive PCR measurement of CEBPG allelic ratio (ie, ASE) at polymorphic site rs2772 A and C alleles in NBEC gDNA (black triangles) and matched cDNA (grey symbols) for 15 individuals. Table below scatter plot indicates genotype of samples plotted above. For All gDNA and All cDNA, the group of samples comprising all allelotypes at polymorphic sites rs736682, rs17530479, rs17530508, rs1469084, rs16968029, rs3745968 and rs36101103 were compared together. For cDNA Sorted by Genotype, groups of samples with varying genotypes at seven putative c/s-acting polymorphic sites were compared separately (results for individual samples in Table 2). ¥ = sample 247, † = sample 289 and † = sample 521 A:C allelic ratio measurements were significantly different than gDNA controls.
Discussion
Traditional causes of allele-specific expression (ASE), such as genomic imprinting or X-chromosome inactivation are associated with complete silencing of expression from an allele or an individual parental chromosome. 13 In contrast, it is now known that a large percentage of non-imprinted autosomal genes exhibit a more subtle type of ASE,23–25 such as that observed with CEBPG in this study (Figs. 2 and 3). In this latter form of ASE, inter-allelic difference in expression typically varies approximately 1.2- to 1.6-fold away from an expected 1.0 ratio of expression between parental chromosomes.13,14 Importantly, ASE from these non-imprinted autosomal genes exhibit Mendelian patterns of inheritance.23,25 These observations suggest that subtle inter-allelic variation in expression is at least in part explained by variation in proximal (ie, cis-acting) sequences, differentially affecting the transcript expression abundance of alleles derived from each parental chromosome, and is a separate entity from classical imprinting phenomenon.
CEBPG total expression exhibited a cell-cycle specific profile similar to that of E2F1 (Fig. 2C). Yet, active RNAPII varied minimally at the CEBPG genomic locus compared to E2F1 measured RNAPII activity (Fig. 2D). In addition, although significant CEBPG ASE was observed, RNAPII allele-specific transcriptional activity was not (Fig. 2E). This suggests that regulation of both total and allele-specific CEBPG transcript expression is partly regulated at the post-transcriptional level. Further, during the course of the cell-cycle there was a 2.9-fold difference between rs2772 A and C alleles in responsiveness to factor(s) that regulate CEBPG total transcript levels (Fig. 2F). Accumulating evidence indicates that in order for cis-acting genetic variants to differentially regulate ASE, they must respond differently to trans-acting factors.15,26,27 If the trans-effect is constitutive in the tissue assessed, ASE should tightly associate with specific cis-genotypes in the population.14,28,29 Conversely, if there is inter-individual variation in trans-acting factor function, for example throughout the cell-cycle or in response to other environmental effects, ASE that is mechanistically important may be associated with cis-acting genetic variants in only some individuals. 27 In the cell cycle model presented here, cis-regulatory elements were constant, and hence the cause of variation in total and allele-specific CEBPG expression must have been due to variation in the total level of trans-factor activity operating downstream of RNAPII transcription of CEBPG (ie, post-transcriptional; Fig. 2F).
In order for cis-acting genetic variation to influence the post-transcriptional regulation of CEBPG, the polymorphic cis-element must be transcribed and present in the mRNA. Thus, the most plausible polymorphic cis-element that would explain the phenomenon observed here is rs2772 (3′UTR), and less likely rs17530479 (promoter region). As has been described for other genes, 30 genetic variation at a miRNA regulatory motif within the transcribed portion of CEBPG could alter post-transcriptional levels of CEBPG. Inputting CEBPG 3′UTR polymorphic site rs2772 into MirSNP database reveals that the C allele, but not the A allele, is a target site for miRNA hsa-miR-1248. 31 This finding is consistent with our observations that rs2772 C allele is on average expressed 2-fold lower than rs2772 A allele. Based on the literature, miRNA hsa-miR-1248 is upregulated during de-differentiation as well as epithelial inflammation,32,33 which is consistent with known effects of perturbing CEBPG expression.3–6
Normal human bronchial epithelial cells in vivo are typically quiescent.34,35 This information, combined with the fact that CEBPG total and allele-specific expression is regulated post-transcriptionally by a trans-effect(s) that is variable in activity (Fig. 2C and D), may explain why only 20% of primary NBEC samples assessed in this study, heterozygous for rs2772, exhibited allele-specific CEBPG expression (Fig. 3). Specifically, we observed that CEBPG rs2772 A allele was expressed 2.10-fold higher than C allele in 3 of 15 (20%) NBEC samples heterozygous for polymorphic site rs2772. This finding is interesting in light of a previous report by Lo et al, who observed that the CEBPG polymorphic site rs2772 A allele was expressed 2.42-fold higher than the C allele in 20% of fetal kidney tissues. 24
Numerous approaches for allele-specific transcript measurement have been described, 13 and many of these techniques rely upon the intrinsic quality control inherent in measuring relative allelic levels within a single reaction vessel. Despite this built-in quality control step, numerous additional known and unknown sources of analytical variation remain uncontrolled by this method alone and can potentially result in inaccurate and low precision of ASE measurement.17,36,38 In this study we implemented multiple additional quality control measures to address some of the potential sources of analytical error encountered in ASE association studies. Key to this effort was adaption of competitive PCR to allele-specific quantification. Properly designed competitive PCR offers highly reproducible measurement of DNA template copy numbers, wide linear dynamic range, superb target analyte specificity, and relatively low cost.16,17 Allele-specific competitive PCR combines competitive PCR with previously described allele-specific PCR priming 22 to precisely and accurately quantify alleles (Fig. 1).
In summary, we report that (a) rs2772 A allele expression varied approximately 2- to 3-fold more than rs2772 C allele during cell-cycling, (b) there was no significant correlation between RNAPII activity and observed CEBPG ASE in the cell-cycle synchronized A549 cell-line model, and (c) polymorphic site rs2772 in Exon 2 of CEBPG exhibited allele-specific expression in adult NBEC samples from some subjects, but not others. Thus, there is support for the hypothesis that cis-acting variants participate in regulation of CEBPG transcript levels and this partly explains inter-individual variation in CEBPG expression in NBEC. Importantly, the data suggest that a mechanism other than RNAPII mediated transcription regulation is responsible for this observed variation in ASE. Because CEBPG is an important regulator of airway epithelial proliferation and development, cis-acting genetic variation that alters the expression of CEBPG at the cusp of G1 and S phase has a high likelihood of involvement in the manifestation of a variety of lung pathologies, possibly through effects on CEBPA regulation of E2F1 activity, 9 or as a downstream modulator of JNK/JunD mediated proliferation. 10 Future work towards mechanistic understanding, including the responsible trans-acting factor, for association of genetic variant rs2772 with post-transcriptional regulation of CEBPG ASE in NBEC may result in improvement in screening and treatment for a variety of lung diseases. Prior data from this laboratory support the hypothesis that CEBPG coordinates regulation of key DNA repair and antioxidant genes in NBEC, and in other human epithelial cell models CEBPG plays a key role in regulation of cell proliferation.3–6 Based on these observations, additional studies are justified to further understand the exact mechanistic relationship between rs2772 genetic variation and inter-individual variation in CEBPG expression contributing to variation in the vitally important coordination of DNA repair with cell cycling.
Author Contributions
TMB conceived the research design, designed the reagents, supervised experiments and data analysis, and contributed to the writing of this manuscript. RDB conducted the experiments and data analysis, and contributed to the writing of this manuscript. ELC supervised experiments and contributed to the writing of this manuscript. YY and DAH assisted in collection of blood and bronchial epithelial cell brushings. IS supervised chromatin immunoprecipitation studies and associated data analysis. KW supervised cell-cycle studies and associated data analysis. JCW supervised the entirety of the research design, conduct of the experiments, data analysis, and writing of this manuscript.
Funding
National Institutes of Health (CA95806, CA103594, CA132806 to JCW) and George Isaac Research Fund.
Competing Interests
JCW has significant equity interest in Accugenomics, which produces and markets StaRT-PCR™ reagents used in this study. Other authors disclose no competing interests.
Disclosures and Ethics
As a requirement of publication the authors have provided signed confirmation of their compliance with ethical and legal obligations including but not limited to compliance with ICMJE authorship and competing interests guidelines, that the article is neither under consideration for publication nor published elsewhere, of their compliance with legal and ethical guidelines concerning human and animal research participants (if applicable), and that permission has been obtained for reproduction of any copyrighted material. This article was subject to blind, independent, expert peer review. The reviewers reported no competing interests.
Footnotes
Acknowledgements
We would like to thank the following individuals for their contribution: Thomas Sawyer and Karen Domenico for their expertise in flow-cytometric analysis.