
Abstract
The objective of this study was to explore the known narrow genetic diversity and discover single-nucleotide polymorphic (SNP) markers for marker-assisted breeding within Pima cotton (Gossypium barbadense L.) leaf transcriptomes. cDNA from 25-day plants of three diverse cotton genotypes [Pima S6 (PS6), Pima S7 (PS7), and Pima 3-79 (P3-79)] was sequenced on Illumina sequencing platform. A total of 28.9 million reads (average read length of 138 bp) were generated by sequencing cDNA libraries of these three genotypes. The de novo assembly of reads generated transcriptome sets of 26,369 contigs for PS6, 25,870 contigs for PS7, and 24,796 contigs for P3-79. A Pima leaf reference transcriptome was generated consisting of 42,695 contigs. More than 10,000 single-nucleotide polymorphisms (SNPs) were identified between the genotypes, with 100% SNP frequency and a minimum of eight sequencing reads. The most prevalent SNP substitutions were C–-T and A–-G in these cotton genotypes. The putative SNPs identified can be utilized for characterizing genetic diversity, genotyping, and eventually in Pima cotton breeding through marker-assisted selection.
Keywords
Introduction
Next-generation sequencing (NGS) technology offers affordable and faster sequencing of genomes and transcriptomes, enabling single-nucleotide polymorphism (SNP) marker discovery, high-throughput genotyping by sequencing, and RNA sequencing (RNA-Seq) gene expression studies in crop plants. In cotton, NGS platforms such as pyrosequencing and sequencing by synthesis have been used for SNP discovery in allotetraploid cotton, for comparison of fiber developmental genes between two cultivated tetraploid species, for differentially expressed gene analysis under salt stress in Gossypium aridum, and for water-deficit stress in Upland cottons.1–4 Evolutionary studies have also been conducted on diploids and polyploids through whole-genome re-sequencing for understanding the developmental dynamics of cotton fiber transcriptomes.5,6
Cotton (Gossypium spp.) is the most important natural fiber crop grown in around 80 countries worldwide. The genus Gossypium comprises over 50 species with more than five tetraploid (2n = 4x = 52) and over 45 diploid species (2n = 2x = 26). The two tetraploid species from the New World (Americas), Gossypium hirsutum L. (AD1 genome) and Gossypium barbadense L. (AD2 genome), and two diploids from the Old World (Asia–Africa), Gossypium herbaceum L. (A1 genome) and Gossypium arboreum L. (A2 genome), are the four cultivated species. None of the ancestral D diploid species produce commercial fibers. 7 Upland (G. hirsutum) and Pima (G. barbadense) are the two major species that supply this natural fiber to the textile mills worldwide. In the U.S., their total production accounts 95.5% for Uplands and 4.5% for Pimas (USDA National Agricultural Statistics Service 2013; http://www.ers.usda.gov). 8 Upland cotton is known for its yield and adaptation, while Pima cotton, also known as Sea Island, Egyptian, or extra-long staple, is known for its superior fiber quality (length, fineness, and strength). Pima's fiber is highly valued in the premium textile market. Although the species overlap in some regions or are sympatric, misidentification is rare because of the distinct morphological features (leaf, flowers, etc.) between these two species.9,10
Paucity of gene-based molecular markers and the narrow genetic base of high-yielding genotypes demand the additional discovery of gene-based SNP markers for marker-assisted breeding of genotypes tolerant to various biotic and abiotic stresses. However, because of the limited DNA polymorphism within cotton species, useful or informative simple sequence repeat (SSR) or SNP makers for genotyping and molecular breeding are limited. Though the SSR markers were extensively used for developing genetic maps and diversity studies, their numbers are limited in a genome. Approximately 17,000 pairs of SSR primers have been developed from four cotton species (G. arboreum, G. raimondii, G. hirsutum, and G. barbadense) for use as potential molecular markers.11,12
SNPs are the most abundantly available molecular markers in plants, even in species that are restricted in their genetic diversity. 13 In cotton, initial SNP marker development has been slow and costly, and few SNP markers were made available.14–16 With the availability of NGS technology, sequencing has become faster and cheaper and is being used of late to identify larger number of SNP markers.1,2,17–21 On the other hand, there was considerable progress toward the development of new cotton genomic resources. Two genome-sequencing projects of the diploid cottons have been completed; one of the ancestral progenitors of the A genome (G. arboreum–-A2) and the closest relative, D genome (G. raimondii–-D5), to the tetraploids reported by two groups.22–24 More recently, the cultivated Upland tetraploid (AD1) G. hirsutum acc. TM-1 genome and the Pima tetraploid (AD2) G. barbadense genomes were published, providing insights into genome evolution and a resource for fiber improvement.25–27 Reference transcriptome of TM-1 and its use for SNP discovery were also reported. 28
In this study, we report the de novo assembly of leaf transcriptomes of three Pima genotypes (PS6, PS7, and P3-79) and the development of a reference leaf transcriptome from leaves grown under optimum conditions as a baseline resource for use in future studies. More than 10,000 functional SNPs were identified among these genetically diverse Pima genotypes. Pima tetraploid reads were mapped to tetraploid Upland acc. TM-1, diploid A and D predicted genes to understand the similarity between various transcriptomes.
Methods
Plant material
The plant material for this study consisted of three genetically diverse Pima (G. barbadense) cotton genotypes, Pima S6 (PS6), Pima 3-79 (P3-79), and Pima S7 (PS7). Seeds were sown into 2 L pots containing a 1:1 ratio of Sunshine Mix #1 potting soil (Sun Gro Horticultural) and grown under full irrigation and approximately 28/20°C–-(day/night) at the USDA-ARS, Plant Stress and Germplasm Development Research Unit glasshouse in Lubbock, TX, USA. For each genotype, four plants representing four biological plant replicates were used for sampling. Two leaves from 25-day-old plants were collected from each of the four plants, flash-frozen in liquid nitrogen, and stored at –80°C until RNA extraction.
RNA isolation, quantification, and quality
The leaf samples from each genotype were ground in liquid nitrogen, and total RNA was isolated from leaf samples following the manufacturer's instructions using Spectrum™ Plant Total RNA kit (Sigma-Aldrich). After isolation, the yield and purity of RNA were analyzed using an ND-1000 Spectrophotometer (NanoDrop Technologies). Only RNA samples with 1.8:2.2 ratio of absorbance 260/280 nm were kept for further analysis. In addition, the integrity of RNA was measured on a TapeStation 2200 (Agilent), following the manufacturer's instructions. Only samples with RNA Integrity Number (RINe) greater than 8.0 were used for cDNA library preparation.
cDNA library preparation
For each genotype, 1 µg of RNA from each of the four biological replicates was pooled (4 µg) into a single sample and used for cDNA library preparation. The cDNA libraries were prepared following the TruSeq RNA Sample Preparation v2 low sample (LS) protocol guide (Illumina Inc.). Poly(A)-containing mRNA was purified twice using poly(T) oligonucleotide-attached magnetic beads. In the second elution, the Poly(A) RNA was fragmented and primed for cDNA synthesis at 94°C in an attempt to obtain a median insert size of 180 bp fragment. The fragmented RNA templates were primed with random hexamers, and the first strand was synthesized by four cycles of 25°C for 10 minutes, 42°C for 50 minutes, and 70°C for 15 minutes. Following second strand synthesis (16°C for one hour), end repair was performed to generate blunt ends followed by adenylating of the 3′ blunt-ended double-stranded cDNAs to allow for subsequent ligation of multiple indexing adaptors. cDNA fragments were amplified and enriched using 15 cycles of PCR according to Illumina TruSeq RNA Sample Prep v2 LS protocol. The libraries were quantified using a Qubit® 2.0 Fluorometer (Life Technologies), and the quality was analyzed with the TapeStation 2200 (Agilent) using the D1K tape for validating the purity and estimating the insert size.
Sequencing using Illumina MiSeq™ platform
Validated cDNA libraries were denatured with NaOH and normalized to 10 nM concentration. Each of the 10 nM cDNA libraries were diluted to 4 nM with hybridization buffer and multiplexed. A final concentration of 5.4 pM was loaded onto the MiSeq Reagent cartridge (MiSeq Reagent Kit v2 300 cycles; Illumina Inc.). The multiplexed cDNA library was sequenced using a MiSeq Sequencer (Illumina Inc.).
Data Analysis
De novo assembly of leaf transcriptomes
Paired-end sequencing reads from each genotype were used for de novo assembly using the SeqMan NGen module of the Lasergene Genomics Suite 11.2 (DNASTAR, Inc.). The recommended default parameters were used, except for the minimum match percentage that was set to 90% for the assembly of the reads. After the de novo assembly of sequence reads into contigs from each genotype, a consensus reference leaf transcriptome was developed using CAP3, using the contigs obtained by de novo transcriptome assembly of individual genotypes. 29 For CAP3 assembly, we have used default parameters presented in Ref. 29 (141.80.164.19/bioinf_dokus/cap3/cap3.rtf). In addition, we used an in-house python script to organize and reorder the contigs with continuous numbering when joining sets (output files from CAP3–-common contigs and singlets) or creating a consensus set of contig file. Moreover, CLC Genomics software 5.5.1 (http://www.clcbio.com/) was used to check the quality of the reads and also to map the reads of the Pima genotypes to the published predicted genes of the Upland TM-1 and to the published A and D transcriptomes of diploid cottons.22,24–26 In CLC Genomics, default parameters were used with de novo sequencing module (here, contigs as published predicted genes of the Upland TM-1 and diploid cottons), and CLC default mapping parameters were as follows: read alignment mismatch cost: 2, insertion and deletion cost: 3, length fraction: 0.5, and similarity fraction: 0.8.
Annotation of reference transcriptome
The Pima leaf reference transcriptome was annotated using Mercator tool (http://mapman.gabipd.org/web/guest/app/mercator). 30 The Mercator is a fast and simple web server for genome-scale functional annotation of plant sequence data. Its tool generates functional predictions by searching six reference databases (three through BLAST based, two RPSBLAST based, and InterProScan), eg, IPR, PPAP, TAIR, KOG, etc. Imported sequences are assigned in 34 Bins of functional processes.
SNP identification and validation
As the first step, SNPs were identified in the leaf transcriptomes of Pima genotypes using targeted transcriptome assembly comparison with SeqMan NGen 11.2. In the SeqMan NGen, the individual reads from a specific genotype (PS7 or P3-79) were mapped on to an individual genotype de novo transcriptome assembly (PS6–-26,369 contigs or PS7–-25,870 contigs) to discover genotype vs. genotype-specific SNPs. The default parameters were used for advanced trim/scan options and advanced assembly options with k-mer size 21, except for the minimum match percentage that was set to 90% for the assembly of the reads instead of 93%. SNPs were further identified, selected, and visualized using SeqMan Pro. Default parameters used with SNP calculation method “Others” were as follows: minimum SNP percentage: 5, SNP confidence threshold: 10, minimum SNP count: 2, and minimum base quality score: 20. In addition, 100% SNP frequency based on the alignment of a reference contig and minimum of 4–8 sequence reads were examined to distinguish and select putative SNPs.
A selected set of annotated transcripts or genes containing putative SNPs between two different Pima genotypes were further evaluated and validated for SNPs. Beacon Designer software v8.13 was used to design primers with an average melting temperature (Tm) of 57°C and a length of 20 bp. Primer pair flanked the putative SNP and amplified an amplicon, ranging from 90 to 150 bp. High-resolution melting (HRM) analysis was performed to identify SNPs between genotypes using iQ™ SYBR® Green Supermix (Bio-Rad) on a CFX96™ Real-Time system with a C100™ thermal cycler (Bio-Rad).31,32 For HRM analysis, the temperature is gradually increased, and fluorescence is monitored as a function of the temperature. As the temperature rises, the fluorophore is released from the denaturing dsDNA and the fluorescence decreases with a noticeable change in slope at the Tm of the dsDNA. HRM analysis generates DNA melt curve profiles that are both specific and sensitive enough to distinguish nucleic acid species based on small nucleic acid differences, detecting single base sequence variations such as SNPs, or to discover unknown genetic mutations. DNA from the three genotypes (PS6, PS7, and P3-79) was used to validate the SNPs.
Results
cDNA sequencing and de novo assembly
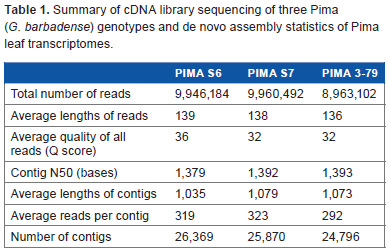
The cDNA library sequencing of the three diverse genotypes (PS6, PS7, and P3-79) from leaves of 25-day-old plants using MiSeq sequencer yielded 9.94, 9.96, and 8.96 million reads, respectively, and the average length of reads ranged between 136 and 139 bp (Table 1). The average Q score of all mapped reads was 33.3, and the graphical representation of the Q scores and GC content of the reads are provided in Supplementary Figure 1, as visualized using CLC Genomics software 5.5.1. The de novo transcriptome assembly of reads using the SeqMan NGen module of the Lasergene Genomics Suite 11.2 from individual genotypes resulted in 26,369, 25,870, and 24,796 contigs for PS6, PS7, and P3-79, respectively. The average length of assembled contigs ranged between 1,035 and 1,079 bp, and the contig N50, a value defined as the contig length where half of the assembly is represented by contigs of this size or longer, was 1,379, 1,392, and 1,393 bp for PS6, PS7, and P3-79, respectively. This represents optimum de novo assembly of the reads generated by RNA-Seq (Table 1).

Functional categorization of Pima leaf reference transcriptome consisting of 42,695 contigs using Mercator tool (http://mapman.gabipd.org/web/guest/app/mercator).
Summary of cDNA library sequencing of three Pima (G. barbadense) genotypes and de novo assembly statistics of Pima leaf transcriptomes.
When the contigs from de novo assemblies of the three genotypes were combined using the CAP3 software, a total of 18,012 contigs were obtained as consensus contigs in all the three genotypes, and 24,683 contigs were singlet sequences present only in individual Pima genotypes. 29 A Pima leaf reference transcriptome of 42,695 contigs was obtained by combining consensus contigs and singlet sequences into a Pima reference transcriptome, using an in-house python script. The sequencing data from the leaf transcriptomes were submitted to the NCBI Sequence Read Archive database under the BioProject ID: PRJNA 290525.
Annotation of Pima leaf reference transcriptome
Pima leaf reference transcriptome of 42,695 contigs at the initial leaf development stage (25 days after planting) was annotated using the Mercator tool http://mapman.gabipd.org/web/guest/app/mercator; Supplementary Table 1) and was assigned into 34 functional categories. 30 Majority of genes were related to functional categories such as protein, RNA, signaling, transport and cell development, followed by enzyme families, stress, lipid metabolism, hormone, and photosynthesis (Fig. 1).
Identification of SNP markers and validation
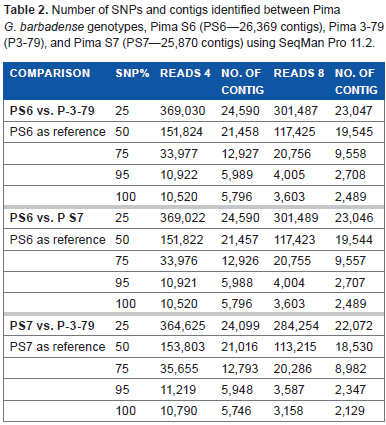
To identify candidate SNPs between the Pima genotypes, the PS6 transcriptome set of 26,369 contigs was used as reference for comparison with paired-end reads of P3-79 (9.94 million) and PS7 (9.96 million). Subsequently, PS7 transcriptome set of 24,870 contigs was used for comparison with paired-end reads of P3-79. Using the SNP discovery method of SeqMan Pro with filter parameters of SNP percentage 50 (frequency or match to a reference contig) and a depth of four sequence reads, we identified 151,824, 151,822, and 153,803 putative SNPs between PS6 vs. P3-79, PS6 vs. PS7, and PS7 vs. P3-79 pairwise genotype comparisons, respectively (Table 2). When the filter parameters were increased for % match (75, 95, and 100) of SNPs, the number of SNPs between two genotypes decreased drastically. More than 10,000 SNPs were identified between genotypes with 100% SNP frequency based on the alignment of a reference contig and a minimum depth of eight sequence reads. The high stringent filters of 100% SNP match and depth of 8 reads revealed 3,603 (PS6 vs. P3-79), 3,603 (PS6 vs. PS7), and 3,158 (PS7 vs. P3-79) SNPs for the three different comparisons of these genotypes (Table 2). The most prevalent SNP substitutions were C–-T and A–-G, while for indels, substitutions were A and T nucleotides (Fig. 2). Additional information about SNP inter-homeologue polymorphisms is presented in Supplementary Table 2. Also, Figure 3 presents an SNP with a high cutoff of 100% and more than 65 read depth, in which the contig 573 is from PS6 and ID numbers of reads are from P3-79.
Number of SNPs and contigs identified between Pima G. barbadense genotypes, Pima S6 (PS6–-26,369 contigs), Pima 3-79 (P3-79), and Pima S7 (PS7–-25,870 contigs) using seqMan Pro 11.2.
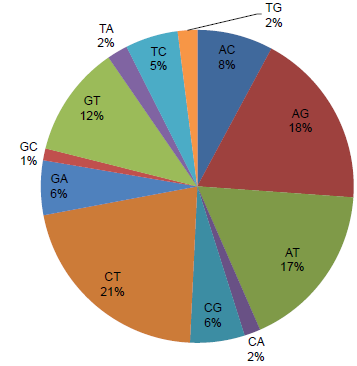
Nucleotide substitution percentage from 10,447 contigs of different comparisons with SNPs identified with a high stringent filter of 100% match and minimum of eight reads using Seqman Pro module of Lasergene software 11.2.
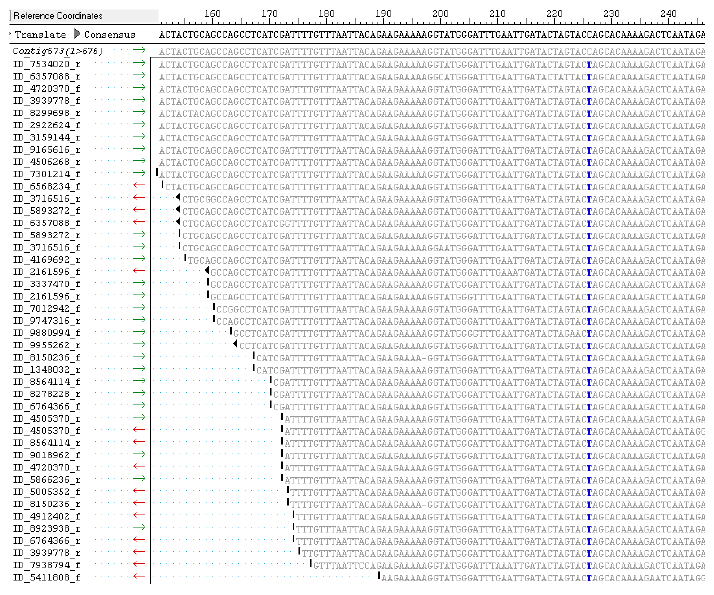
Alignment view of the reads of Pima 3-79 (P3-79) against the Contig 573 (675 bp) of Pima S6 (PS6). C ⇔ T substitution, detected with parameters of 100% SNP identity and depth of the reads greater than 25 reads at 226 bp region (C: black color and T: blue color). SNPs were detected between genotypes PS6 transcriptome (26,369 contigs–-reference set) and P3-79 (9.94 million reads call SNP reads) using SeqMan Pro module of Lasergene software 11.2.
To identify similar contig-sequences among the different identified SNP transcriptome sets from the pairwise genotype comparisons with 100% SNP frequency and minimum depth of four sequence reads [PS6 vs. P3-79 (5,796 contigs), PS6 vs. PS7 (5,796 contigs), and PS7 vs. P3-79 (5,746 contigs)], we used the CAP3 program and in-house python script (Table 2). The same PS6 contigs were identified harboring the SNPs when reads of the P3-79 or PS7 were used in pairwise genotype comparisons. From a total of 11,542 contigs of the SNP Pima transcriptome from the three different genotypes, 1,110 contig-sequences containing SNPs were in common in all the genotypes, and 4,620 sequences were only present in PS6 and 4,580 contig-sequences were specific to PS7.
SNP validation was performed in a selected number of annotated transcripts containing SNPs between the three genotypes. Only simple SNPs that included only the substitution of one of the four nucleotides (A, T, C, and G) were selected from these transcript sequences. In general, success rate of amplification using an identified putative SNP with pairwise genotype comparisons with 100% SNP frequency and minimum of four sequence reads ranged from 40% to 85%. Because of the presence of homeologous loci in allotetraploids, the process of detection/identification of SNPs is more complex. HRM analysis identified SNPs between the three genotypes (Fig. 4). In Supplementary Table 3, information of 13 validated SNPs is presented. Contigs harboring these SNPs belonged to functional processes like photosynthesis and plant stress-related processes. Additional SNPs are being validated from this study for future genetic and quantitative trait loci (QTL) mapping studies.
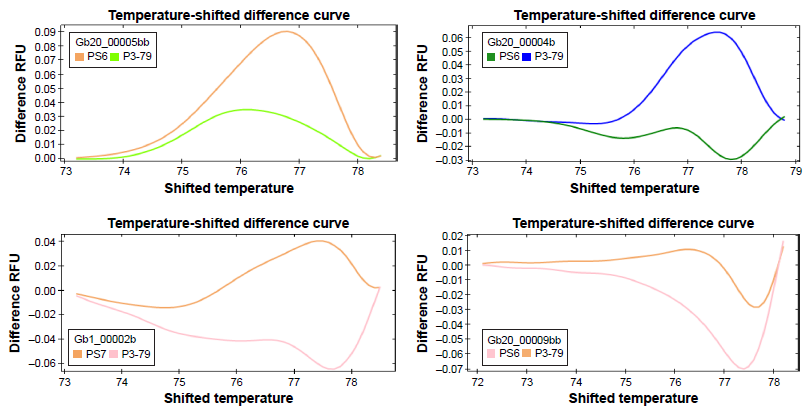
Normalized melting peaks identified in SNPs between the three genotypes PS6, PS7, and P3-79 using HRM analysis. Each color represents an SNP genotype.
Mapping of the tetraploid Pima reads to tetraploid Upland TM-1, diploid A and D transcriptomes
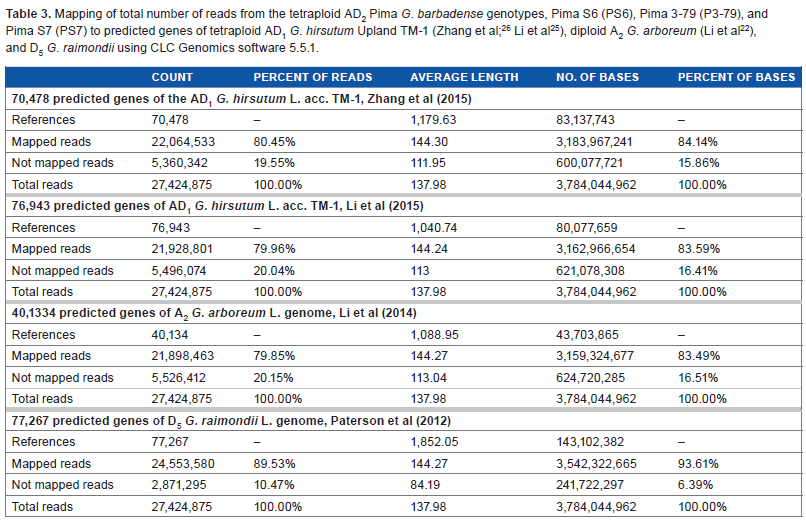
To identify similarities between the transcriptomes of Pima, the Upland, and diploid cottons, a total of 27,424,875 reads (reads from PS6, PS7, and P3-79) were mapped or aligned to 70,478 (with an average length of 1,179 bp per gene) and 76,943 predicted genes of the AD1 Upland acc.25,26 TM-1. Around 80% of the Pima reads mapped to the predicted Upland genes and 5,360,342 reads or 20% did not map (Table 3). When the Pima reads were mapped to the ancestral A2 G. arboreum 40,134 (with an average length of 2,533 bp per gene) predicted genes, around 80% of the reads also mapped to the predicted genes. 22 However, when the Pima reads were mapped to the ancestral D5 G. raimondii 77,267 (with an average length of 1,850 bp), around 90% of the reads mapped to the predicted genes (Table 3). 24 These predicted genes are distributed along the chromosomes of their respective genomes.
Mapping of total number of reads from the tetraploid AD2 Pima G. barbadense genotypes, Pima S6 (PS6), Pima 3-79 (P3-79), and Pima S7 (PS7) to predicted genes of tetraploid AD1 G. hirsutum Upland TM-1 (Zhang et al; 26 Li et al 25 ), diploid A2 G. arboreum (Li et al 22 ), and D5 G. raimondii using CLC Genomics software 5.5.1.
Discussion
In the last four years, first cotton diploid genomes representing A genome (G. arboreum–-A2)and D genome (G. raimondii–-D5
In this study, transcriptome sequences of 25-day-old leaves from the three Pima (G. barbadense; PS6, PS7, and P3-79) genotypes generated a total of 3.9 Gb of cDNA sequence with an average length of 138 bp. Our transcriptome coverage is considerably higher than that reported by Rai et al, 18 while sequencing six G. hirsutum species using 454 sequencing technology. The de novo transcriptome assembly resulted in average contig lengths between 1,035 and 1,079 bp, which was also higher than that of the transcriptome assembly reported by Rai et al 18 and Ashrafi et al 28 in Upland cottons. The Pima leaf reference transcriptome of 42,695 contigs from leaves grown under optimum conditions is made available as a baseline resource for future studies. Typically, a transcriptome represents a small percentage of the genetic code that is transcribed and estimated to be less than 5% of the genome in humans. 33 G. barbadense is the product of a presumed single polyploidization event between the A and D diploid genomes that occurred around 1–2 million years ago. 34 The 26 (1–13 from At subgenome and 14–26 from Dt subgenome) disomic pairing gametic chromosomes in this cotton allotetraploid species is the largest among all major crop plants.35,36 In our study, we report three de novo transcriptome sets from the three genotypes and the reference Pima transcriptome provided moderate coverage to identify SNPs within the complex tetraploid cotton as compared with other research studies.37–40
In the detection of polymorphic SNPs among genotypes following the SeqMan Pro alignment of contigs (de novo transcriptome) vs. reads (base calls from each genotype), we examined a parameter as low as 25% SNP frequency of a base call to capture most of the putative SNPs between two genotypes. This strategy allowed us to subject our putative SNP data set to different filters and cutoffs to call/identify a strong SNP between genotypes. Low rates of nucleotide variation have been reported within the G. barbadense species. 41 Because of the presence of homeologous loci in allotetraploids, the process of detection/identification of SNPs is more complex. 42 Allelic polymorphism between two genotypes (eg, PS6 and P3-79) was proposed at 100% SNP frequency with four reads. Simple SNPs that included only the substitution of the four nucleotides (A, T, C, and G) were around 6,938 comprised in 6,329 contig-sequences, indicating around 1.1 SNP per contig. In addition, the number of indels vs. nucleotide substitutions were 837 comprised in 773 contigs. Similar SNP results were observed when we used the contigs of the Pima leaf reference vs. reads of each genotype. However, the indel substitution increased in these comparisons. We also observed within- or inter-homeologue polymorphisms, which have been suggested not to be an allelic variation. Sometimes, this type of polymorphism can be generated by sequence alignment, creating an ambiguity code in each genotype. 42 This ambiguity is recorded on the reference transcriptome (eg, R = A or G). In the SeqMan Pro alignment, there are 11 possible combinations of inter-homeologue polymorphisms that generated 2,745 putative SNPs in PS6 vs. P3-79 comparison (Supplementary Table 2). We can also assume that some of these putative SNPs represent heterozygote loci. As we impose increments in the initial requirement of minimum (4) reads, the number of identified SNPs decreased. We identified more than 3,000 candidate SNPs for each pairwise comparison between Pima genotypes when we refined and increased the number of aligned reads to the reference contig. These candidate SNPs can be used in genotyping by sequencing studies and in validation experiments by PCR amplification of genomic DNA (with Mendelian genetic-segregation).
In our study, when we analyzed the ratio of base changes based on transitions (changes from A <–> G and C <–> T) and transversions (changes from A <–> C, A <–> T, G <–> C, or G <–> T), a relative increase in the proportion of transitions over transversions was observed (Supplementary Table 2). The transition having two-ring purines (A/G) or one-ring pyrimidines (C/T) is generally expected to be more frequent than transversion. In maize and cotton studies,5,43 similar results have been reported, and the index of intergenomic SNPs is around 1.92. In cotton, this ratio between transition and transversion has been reported to be 1.9:1 between A and D genome ESTs (Page et al 5 ). Based on percentage nucleotide substitution of 10,447 contigs with 100% filter match and minimum of eight reads, the ratio was observed to be 2.0. This ratio in humans is observed to be around 2.1, and some groups have used it as a confirmation for the filtering in an SNP discovery project. The ratio of our study provides additional support for the potential of these putative SNPs to be used in different genotyping studies.
SNP markers are used to locate genes on the genome and determine the role of these genes in complex traits.35,44 In cotton and other polyploid crops with the accessibility of NGS platforms and the decreased cost of sequencing, the number of studies reporting SNP markers has considerably increased over the last eight years.1,2,5,17–21,37–39,42 The larger collection of SNPs (up to 90,000) was assembled from gene transcripts and genomic DNA of multiple cultivars, genotypes, and species (cotton–-SNP Chip, Illumina BeadArray™ and public institutions). Recently, a CottonSNP63K Illumina Infinium array was validated with 1,156 samples, providing more than 7,000 Upland intraspecific and 19,000 interspecific SNP markers. 45 However, informative SNPs within Pima or Pima intraspecific progeny were found to be limited to no more than 1,500 SNP markers (personal communication: Stelly D, Hulse-Kemp A, and Ulloa M). This necessitates identification of more SNP markers for genetic, QTL, and association mapping within Pima tetraploid species more importantly in the genotypes that are used in our breeding programs. In this study, we selected Pima genotypes that have been used as parents in genetic/breeding projects because of their diverse genetic backgrounds and traits for cotton improvement.
The genetic complexity of the cotton crop equals to other polyploidy crops and as complex as Brassica.23,24 The sequence information of the diploid A2 and D5 genomes as well as the recently tetraploid Upland TM-1 AD2 genome has provided us with insights of structural rearrangements such as conserved gene order, gene duplication, gene lost, disrupted genes, and repeat elements.22–26 Based on mapped reads from the three Pima genotypes to the annotated predicted genes of the above genomes, gene conservation was found to be around 80% between tetraploid Pima and tetraploid Upland cotton. Similar percentage was observed with the A2 diploid ancestral parent and tetraploid Pima comparisons. However, gene conservation was almost 10% high between the D5 diploid ancestral parent and tetraploid Pima (89.5%). Genome sequence information revealed that the structural gene rearrangements were more common in the A genome or At subgenome than in the D or Dt subgenome, 26 while transposable elements originating from the Dt seemed to be more active than the At subgenome. 25 In addition, genomic signatures were found for fiber improvement in the At and for stress tolerance in the Dt subgenome, suggesting asymmetric evolution.
It has been noticed that technical differences such as sequencing chemistries, sequencing bias, differences in library construction, and assembly characteristics can underlie unexpected results. It is possible that some of the A2 G. arboreum orthologs are missing because of gene loss or gene silencing. There is no evidence that G. arboreum has lost a large proportion of its transcriptome or experienced a massive global shift in gene expression. 38 Based on the high frequency of mapped reads from the three Pima genotypes to the annotated genes of the diploid ancestral parent D5 G. raimondii, the tetraploid Pima G. barbadense retained more gene structure from this common ancestor, and G. hirsutum and G. barbadense diverged following speciation.
We report a Pima (G. barbadense) leaf reference transcriptome assembly consisting of 42,695 contigs based on leaves grown under optimum conditions, which will be utilized as a baseline resource for use in our comparative studies with other Pima genotypes. Further, this will help us to advance basic and applied genomic research in this complex tetraploid species. Ongoing research will also extend the utilization of the de novo and reference leaf transcriptomes to explore candidate SNPs in plant stress conditions, such as drought and disease resistance through gene expression profiling and genetic/QTL mapping. Furthermore, sequenced reads from these Pima genotypes will be further aligned to the assembled diploids and tetraploid cotton genomes to investigate chromosomal gene rearrangements and to further elucidate SNP divergence and the evolutionary history of the Pima transcriptome set. In addition, we developed a genetic resource of SNP markers for Pima species that can be utilized for characterizing genetic diversity, genotyping, and eventually in breeding through marker-assisted selection.
Author Contributions
Responsible for the conception and design of the experiment: PK, MU, and KRK. Prepared libraries and performed all sequencing: PK. Performed data analysis: PK, MU, and KRK. Interpreted the results and prepared the manuscript: PK, KRK, and MU. Carried out the tissue collection and performed RNA extractions: PK and PP. Assisted in final revisions of the manuscript: PP and JB. All authors reviewed and approved the final manuscript.
Supplementary Materials
Footnotes
Acknowledgments
The authors would like to thank Marie Syapin and William Grue for technical help. Mention of trade names or commercial products in this manuscript is solely for the purpose of providing specific information and does not imply recommendation or endorsement by the USDA. The U.S. Department of Agriculture and Texas Tech University are equal opportunity providers and employers.