
Abstract
Animal domestication gives rise to gradual changes at the genomic level through selection in populations. Selective sweeps have been traced in the genomes of many animal species, including humans, cattle, and dogs. However, little is known regarding positional candidate genes and genomic regions that exhibit signatures of selection in domestic horses. In addition, an understanding of the genetic processes underlying horse domestication, especially the origin of Chinese native populations, is still lacking. In our study, we generated whole genome sequences from 4 Chinese native horses and combined them with 48 publicly available full genome sequences, from which 15 341 213 high-quality unique single-nucleotide polymorphism variants were identified. Kazakh and Lichuan horses are 2 typical Asian native breeds that were formed in Kazakh or Northwest China and South China, respectively. We detected 1390 loss-of-function (LoF) variants in protein-coding genes, and gene ontology (GO) enrichment analysis revealed that some LoF-affected genes were overrepresented in GO terms related to the immune response. Bayesian clustering, distance analysis, and principal component analysis demonstrated that the population structure of these breeds largely reflected weak geographic patterns. Kazakh and Lichuan horses were assigned to the same lineage with other Asian native breeds, in agreement with previous studies on the genetic origin of Chinese domestic horses. We applied the composite likelihood ratio method to scan for genomic regions showing signals of recent selection in the horse genome. A total of 1052 genomic windows of 10 kB, corresponding to 933 distinct core regions, significantly exceeded neutral simulations. The GO enrichment analysis revealed that the genes under selective sweeps were overrepresented with GO terms, including “negative regulation of canonical Wnt signaling pathway,” “muscle contraction,” and “axon guidance.” Frequent exercise training in domestic horses may have resulted in changes in the expression of genes related to metabolism, muscle structure, and the nervous system.
Introduction
The genetic diversity of domesticated animals changes gradually through selective processes in populations. Archaeological and genetic evidence suggested that the initial domestication of horses (Equus caballus) began 5000 to 6000 years ago and possible multiple horse domestication events occurred across Eurasia.1,2 For the past 400 years, the establishment of formal breed registries and continuous breed specialization has focused on the preservation and improvement of traits related to riding, draft, aesthetics, and performance. The intensive selection for these traits has led to high athletic quality and high skeletal muscle mass. 3 Chinese native horses were formed under different ecological conditions and exhibit high levels of morphological and genetic diversity.4,5 Kazakh horses are believed to have been developed by crossing native horses with Mongolian, Middle Asian, and European breeds raised together in herds. 6 They are generally small, rugged horses with different coat colors. The Kazakh horse is used for riding and pack as well as for milk and meat. The Lichuan breed is geographically distributed in mountainous areas of Southern China and is broadly used in light draft and riding for human usage. In this study, we selected only Kazakh horses and Lichuan breeds, with distinct variations in numerous phenotypes, to test whether they represent potential Northern type and Southern type of Chinese horse, respectively. Previous studies demonstrated that Northern/Southern Chinese distinct groups can be used to discriminate the Han Chinese 7 as well the domestic pig genetically. 8
Recent advancements in high-throughput sequencing technology and the assembly of the first horse genome sequence have allowed for in-depth analysis of the genetic variations present in horses. 9 Phenotypic changes associated with mutations accompany domestication as a result of the joint impact of natural selection and human-controlled selective breeding. Due to a strong selection of beneficial alleles, a selective sweep leads to a single genomic background, which results in a large reduction in genetic variations in local region of the genome. 10 Selective sweeps have been found in domestic and wild horse populations using genome scans.11–13 Selective sweeps have been found in 33 domestic horse breeds using genome scans of nearly 50 000 markers in Equine SNP50 BeadChip (Illumina, San Diego, CA, USA). 13 However, the limited markers cannot give single base resolution of the entire genome. In this study, we describe the whole genome sequencing of 4 horses from 2 Chinese native breed and 44 horses with publicly available genome data from completely different breeds to find and annotate distinct genetic disparities in horses using extremely precise SNP calling approaches. The aim of this study was to highlight candidate genes and to trace footprints of horse selection at the genome level. Genes were selected in proximity to genomic regions and positions displaying signatures of selection by the composite likelihood ratio (CLR) method using sequencing data. 14 Moreover, the functions of genes under selection were studied by gene ontology (GO) annotation analysis.
Materials and Methods
Experimental animals and genome sequencing
We sequenced 4 Chinese native horses including one individual from the Lichuan breed and 3 from the Kazakh breed. Genomic DNA was extracted from blood tissue using a standard phenol-chloroform protocol. This study was conducted according to the regulations approved by the ethical committee of Huazhong Agricultural University and also the standing committee of Hubei People’s Congress, P. R. China.
High-quality DNA for genome sequencing was processed to construct short-insert DNA libraries according to the manufacturer’s specifications (Illumina). The qualified libraries with appropriate insert size (500 bp [base pairs]) and concentration (>2 nM) were sequenced using the Illumina HiSeq X Ten platform with 150-bp paired-end reads (Illumina). Overall, we produced approximately 400.97 million raw reads (totaling 117 Gb of raw data) from the 4 samples (Table 1). These raw read data were deposited into the NCBI SRA Database with Bioproject accession numbers PRJNA401382/SRP117064. The genome sequence data of 44 other horse samples were retrieved from the NCBI SRA database11,12,15,16 (Table 1). Low-quality reads were trimmed using Trimmomatic Version 0.36 with the following options: ILLUMINACLIP:TruSeq3-SE:2:30:10, LEADING:3, TRAILING:3, SLIDINGWINDOW:4:15, and MINLEN:75. 17
Sampling and data source information for horses in the study.

SNP calling
Horse gene sequences were retrieved from the NCBI database. Next-generation sequencing reads from the 48 samples were mapped individually to the reference genome using bwa-mem 18 with default parameters. BAM files for all animals were sorted, and duplicates were filtered using Picard-version-1.108 (http://broadinstitute.github.io/picard/). RealignerTargetCreator and IndelRealigner were applied for local realignment, and individual sample SNP calling was performed using HaplotypeCaller (with the following parameters: -pairHMM VECTOR_LOGLESS_CACHING –emitRefConfidence GVCF –variant_index_type LINEAR –variant_index_parameter 128000) in GATK version 3.50. 19 Multisample SNP calling was performed to merge the GVCFs using GenotypeGVCFs with default settings from GATK version 3.50. 19 The identified SNPs in the VCF were filtered for downstream analysis by requiring a minimum depth of 5 and a minimum root mean square mapping quality score of 20. We also removed SNPs with a minor allele frequency <0.05 and with >10% missing genotypes among the 48 samples in the population.
The 15 341 213 high-quality SNPs identified in the horse were categorized according to their genomic locations, including in exons, introns, untranslated regions (UTRs), and intergenic regions, and SNPs located in exons were further divided into synonymous and nonsynonymous SNPs. The high-quality SNPs recovered here were used in the GO, SNP summary, target gene, and selective sweep analyses. The putative SNPs were functionally annotated primarily based on the SnpEff software system analysis 20 with standard settings. For each SNP, the position (5′ UTR, 3′ UTR, exonic, intronic, intergenic, splice acceptor or donor site, upstream or downstream) and also the useful annotation (nonsynonymous, synonymous) were identified based on the gene annotation of the horse reference genome from the NCBI database (EquCab2.0, annotation date November 20, 2015). 9
Population genetics analysis
We also conducted an individual-scale principal component analysis (PCA) for the 48 horses. Here, genotype likelihoods were estimated assuming Hardy-Weinberg equilibrium using the ANGSD package (with parameters: angsd -nInd 48 -doMajorMinor 1 -doMaf 1 -doPost 1 -doGeno 32 -doSaf 1). 21 Genotype likelihoods were used to compare horses via PCA using the function “ngsCovar” in ngsTools, 22 which implements a probabilistic approach to estimate the genotype covariance matrix (with parameters -nind 48 -nsites 12363534 -block_size 20000 -call 0 -minmaf 0.05).
The population structure among various domestic populations was inferred using admixture. 23 We removed the Przewalski horses because they are the only wild population. After excluding the 3 Przewalski horses, we choose 422 881 high-quality autosomal SNPs randomly to infer the genetic structure of the domestic horses, using the program admixture, which includes a cross-validation procedure that allows identifying the value of K for which the model has best predictive accuracy.
Detection of positive selection
The method for detection of positive selection for horse is mainly similar to the previous one that we have used for ducks. 24 To identify sweeps, the CLR test was performed using allele frequencies, and the site frequency spectrum (SFS) of the complete chromosome was considered as the background SFS to calculate the combined likelihood of a recent selective sweep in each window. 14 The empirical CLR distributions were obtained by 1000 simulations of a neutral sequence equal to each chromosome in length using ms software 25 under a previously selected demographic model named “PSMC #1,” which represents the basic model with a constant population size from t2 to t0. 11 In this PSMC profile, a mutation rate of 7.242 × 10⁻⁹ per site per generation and a generation time of 8 years were used. 16 The CLR value and the corresponding A value in each alignment positions where the SweeD score is calculated for the horse and simulated genotypes were obtained from a SweeD run with a grid size of 10 kB. The corresponding α value of a CLR value is a function of the selection coefficient, the recombination rate, and the effective population size. The results from the simulated genotypes were used to calculate a critical threshold of CLR values for observed data in each chromosome. We identified candidate sites for selective sweep on the basis of P values after correction of multiple testing using a false discovery rate (FDR) of 0.05 (using “BH” method in the “p.adjust” function of R). We then identified annotated sequences overlapping with the selected regions as determined by SweeD.
Functional enrichment
Functional enrichment was performed on the list of loss-of-function (LoF) genes and the genes under selection in horses as detected by the genome-wide selective sweep scans, respectively. The GO terms were obtained using the Databank for Annotation, Visualization and Integrated Discovery (DAVID). 26 DAVID was used to evaluate enrichment in the GO terms using known annotations of horse genes with Equus caballus selected as background. For further GO term analysis, a P value of .05 and a FDR of 25% were set.
Results and Discussion
Genomic variants
Overall, 15 341 213 high-quality SNPs were detected using GATK, representing the distinctive variants of 48 samples. The SNPs were functionally classified using SnpEff annotations with the boundaries of all neighboring genes (Table 2). Most SNPs were located in intergenic regions, and intronic SNPs were most common in genic regions. SnpEff also found 172 656 SNPs in the 3′ UTRs and 46 446 SNPs in 5′ UTRs. The SNPs in the upstream/5′ UTRs and downstream/3′ UTRs might affect transcription and translation, respectively, but actual functional effects must be confirmed case by case. With respect to SNPs found in splice regions, 384 were found in splice acceptor sites and 577 were found in splice donor sites. A total of 247 513 SNPs were found to have an effect on coding regions: 1054 SNPs may cause a premature stop codon, 224 may abrogate a termination codon, and 103 427 (0.28%) may cause nonsynonymous substitutions. The remaining SNPs within the coding regions were expected to be either synonymous (129 097) or in noncoding exons (96 876). As a measure of the quality of our SNP data, we recovered a transition-transversion (ts/tv) ratio of 2.05 across the horse genome, which closely mirrors the global ts/tv ratio of 2.0-2.1 for the human genome. 27
Summary of single-nucleotide polymorphisms in horses.

To gain insights into the SNPs underlying recessive traits, we clustered 5 high-impact severity types of SNPs into LoF variants, including splice acceptor, splice donor, stop gain, stop loss, and start loss SNPs in protein-coding genes. We detected 1390 LoF SNPs in protein-coding genes, all of which were heterozygous in at least one of the sampled animals. There were 981 genes with more than 1 LoF SNP. The GO enrichment analysis revealed that genes associated with “G protein–coupled receptor (GPCR) communication pathway,” “antigen processing and presentation of peptide or polysaccharide antigen via major histocompatibility complex (MHC) class II,” “detection of chemical stimulus involved in sensory perception,” “immune response,” and “signal transduction” were overrepresented in LoF-affected genes (Table 3). G protein–coupled receptors have been found to be linked with signaling pathways such as transmembrane receptor activity and neurotransmission. 28 Two similar GO enrichment results for LoF-containing genes pointing to GPCR receptor activity and sensory perception were also found in humans 29 and cattle. 30 Interestingly, genes associated with GO terms “antigen processing and presentation of peptide or polysaccharide substance via MHC class II,” “immune response,” “defense response,” and “cellular response to interferon-gamma” were significantly (P < .05) overrepresented in the LoF-affected gene set (Table 3). These GO terms are involved in immune responses. DRB, DQA, and DQB are classical MHC class II molecules involved in the development of adaptive immune responses.
Enriched biological processes from GO analysis of the loss-of-function genes.
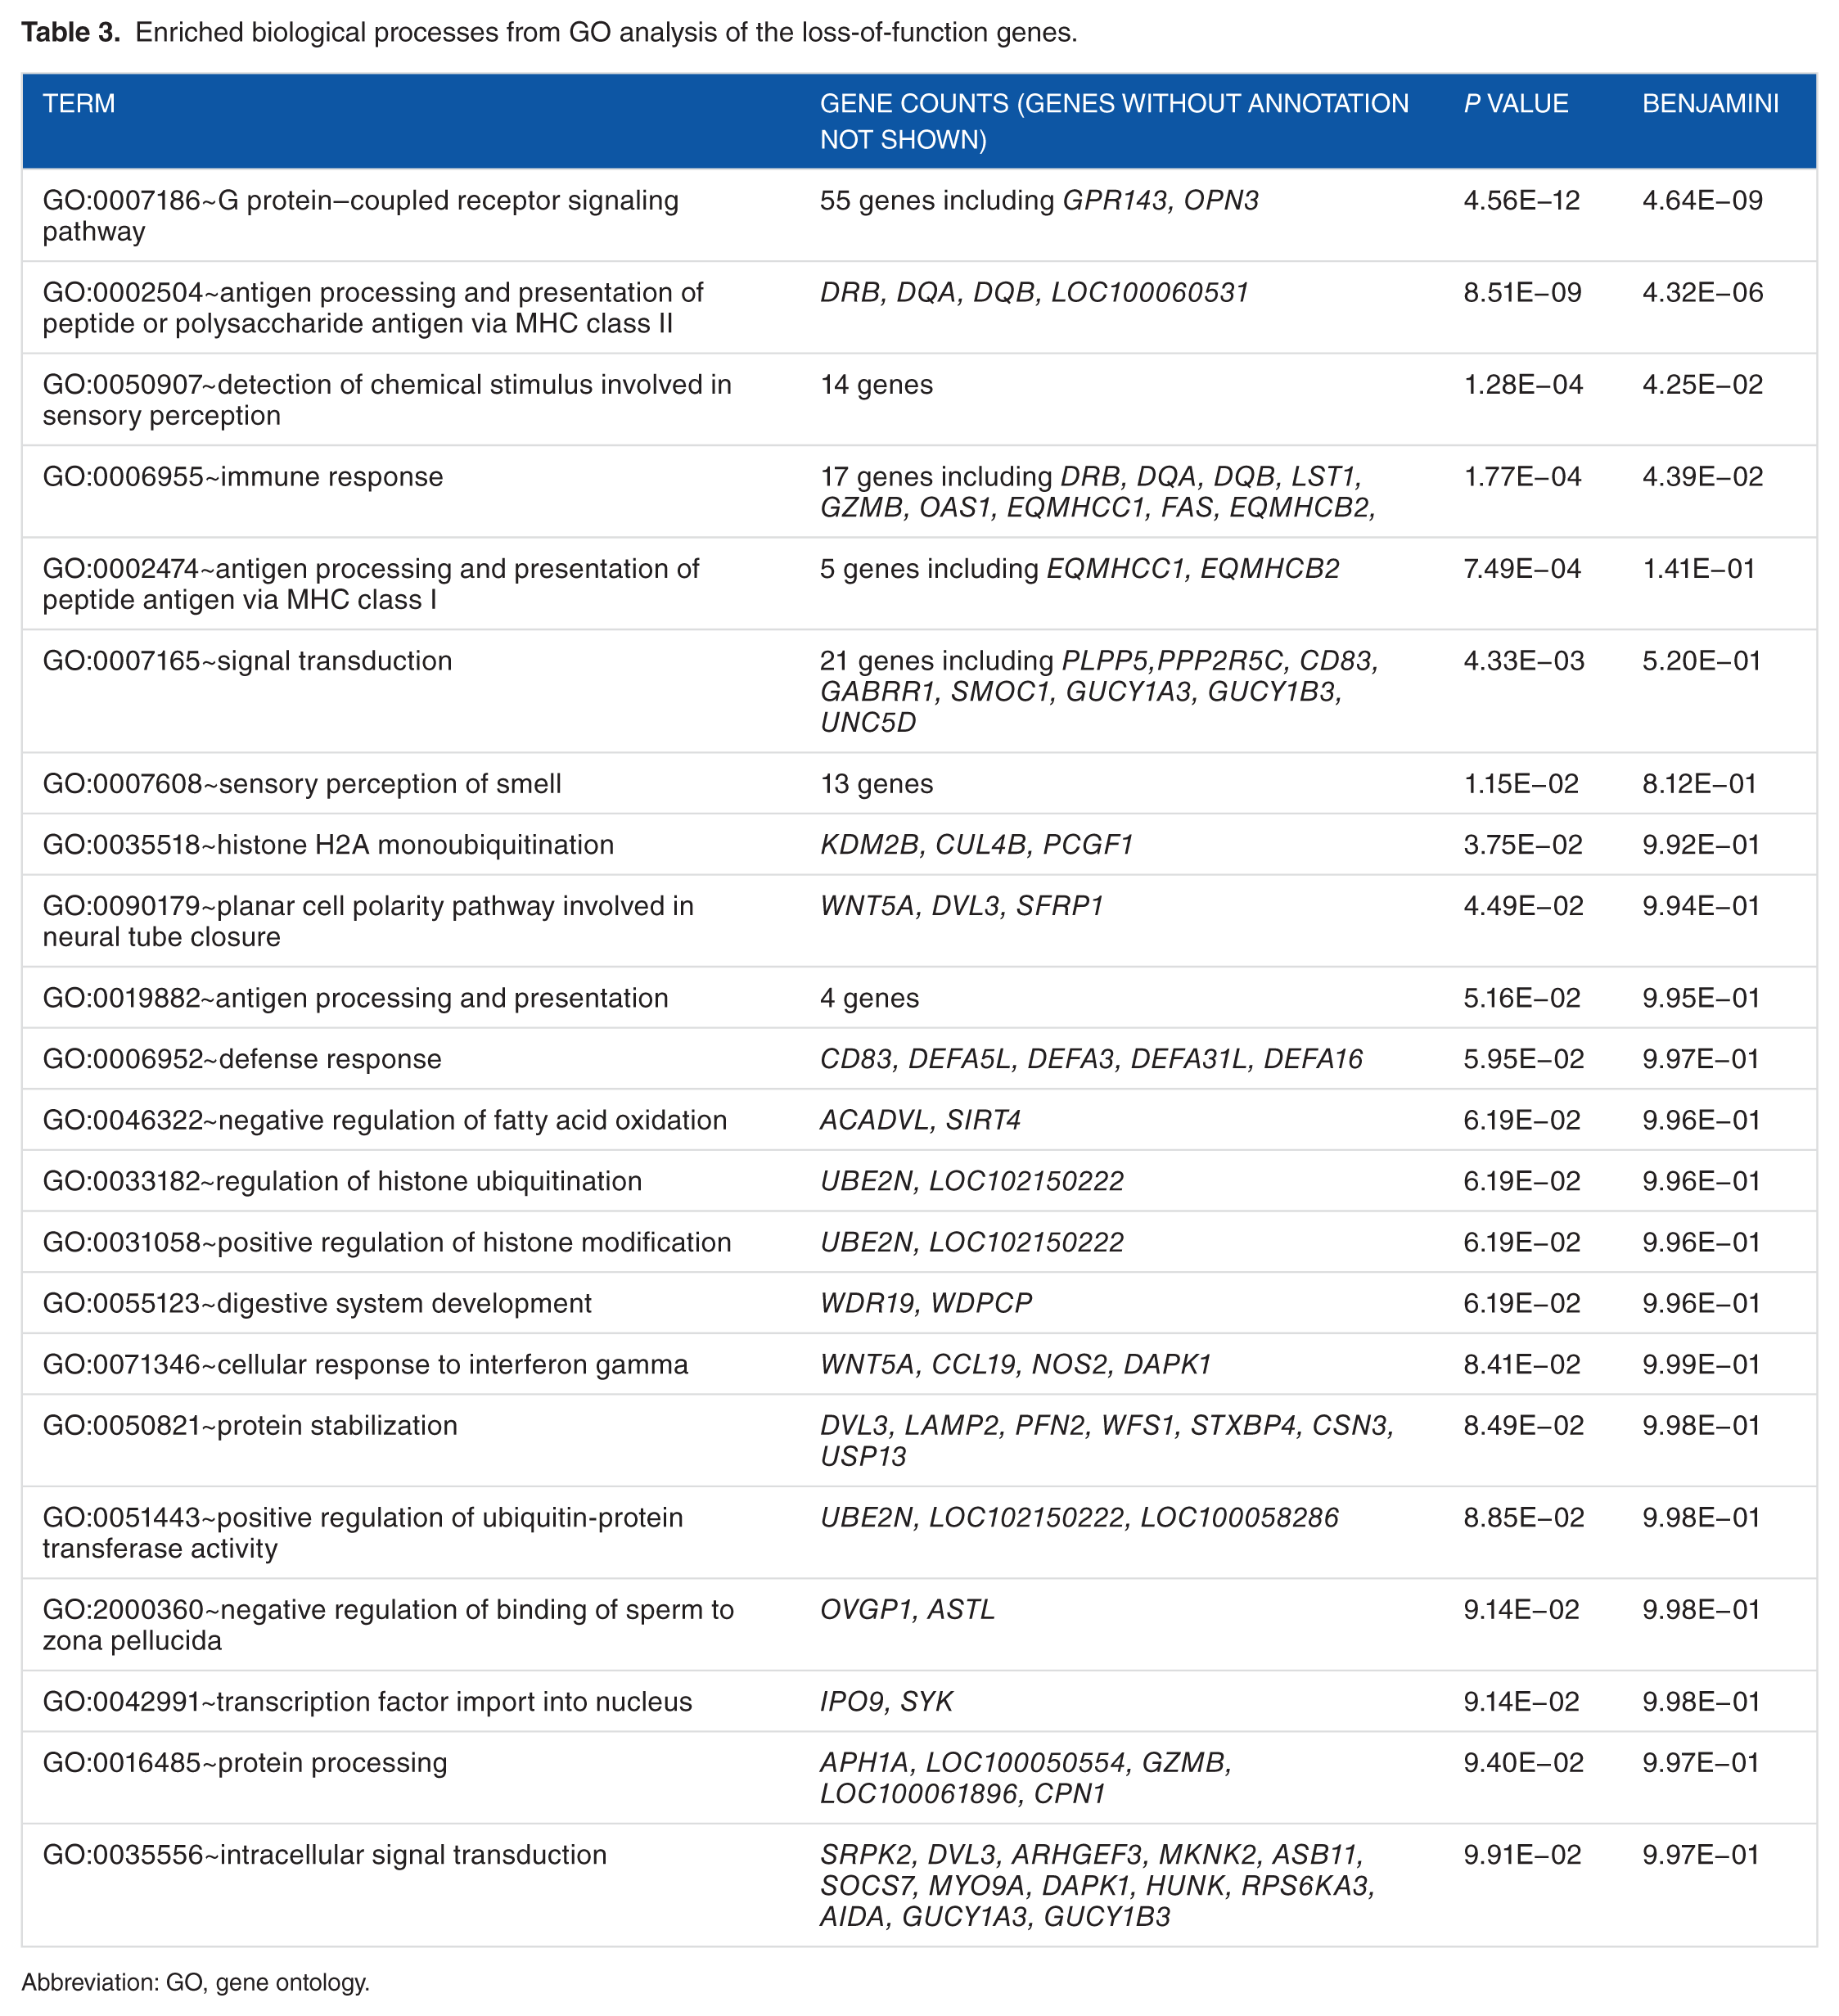
Abbreviation: GO, gene ontology.
Population genetic structure
Principal component analysis was used to explore the individual relationships within and among breeds. The first 2 principal components explained 8.53% of the variation of the studied horses (Figure 1). The position of Przewalski clearly deviates from the domestic horse in PC1. PC1 also allows visualizing the proximity among Duelmener, Fjord, Icelandic, Kazakh, Lichuan, and Mongolian (where we defined group A) and the proximity among Hanoverian, Morgan, Quarter, Sorraia, and Standardbred (where we defined group B).

Principal component analysis results of all 48 horses. The x-axis denotes the value of PC1, whereas the y-axis denotes the value of PC2. Each dot in the figure represents one individual.
Admixture proportions were assessed without user-defined population information to infer the presence of distinct populations among the samples (Figure 2). At K = 3 or K = 4, Franches-Montagnes and Arabian forms one unique cluster; at K = 5, Jeju pony forms one unique cluster. For other breeds, comparatively strong population structure exists among breeds, and they can be assigned to 2 (or 3) alternate clusters from K = 3 to K = 5 including group A (Duelmener, Fjord, Icelandic, Kazakh, Lichuan, and Mongolian) and group B (Hanoverian, Morgan, Quarter, Sorraia, and Standardbred). For group A, geographically this was unexpected, where Nordic breeds (Norwegian Fjord, Icelandic, and Duelmener) clustered with Asian breeds including the Mongolian. Previous results of mitochondrial DNA have revealed links between the Mongolian horse and breeds in Iceland, Scandinavia, Central Europe, and the British Isles. The Mongol horses are believed to have been originally imported from Russia subsequently became the basis for the Norwegian Fjord horse. 31 At K = 6, Sorraia forms one unique cluster. The Sorraia horse has no long history as a domestic breed but is considered to be of a nearly ancestral type in the southern part of the Iberian Peninsula. 32 However, our result did not support Sorraia as an independent ancestral type based on result from K = 2 to K = 5, and the unique cluster in K = 6 may be explained by the small population size and recently inbreeding programs. Genetic admixture of Morgan reveals that these breeds are currently or traditionally continually crossed with other breeds from K = 2 to K = 8. The Morgan horse has been a largely closed breed for 200 years or more but there has been some unreported crossbreeding in recent times. 33
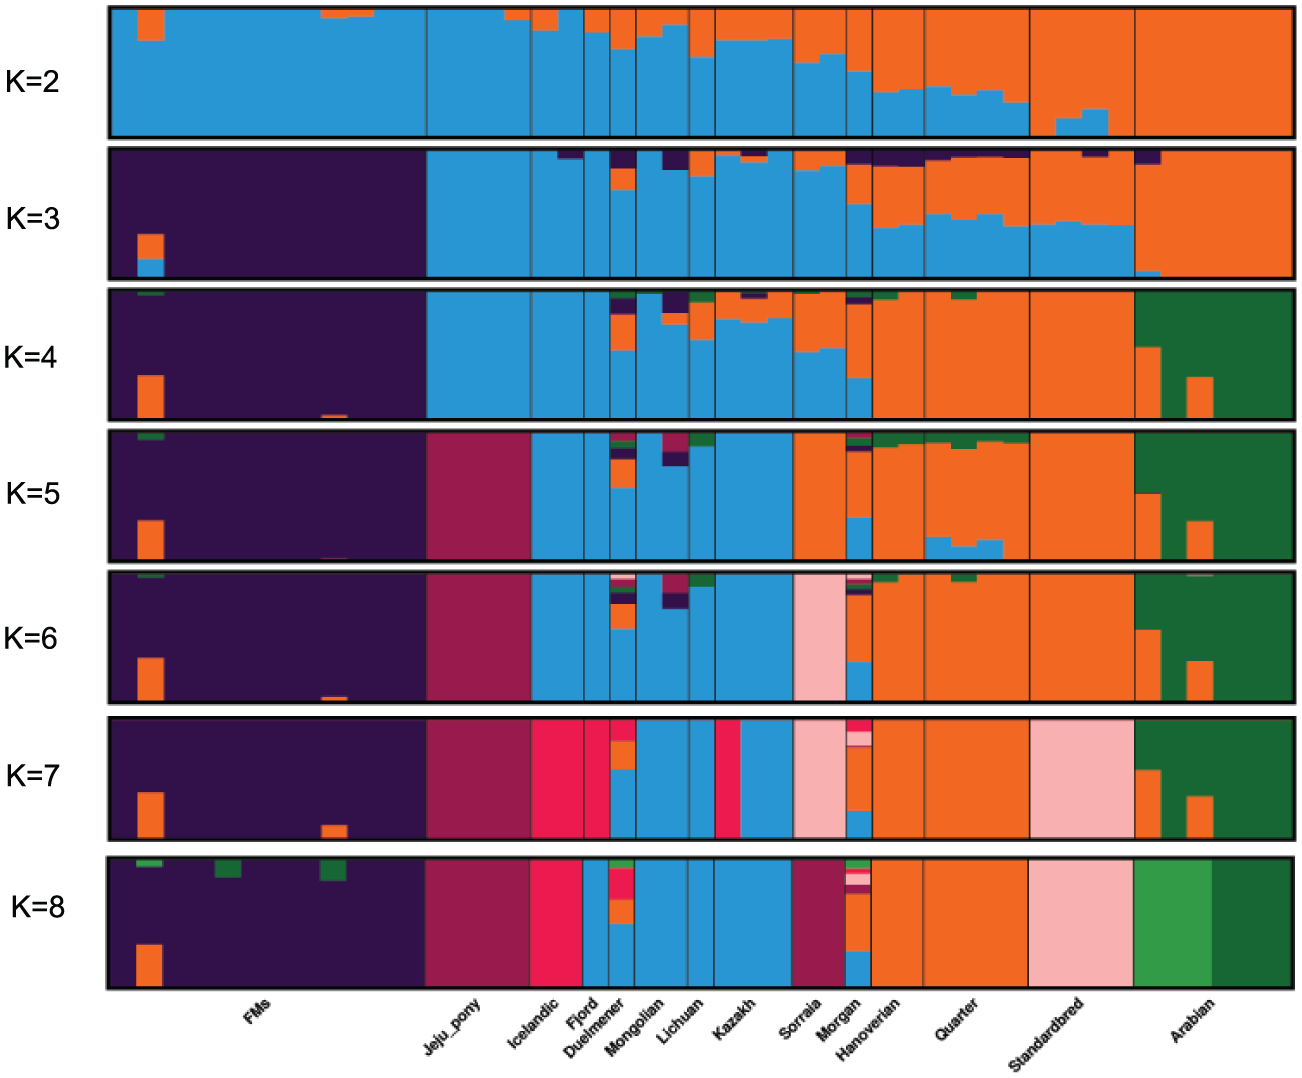
Bayesian clustering output for 5 K values from K = 2 to K = 8 in 45 domestic horses. Each individual is represented by a vertical line, which is partitioned into colored segments that represent the proportion of the inferred K clusters.
Bayesian clustering and PCA demonstrated the relationships among the horse breeds with weak geographic patterns. The tight grouping within most native breeds and looser grouping of individuals in admixed breeds have been reported previously in modern horses using data from a 54K SNP chip.33,34 Cluster analysis reveals that Arabian or Franches-Montagnes forms one unique cluster with relatively low K value, which is consistent with former study using 50K SNP chip.33,34 Interestingly, Standardbred forms a unique cluster with relatively high K value in this study, different from previous study. 33 To date, no footprints are available to describe how the earliest domestic horses spread into China in ancient times. Our study found that Kazakh and Lichuan were assigned to the same lineage as other native Asian breeds, in agreement with previous studies on the origin of Chinese domestic horses.4,5,35,36 The strong genetic relationship between Asian native breeds and European native breeds have made it more difficult to understand the population history of the horse across Eurasia. Low levels of population differentiation observed between breeds might be explained by historical admixture. Unlike the domestic pig in China, 8 we suggest that in China, Northern/Southern distinct groups could not be used to genetically distinct native Chinese horse breeds. We consider that during domestication process of horse, gene flow continued among Chinese-domesticated horses.
Genome-wide selection signatures
The CLR test scanned genomic regions to find signals of positive selection in the horse genome. Composite likelihood ratio is calculated by comparing the regional SFS with the background SFS that specifies the probability of a signal at each window of 10 kB in length across the horse genome. A total of 1052 windows obtained a P value less than .01, indicating that the CLR of those windows surpassed the CLRs achieved from the distribution of 1000 neutral simulations. The SNP and gene density values for these regions are presented in Figure 3. Some of the 1052 windows were adjacent to one another, which led to the designation of 933 distinct core regions. The regions with the largest CLR in the horse genome are located on chromosome 8 (Figure 3), including 9 adjacent 10-KB windows. The top-scoring 90-Kb region was chr8: 1.916 to 2.006, and this region contains 227 SNPs, all of which are intron variants of the LOC100065759 pseudogene.

Circos plot of the global distribution of genes, SNP variants, and signature of selective sweeps along the 31 autosomes. The circles, from outside to inside, illustrate gene density (yellow), SNP density (green), and CLR values (blue). The genes located in regions with significant strong sweep signatures are presented as outliers. High values in each layout (gene density: number per 100 kB; SNP density: number per 200 kB, and CLR value >15) are marked in red. CLR indicates composite likelihood ratio; SNP, single-nucleotide polymorphism.
Genes under selection involved in biological processes
We explored the functions of genes associated with various biological processes. The P value of .05 was considered significant for GO annotation. We recovered 21 enriched GO groups (P < .05; Table 4). The top 3 GO terms with the lowest P values were “negative regulation of canonical Wnt signaling pathway” (GO:0090090, P = 2.93E−03), “muscle contraction” (GO:0006936, P = 1.22E−02) and “axon guidance” (GO:0007411, P = 1.31E−02). The GO term “muscle contraction” was defined as a change in muscle geometry induced by the force generated within muscle tissue. Force generation requires a chemo-mechanical energy conversion process that is mediated by actin/myosin complex activity, which produces force through adenosine triphosphate hydrolysis. Myomesin genes (MYOM1 and MYOM2) are expressed in muscle cells to stabilize the 3-dimensional conformation of the thick filament, and tropomodulin1 (TMOD1) protein binds and restrains the minus end of actin, fine-tuning the length of actin filaments in muscle and nonmuscle cells. 37 A previous study in horses also found that genomic regions with the most genetic differentiation in domesticated horses were enriched in genes involved in metabolism, muscle contraction, reproduction, signaling pathways, and behavior, 11 which supports our result. The GO term “axon guidance” is a neural development subdomain in relation to this process, through which neurons send out axons to achieve the correct targets. In this GO term, the axon guidance receptor gene (ROBO1) is a candidate gene for developmental dyslexia, and ROBO1 polymorphisms are associated with functioning in the language acquisition system.38,39 Abnormal expression of Contactin-4 (CNTN4) has been implicated in some cases of autism. The cadherin gene (CDH4) has a predictive pivotal role during brain segmentation and neuronal outgrowth. Therefore, genes in this GO term may be related to the trait of racing in domestic horses, which is supported by other genes related to exercise-induced stress that were found in selective sweep tests in thoroughbreds. 15 Previous studies have shown that intensive exercise training in thoroughbreds leads to gene expression changes related to metabolism and muscle structure.40,41
Enriched biological processes from GO analysis of the genes in the CLR region.

Abbreviation: GO, gene ontology.
Footnotes
Declaration of conflicting interests:
The author(s) declared no potential conflicts of interest with respect to the research, authorship, and/or publication of this article.
Funding:
The author(s) disclosed receipt of the following financial support for the research, authorship, and/or publication of this article: This work was supported by the National Nature Scientific Foundation of China (nos 31501076 and 31560616), the National Natural Science Foundation of Hubei Province of China (no. 2015CFB244), and the Fundamental Research Funds for the Central Universities (nos 2662017JC027 and 2662015JC010). The authors confirm that the funder had no influence over the study design, content of the article, or selection of this journal.
Author Contributions
SZ and XD conceived of and designed the experiments. CZ, JC, YM, and CX analyzed the data. MG, AB, DG, PN, and XL contributed to sampling. HIA, CZ, YF, and HW contributed to the writing of the manuscript. All the authors reviewed and approved the final manuscript.