
Abstract
Genomic studies have become noncoding RNA (ncRNA) centric after the study of different genomes provided enormous information on ncRNA over the past decades. The function of ncRNA is decided by its secondary structure, and across organisms, the secondary structure is more conserved than the sequence itself. In this study, the optimal secondary structure or the minimum free energy (MFE) structure of ncRNA was found based on the thermodynamic nearest neighbor model. MFE of over 2600 ncRNA sequences was analyzed in view of its signal properties. Mathematical models linking MFE to the signal properties were found for each of the four classes of ncRNA analyzed. MFE values computed with the proposed models were in concordance with those obtained with the standard web servers. A total of 95% of the sequences analyzed had deviation of MFE values within ±15% relative to those obtained from standard web servers.
Keywords
Introduction
One of the most important recent advancements in molecular biology has perhaps been the discovery that the noncoding region of the genome can regulate gene expression. The past two decades have witnessed a steep increase in the study of the noncoding RNA (ncRNA). Systematic screening of various genomes has brought to light a completely new knowledge database of the ncRNA.1–3 Micro RNAs (miRNAs) that regulate gene expression and small interfering RNAs that take part in RNA interference pathways for gene silencing are just two examples.4–7 Functions of ncRNA include transcription, control of translation, translocation, RNA processing and modification, and chromosome replication.8,9
RNA is made up of the four nucleotide bases A (adenine), U (uracil), C (cytosine), and G (guanine). It is a single-stranded molecule (read from the 5′ end to the 3′ end) but can involve in complementary base pairing via hydrogen bonds (A-U, C-G, Watson–Crick/canonical base pairing) in the same strand.1,3 Noncanonical base pairing is also seen (A-G, wobble pair). Complementary base pairing causes the RNA single strand to fold onto itself forming the two-dimensional secondary structure. The optimal secondary structure formation happens in such a way that the thermodynamic free energy is minimum, and the resulting structure is called the minimum free energy (MFE) structure. The secondary structure folds in three-dimensional space to form the tertiary structure. Function of ncRNA depends ultimately on this three-dimensional tertiary structure. 10 The secondary structure is made up of substructural elements that are responsible for most of the overall folding energy and can be seen as a coarse-grained approximation of the tertiary structure. The secondary structure is obviously the first step in understanding the far more complicated three-dimensional tertiary structure and thereby the function of the ncRNA sequence.
Many computational approaches to predict the secondary structure exists today. Broadly, they could be listed as probabilistic, thermodynamic, and phylogenetic predictions and predictions with pseudoknots. Dynamic programming with the thermodynamic nearest neighbor approach is a popular method of MFE secondary structure prediction of RNA. This folding algorithm uses a nearest neighbor energy model. A secondary structure is uniquely decomposed into substructural element; (stacked bases, hairpin loops, bulges, interior loops, and multiway junctions), which are assigned energies. The free energy of the secondary structure is computed as the sum of energy contributions of the individual substructures that make up the secondary structure.
Computational methods are quite popular and rampantly used in molecular biology. However, over the past two decades, the theory and methods of digital signal processing (DSP) too have gained attention in molecular biology. A good amount of DSP methods has been employed to analyze DNA and proteins after the initial work in the turn of this century.11–13 Nevertheless, there has not been much published work on DSP methods to analyze the noncoding region of the genome.
In this work, ncRNA was analyzed with respect to the MFE of its secondary structure. A novel mathematical model for MFE was developed in terms of signal parameters of ncRNA sequences. MFE has not been mathematically linked to length or any other signal parameter of the sequence. This is a novel approach to analyzing MFE and has not been reported in related literature to date.
Materials and Methods
Materials
Over 2600 ncRNA sequences downloaded from benchmarked databases, viz., GenBank and Rfam, were used in this work. The classes of ncRNA whose MFEs were analyzed are snRNA (902), snoRNA (573), miRNA (376), and ribosomal RNA (rRNA; 805), taken from across bacteria, archaea, fungi, and eukaryotes.
Methods
The optimal two-dimensional MFE structures of a sample of over 2600 ncRNA sequences were found with the thermodynamic nearest neighbor algorithm using MATLAB R2016a. A novel mathematical model for MFE was developed in terms of signal parameters of ncRNA sequences using multiple linear regression analysis. This model was used to compute MFE of ncRNA sequences. MFE values so obtained were compared and ratified with those obtained using standard web servers, RNAfold, and RNAstructure.
Secondary structure prediction and evaluation of MFE
The basic dynamic programming algorithm for the thermodynamic nearest neighbor model was proposed by Zuker and Steigler. 14 Optimal MFE secondary structure was predicted for the sequences analyzed starting from the primary sequence.15,16 In this computation, canonical and noncanonical base pairings are considered, the energy contribution of coaxially stacked helices is not accounted for, and the formation of pseudoknots is forbidden. The RNA structure can be uniquely decomposed into substructural elements (stacked bases, hairpin loops, bulges, interior loops, and multiway junctions) and energies are assigned to these substructures. An up-to-date set of energy parameters is maintained by the Turner's Laboratories.15,17 MFE is estimated in kilocalorie per mole by summing individual energy contributions from the secondary substructures, viz., base pair stacks, hairpins, bulges, internal loops, and multibranch loops. Figure 1 shows an illustration for the contributing energies of the different substructures and the net energy AG expressed in kilocalorie per mole. The secondary substructures have energy contributions that are sequence and length dependent. The algorithm implemented uses dynamic programming to compute the energy contributions of all possible elementary substructures and then predicts the secondary structure by considering the combination of elementary substructures whose total free energy is minimum.
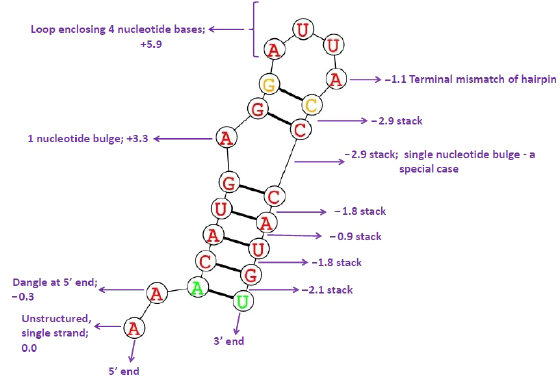
The contributing energies of substructures. Here, overall ΔG = –4.6 kcal/mol.
Novel model for MFE
The signal properties considered here for developing the mathematical model are (1) the length of the ncRNA sequences in terms of the number of nucleotides (mentioned as NTL) and (2) standard deviation of the spectral coefficient matrix of the sequences (mentioned as SD_DFT).
Signal length and coefficient matrix of the signal spectrum
In order to make it conducive for DSP, the sequences of letters from the four-character alphabet were first converted into numerical sequences. The binary indicator sequence representation was used here. 12 ua[n], uu[n], uc[n], and ug[n] are the binary indicator sequences corresponding to A, U, C, and G, which take on a value of 0 or 1 at location n, depending on whether or not the corresponding character exists at n.
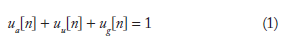
N is the sequence length, NTL.
The numerical sequence resulting from a character string of length N can be written as:
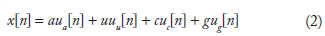
n = 0, 1, 2, 3…… (N – 1) and α = 1 + j, u = 1 – j, c = –1 – j, g = –1 + j, following the convention of complex representation of bases 13 where purines and pyrimidines are represented by numbers that are complex conjugates.
To obtain the spectral coefficients, the digital Fourier transform (DFT) of the sequence was found using the fast Fourier transform algorithm. DFT of a sequence x[n], of length N, is itself another sequence X[k], of the same length N.18,19 Can be expressed mathematically as
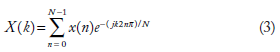
Magnitudes of spectral coefficients were separated from the spectrum and their standard deviation computed. This is SD_DFT.
Regression analysis–-a brief outline
The mathematical models linking MFE, NTL, and SD_DFT were arrived through regression analysis. Regression is a generic term for all methods that attempt to fit a model to observed data in order to quantify the relationship between two groups of variables. The fitted model may then be used to merely describe the relationship between the two groups of variables, namely, the predictor or the independent variable(s) and the dependent or the target or the response variable(s). In all cases, the target (dependent variable) is a function of the independent variables called the regression function. In general terms, the two data matrices involved in regression are usually denoted as X and Y, where X represents the independent variable and Y represents the dependent variable. The purpose of regression is to build a model Y
The literature on regression analysis present different types of regression. Authorities classify regression under different heads. Broadly, we have nonlinear regression and linear regression. Linear regression is one in which the observational data are modeled by a function that is a linear combination of the model parameters and depends on one or more independent variables. For regression analysis in this work, linear regression was adopted as linear nature was observed in the relationship of parameters analyzed. As there is more than one predictor variable, multiple linear regression was used for developing the mathematical models for MFE in this work. The iteration done here is based on the minimum squared errors approach. Here, we will see a brief description of the regression analysis performed in this work.
The general format for the multiple linear regression relationship can be expressed by the regression equation as
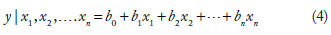
where y represents the response variable and {x} represents the predictor variables. b0 is the intercept of the linear model and b1, b2, b3. represent the regression coefficients. 20 Regression analysis method followed here develops a model based on the parameters analyzed. The response variable is expressed in terms of the predictor variables, using this model. In equation (4), each b coefficient represents the change in the mean response, E(y), per unit increase in the associated predictor variable when all the other predictors are held constant. For example, b1 represents the change in the mean response, E(y), per unit increase in x1 when x3, x4,…xn are held constant. The intercept term, b0, represents the mean response, E(y), when all the predictors x1, x2, x3,…xn are zero.
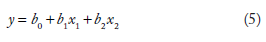
In this work, there are two predictor variables (NTL and SD_DFT) and one response variable (MFE). So, in the present context, the regression equation reduces to
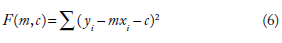
The simplest of linear regressions is the simple linear regression, which can be represented by the equation y = mx + c, the equation to a straight line, with slope m and intercept c, where {Y} would represent the response variable and {X} the predictor variable. A detailed discussion of regression is not intended here. The reader is referred to standard text books for further reading.20–22 Traditionally, the method of least squares regression allows you to find a two-variable linear equation y = mx + c that provides the “best fit” for the data points. In ordinary least squares, fit is defined as minimizing the squared vertical errors, that is finding the values of m and c that minimize the function
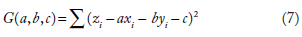
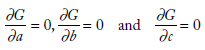
The solution can be found by minimizing the first differentials of F with respect to m and c, ie, ∂F/∂m = 0 and ∂F/∂b = 0. This basic idea can be extended to multiple linear regression to find the equation of a plane, which has the basic equation, z= ax + by + c, such that the vertical distances between points (xi, yi, zi) and plane are minimum. To do this, in the least squares approach, you must find the values of a, b, and c that minimizes the equation
which can be solved from the condition that the partial derivatives
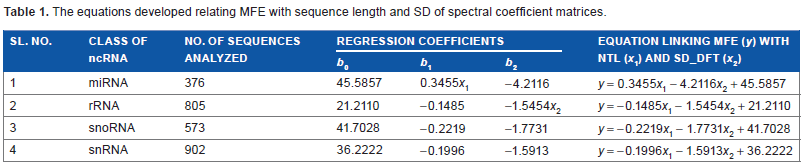
In the work presented here, multiple linear regression analysis was done taking MFE as the response variable and NTL and SD_DFT as the predictor variables. The statistical toolbox of MATLAB R2016a was used to perform regression analysis. Linear equations were arrived at linking the three, for the four classes of ncRNA analyzed. The equations are explained in the “Results” section and tabulated in Table 1. MFE was computed from sequence length and standard deviation of the spectral coefficient matrix using these mathematical models, for each class of the ncRNA analyzed. The accuracy of the model developed was probed by comparing the MFE values obtained by using the model (named MFE_C) with MFE values obtained via MATLAB (named as MFE_M), and relative deviations were found. The performance of the model was evaluated by comparing MFE values computed using it with the ones obtained from standard web servers RNAfold (MFE_F) and RNAstructure (MFE_S). Deviations in MFEs computed with the models developed were found relative to the MFE values obtained using these two web servers. Sample results have been included in the “Results” section.
The equations developed relating MFE with sequence length and SD of spectral coefficient matrices.
Results
A total of 2656 ncRNA sequences belonging to four classes (miRNA, rRNA, snRNA, and snoRNA) were downloaded from databases, GenBank and Rfam. Optimal MFE secondary structures of the sequences were found with the thermodynamic nearest neighbor approach using MATLAB R2016a. Mathematical models for MFE for these four classes of ncRNA were developed from the signal parameters of the sequences, viz., length and SD of spectral coefficient matrices of the sequences. The deviation in the computation of MFE with the proposed model was found relative to the MFE values obtained with MATLAB and using two web servers, RNAfold and RNAstructure. Sample results are given in this section.
Figure 2 shows a sample secondary structure plot, the MFE secondary structure of rRNA sequence from Mus musculus with NCBI accession id NR_046118.1. MFE obtained for this sequence is –54.3 kcal/mol. The dynamic programming approach used with the thermodynamic nearest neighbor model ensures that only the optimal MFE secondary structure is plotted.
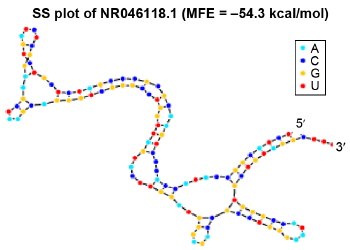
Secondary structure plot of NR_046118.1. M. musculus rRNA.
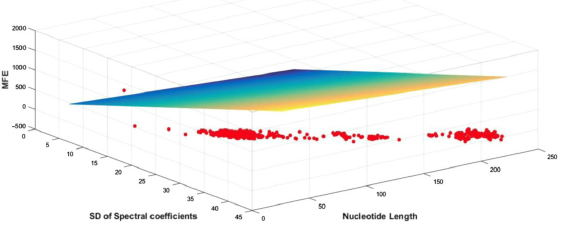
MFEs computed with the thermodynamic nearest neighbor algorithm via MATLAB were related to the signal properties of the sequences, namely, the length and the standard deviation of the spectral coefficient matrices of the sequences. Figures 3 and 4 show sample plots of MFE scattered against NTL (length of the sequence) and SD_DFT (standard deviation of the spectral coefficients) in 3D space. The plots have MFE marked along the z axis, NTL along the x axis, and SD_DFT along the y axis. Figure 3 shows the scatterplot for the snRNA sequences analyzed here and Figure 4 is for snoRNA sequences. The rainbow grid in the graphs indicates the ideal fit plane. In regression, perfect fit is said to occur when the iterations of the predictor variables are perfect and there is zero error. The scatterplots taken for the different classes of ncRNA sequences show that most of the points fall on one plane, the number of outliers are very few. This indicates the correctness of the analysis.
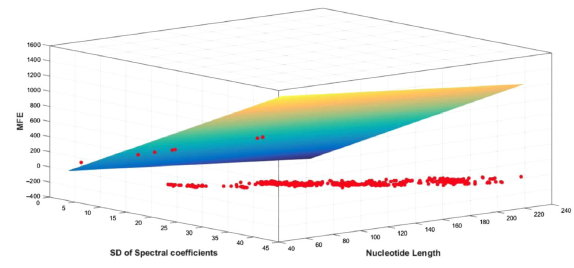
Plot of MFE vs NTL and SD_DFT for snRNA (902) sequences.
Plot of MFE vs NTL and SD_DFT for snoRNA (573) sequences.
The mathematical models developed relating MFE to the length and standard deviation of spectral coefficient matrix of sequences from the four classes of ncRNA analyzed are given in Table 1. The values of regression coefficients b1 and b2 and the intercepts b0 obtained for each class are also shown. The mathematical model developed for each class was used in computing MFE from NTL and SD_DFT for the corresponding class of ncRNA analyzed.
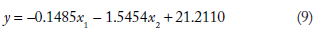
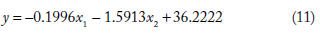
The general form of the equation is (as given in the “Materials and Methods” section) = b1x1 + b2x2+ b0, where y is the dependent variable and x1,x2 are the predictor variables. The significance of the regression parameters b0, b1, and b2 has been already explained in the previous section. The equation linking MFE (y) with NTL (x1) and SD_DFT (x2) are


Using the above mathematical models, MFE was computed (indicated as MFE_C) from nucleotide length (NTL) and the standard deviation of the spectral coefficient matrix (SD_DFT) for each of the four classes of ncRNA. The relative deviation of the computed MFE was found relative to the values obtained using MATLAB. These relative deviations are indicated as RD1. The relative deviation values crossed ±15% for about only about 2% of the sequences in all the 2656 sequences studied. This indicates that the data analyzed was conducive to regression analysis.
Sample results of this computation have been included in this paper. Supplementary Table 1 shows results for computation of MFE using the model developed for snRNA sequences studied here. These 902 sequences belong to different Rfam families, viz., RF00004, RF00007, RF00026, RF00283, RF00492, RF01458, RF01475, RF01490, and RF00618. The mathematical model is given in equation (11) above. Supplementary Table 1 has the identities of sequences that are in column 2. The third column shows the length of the sequence (NTL) and the fourth column has the standard deviation of the spectral coefficient matrix of the sequence (SD_DFT). From these two signal parameters, MFE is computed as per the mathematical model developed for snRNA: = –0.1996x1 – 1.5913x2 + 36.2222, where y is MFE, x1 is NTL (nucleotide length), and x2 is SD_DFT (standard deviation of the spectral coefficient matrix of snRNA sequences). This equation was obtained by regression analysis of the 902 snRNA sequences studied. The MFE computed from the model is indicated as MFE_C, whereas MFE computed with the Bioinformatics toolbox of MATLAB is indicated by MFE_M. Deviation in the computation of MFE_C was found relative to MFE_M (shown as RD1), and the percentage of relative deviation is shown in column 8 of Supplementary Table 1. A total of 1.55210% (14 out of 902 sequences) of the sequences had values of RD1 beyond ±15%. These have been highlighted in red. One outlier was found, which had a value of relative deviation 41.98703% (sequence id AAFD02000024.1/69022-69131). These results indicate that the sample at hand was conducive to regression analysis. The time of computation have also been recorded and are given in Supplementary Table 1 under each family. The average time of computation was found to be between 0.15 and 0.7 seconds.
Accuracy of the models developed was checked by computing the relative deviations of MFE values obtained using the model (MFE_C) with those obtained using the web servers RNAfold (MFE_F) and RNAstructure (MFE_S), which are represented as RD2 and RD3, respectively. Of the total 2656 sequences analyzed, around 95% were found to have relative deviations (both RD1 and RD2) within ±15%. The deviation values were less than ±5% for 45% and were between ±5% and ±10% for 35% of the sequences. A total of 15% of the sequences had deviation values between ±10% and ±15%. Only 5% of the sequences had deviation values above ±15%. The correlation between the MFE values obtained via RNAfold and RNAstructure was not found to be 1 always. The maximum relative discrepancy in their values for snRNA sequences was found to be 20.7%, and up to 22% discrepancy was noticed for the miRNA sequences analyzed.
The results of comparison for 902 sequences of snRNA belonging to the different Rfam families already mentioned are presented in Supplementary Table 2. Deviation in the value of MFE_C found in relation to MFE_F and MFE_S is indicated as RD2 and RD3, respectively, in Supplementary Table 2. The percentage deviations are also given, indicated by RD2 and RD3 in columns 6 and 9, respectively. Out of the 902 snRNA sequences analyzed, 1.555% (14 out of 902) 6.2% (56 out of 902) has values of RD2 beyond ±15% and 6.6% (60 out of 902) had values of RD3 beyond ±15%. These details are clearly indicated in Table 2, which shows the percentage of relative deviations in MFE values computed. The details shown in Table 2 can be summed up as follows:
Percentage deviations of MFE values computed with the proposed model for snRNA sequences relative to MFE values computed with MATLAB, RNAfold, and RNAstructure.
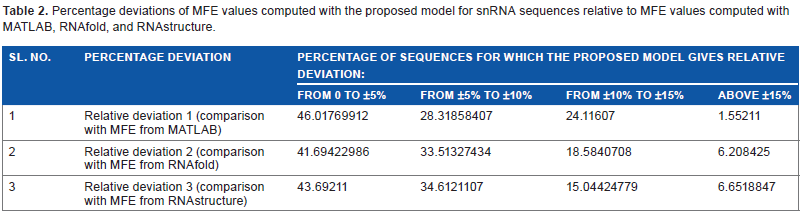
46.01%, 41.695%, and 43.692% of the sequences showed a deviation of 0 to ±5% when the MFE values obtained with the proposed model are compared with those obtained with MATLAB, RNAfold, and RNAserver, respectively.
Similarly, the proposed model showed a relative deviation of ±5% to ±10% for 28.32%, 33.51%, and 34.61% of the sequences in the three comparisons in the order mentioned above.
24.11°%, 18.58%, and 15.044% of the sequences had ±10% to ±15% deviation when the MFE values from the model were compared with the ones obtained using MATLAB, RNAfold, and RNAserver, respectively.
Deviations above ±15% were shown only by about 1.55%, 6.21%, and 6.65% of the sequences in the same comparisons.
Discussion
Recent advancements in molecular biology have brought to the forefront the importance of ncRNA in regulating numerous functions of the cell. Understanding the structure of RNA is one of the keys to understanding its function. Length and MFE of sequences are also common indices used to study RNA. In this work, the MFE of ncRNA sequences, which decides the optimal secondary structure, was analyzed with respect to its relationship to the sequence length and the standard deviation of spectral coefficients.
The parameters, sequence length, and MFE have been used in analyzing RNA from a very early time.23,24 There have been studies that have explored the influence of length and MFE on sequence stability.25,26 MFE has also been used as an index to study the relationship between entropy and structural properties of RNA sequences. 27 Washeitl et al 28 described an ncRNA gene finder that makes use of MFE z score computations, together with comparative genomic techniques. The mean and standard deviation of MFE of sequences are made use of here. Clote et al 29 described a method of “asymptotic z score” that sets asymptotic limits for mean and standard deviations of MFE per nucleotide of random RNA. They perform certain precomputations that speed up z score computations for the entire genome using a sliding window scan. This method provides a filter that can be used together with MFE computations and pattern matching to identify functional RNA genes in expressed sequence tags and genomic data. RNAs for which native state (the free energy structure) is functionally important were found to have lower folding energy, when compared to random RNAs having the same length and dinucleotide frequency. As MFE is a discerning factor, knowing its value would be useful in situations where it is needed to know quickly whether a given sequence is functional or a random RNA sequence.
MFE is a vital tool in identifying ncRNA genes. Lim et al 30 described a technique for identifying miRNA genes where a moving window scan searches for stem-loop structures having at least 25 base pairs and has a predicted MFE of –25 kcal/mol or less. A window that accommodates 21 nucleotides is passed over each conserved stem-loop structure, and a log-likelihood score is assigned to each window to determine how well its attributes resemble those of experimentally verified miRNA. Warris et al 31 described yet another method of prediction of small regulatory RNAs in genomes using MFE distribution of sequences as the discerning factor. The underlying principle is that the secondary structures of small regulatory RNAs have lower free energies than random RNA or other ncRNA sequences of the same length and nucleotide composition.
As is evident from the above, MFE and sequence length are important parameters to be analyzed in the study of RNA. Computational methods have been widely employed to study ncRNA. Even though DSP methods have become as popular as computational methods in the analysis of genomic data, little work has been done, which makes use of DSP techniques to analyze the noncoding genome. Though sequence length and MFE have been used extensively in analyzing RNA, a mathematical relationship linking MFE to the length or any other signal property of the sequence has not been reported in literature till date. Here, in this work, we have introduced a novel approach that links MFE, a thermodynamic property of ncRNA sequences to their signal properties.
The sequences studied in this work were taken from NCBI and Rfam databases. More than 2600 ncRNA sequences belonging to four classes, viz., snRNA, snoRNA, rRNA, and miRNA, across different organisms were analyzed. A novel mathematical model linking MFE, sequence length, and standard deviation of spectral coefficient matrix was developed for all the classes of ncRNA analyzed, and MFE was computed using this model. The performance of the models developed here for the four classes of ncRNA analyzed was checked for accuracy with standard web servers, RNAfold and RNA structure.
The main findings of this study can be summarized as follows. It was found that the MFE values computed with the proposed model was in concordance with those obtained from the web servers. The time of computation was comparable with that of RNAfold. In the comparisons mentioned above, the relative deviations of MFE values obtained with all the four proposed models were found to be within 0% to ±5% for about 45% of the sequences; within ±5% to ±10% for about 35% of the sequences; between ±10% and ±15% for 15% of the sequences. Only around 5% of the sequences gave relative deviation percentages above ±15% in all the three comparisons. This shows the accuracy of the model.
At this point, it needs to be mentioned that at room temperature, RNAs exist in an ensemble of structures and the MFE structure is not always the biologically relevant one.32,33 There are several algorithms to predict these suboptimal secondary structures.34–36 Most of the common secondary structure rediction methods assume that the functional RNA structure depends solely on the thermodynamic equilibrium and does not consider the kinetics of folding. The impact of the kinetics of folding on the functional structure of RNA is not fully known. 28 However, in examples like RNA switches, kinetics of folding is significant and there are studies that analyze this aspect.37,38 A sequence may fold into reliable structures other than the MFE structure or switch between structures as a consequence of energy fluctuations in the range of a few kT, where k is the Boltzmann constant and T is the absolute temperature. 39 This energy range is around 3 kcal/mol at 37°C. Secondary structure is also predicted based on the ensemble, making use of McCaskill's algorithm. 36 The probability of a particular base pair in the thermodynamic ensemble is found using a partition function over all possible structures, computed with the algorithm. 40 Secondary structure prediction has also been performed by identifying a centroid structure, which is thought to represent the ensemble. 41 In this work, we have considered only one structure from the ensemble, viz., the MFE secondary structure. The accuracy of the model examined here pertains only to the MFE structure from the ensemble of structures.
The accuracy of MFE-based secondary structure prediction depends on the type of RNA. Generally, it can be assumed that only two-thirds of the actual base pairs are predicted correctly while one-third of the true base pairs are missed, 36 even with the best of currently available prediction methods. In addition, all MFE-based structure prediction approaches give only a rough model of the RNA structure. Base pairing possibilities are described by the Shannon entropy introduced by Huynen et al. 42 Shannon entropy is a measure of how well defined the RNA structure for a given sequence is.
Mathematically, the average S value for a sequence is given by
for all 1 ≤ i ≤ j ≤ N, 43 where N is the length of the sequence and Pi, j is the probability of base i pairing with base j.
Well-defined structures are said to have lower Shannon entropy than those that have many alternate structures (alternate/competing base pairs). 42 Hence, Shannon entropy has been used to pick the most probable structure form the Boltzmann ensemble.44,45 The value of S is directly linked to N as shown in the above equation. Shannon entropy increases with the logarithm of the length N of the sequence and starts to saturate at a sequence length of 500. 43 The mathematical models developed here link MFE linearly to the length of the sequence as well as to the standard deviation of spectral coefficients. The spectral coefficients are computed after performing mathematical mapping of the sequence string as already explained, the value of which depends only on the bases in the sequence and base pairing is not considered. Shannon entropy is not the sole indicator to the correctness of base pairs predicted in the MFE structure. 42 As Shannon entropy is not directly linked mathematically to MFE, a direct mathematical relationship between Shannon entropy and spectral coefficient matrix cannot be made within the confines of this study. However, shorter sequences have lower values for S 42 and have stable structures. It was found in this work that shorter sequences have lower values of SD of spectral coefficient matrix. So we could say that shorter sequences have lower Shannon entropy, lower values of SD_DFT, and lower MFE and form the more stable structures in the ensemble.
As already mentioned, no MFE-based secondary structure prediction algorithm ensures foolproof structures, as base pairs may be missed or wrongly predicted. The authors do not claim that this is the perfect method for computing MFE. Nevertheless, the technique presented here is computationally simple, and it is the first of its kind that links a thermodynamic quantity with the signal properties of the sequence. Signal processing techniques have the inherent property of computational simplicity and easiness of implementation. Genomic sequences possess more signal properties, and there are varieties of DSP tools that can be put to use to analyze them. Researchers should explore ncRNA using DSP techniques, and this work should be considered as an initial step in the direction.
Conclusion
Over 2600 ncRNA sequences belonging to four classes were analyzed here with respect to the relationship between their MFE and signal parameters. Novel mathematical models linking MFE with the signal properties of ncRNA sequences of these four classes was arrived at. Only about 5% of the sequences showed relative deviations above ±15% when MFE values obtained with the model were compared with those obtained using conventionally accepted methods. This shows the accuracy of the models developed. Thus, the mathematical models are specific to the ncRNA classes studied and represent them aptly. Authors do not claim that the model developed here is the perfect method to compute MFE. But this work brings to light the relationship between the thermodynamic entity MFE and the signal properties of the sequence. This shows that the noncoding genome too is conducive to analysis with DSP techniques. DSP methods have the unique convenience of ease of implementation and lesser computational complexity. It is hoped that this novel relationship linking MFE with signal properties of the sequences can be taken forward so that more signal processing approaches evolve to study ncRNA.
Author Contributions
Conceived and designed the experiments: TPG and TT. Collected and analyzed the data: TPG. Wrote the first draft of the manuscript: TPG. Contributed to the writing of the manuscript: TPG. Agreed with manuscript results and conclusions: TPG and TT. Jointly developed the structure and arguments for the paper: TPG and TT. Made critical revisions and approved the final version: TPG and TT. All the authors reviewed and approved the final manuscript.
Supplementary Materials
Footnotes
Acknowledgments
Tina P. George would like to thank the authorities of the Department of Electronics, Cochin University of Science and Technology (CUSAT), for providing access to the resources to carry out this work under the guidance of the second author, Dr. Tessamma Thomas.