
Abstract
Ganoderma lucidum (lingzhi) has been used for the general promotion of health in Asia for many centuries. The common method of consumption is to boil lingzhi in water and then drink the liquid. In this study, we examined the potential anticancer activities of G. lucidum submerged in two commonly consumed forms of alcohol in East Asia: malt whiskey and rice wine. The anticancer effect of G. lucidum, using whiskey and rice wine-based extraction methods, has not been previously reported. The growth inhibition of G. lucidum whiskey and rice wine extracts on the prostate cancer cell lines, PC3 and DU145, was determined. Using Affymetrix gene expression assays, several biologically active pathways associated with the anticancer activities of G. lucidum extracts were identified. Using gene expression analysis (real-time polymerase chain reaction [RT-PCR]) and protein analysis (Western blotting), we confirmed the expression of key genes and their associated proteins that were initially identified with Affymetrix gene expression analysis.
Introduction
Ganoderma lucidum is a bitter fungus with a glossy exterior and a woody texture. 1 It is commonly referred to as “lingzhi” in China and has been used in most Asian countries for the promotion of health and longevity for centuries.1–3 Numerous pharmacological effects associated with lingzhi have been recorded, which include immunomodulating, 4 anti-inflammatory, 5 antitumor,6–8 radioprotective, 9 antiviral, 10 antioxidative,6–8 and antiaging6–8 properties.
Several studies have shown that G. lucidum contains a wide range of bioactive compounds associated with the promotion of good health.1,2,4–14 These bioactive compounds can be extracted via water-based or ethanol-based extraction methods.8,15 The extraction process is very important for consumption of G. lucidum as the fungus is tough and indigestible by humans. There are many ways to consume G. lucidum;8,15 one method of consumption is to submerge the fungus in alcoholic beverages for a prolonged period of time. Since alcoholic beverages contain both water and ethanol components, this method can potentially extract the active ingredients of G. lucidum associated with both solvents. 16 Various extracts of G. lucidum have been shown to have anticancer effects in both in vivo (mouse model) and in vitro (cancer cell lines) studies.8,17 These include cytotoxic,18,19 antimetastatic,20–22 and immune-modulating23–26 effects. Therefore, G. lucidum is an interesting plant extract that has been widely used in alternative medicine and1–3 proven to have numerous implications to be used as a potential anticancer drug; however, still much research needs to be done to quantify it for personalized medicine, especially in treating specific cancers such as prostate cancer (PCa).
Currently, PCa is the most commonly diagnosed cancer in males in Australia and New Zealand and the fifth most common cancer worldwide. 27 Human cell lines are commonly used as models of PCa. There are several commonly available PCa cell lines that differ in their molecular properties. Two PCa cell lines were used in this study: PC3 and DU145. Both are aggressive and androgen-independent forms of PCa, with PC3, and not DU145, still retaining the coregulators required for Androgen-dependent tumor suppression. 28 The aim of this study is to identify any potential anticancer effect of G. lucidum extracts in PCa with in vitro cell culture tests. In addition, the biologically active pathways associated with the observed activities were determined using various gene/protein expression analyses, including Affymetrix, real-time polymerase chain reaction (RT-PCR), and Western blotting (WB). WB, the detection of proteins using specific antibodies, has been used to detect the expression levels of specific proteins in tumors after treatment with G. lucidum.29,30
Method
Preparation of G. lucidum alcohol extract.
The G. lucidum alcohol extracts tested in this study were provided by NZFocus. The extract contained dried G. lucidum from the Himalayan region (Fig. 1) submerged in either whiskey (13-year-old single malt scotch whiskey, D. Johnston & Co.) or rice wine (Pearl River Bridge, Guandong PRB Bio-Tech Co.) for six months. G. lucidum was then removed from the alcohol extracts. After the extraction processes, the extracts were stored in room temperature in darkness and were then examined for any potential anticancer activity in human PCa cell lines. Controls are listed in Table 1. G. lucidum submerged in whiskey or rice wine is referred to as G. lucidum whiskey extract (GWh) or G. lucidum rice wine extract (GRW), respectively. The positive control used in this study was azathioprine (Sigma-Aldrich). Azathioprine, owing to its property of inhibiting DNA synthesis and cell proliferation,31,32 is a cytotoxic drug used for the treatment of several diseases, including cancer.
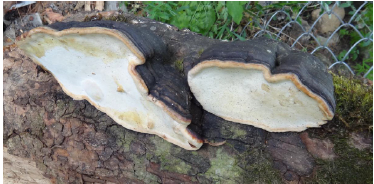
Wild G. lucidum from the Himalayan region grown on the base of deciduous tree. Photo courtesy of NZFocus Ltd.
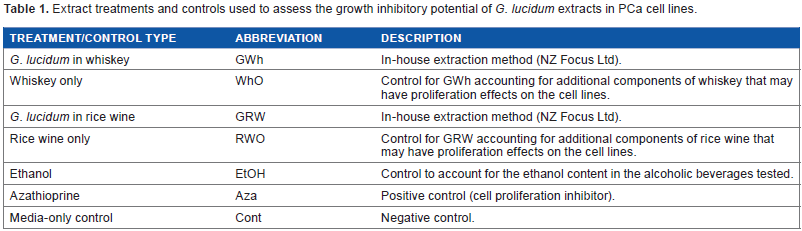
Extract treatments and controls used to assess the growth inhibitory potential of G. lucidum extracts in PCa cell lines.
Cell culture
Cryopreserved PCa cell lines (DU145-HTB-81™; PC3-CRL-1435™) were purchased from American Type Culture Collection. Experimental work was carried out within three months of cell thawing. The media used and the doubling times of the cell lines are shown in Supplementary Table 1. The cell lines were grown in 25 mL Becton Dickinson Falcon™ cell culture flasks (BD Biosciences) at 37°C with 5% CO2.
Growth inhibitory assays
The cells were harvested when they reached 90% confluence. All cell lines were seeded at a cell density of 2,000 cells/well in 96-well plates (Corning Incorporated) and incubated overnight at 37°C with 5% CO2 before being treated with the aforementioned extracts (Table 1). The cells were incubated under the same conditions for four doubling cycles. Growth inhibition was measured using the sulforhodamine B-based assay. 33 Using results from the growth inhibition assays, the optimal dosing range was determined. Four technical repeats and two biological repeats were performed. Standard curve analysis was calculated using Sigma plot 11.0 (Systat Software Inc.), and the 50% inhibition of proliferation (IC50) values of each extract in each cell line were determined using a standard curve.
RNA extraction, quantitation, and qualification
The cell lines were treated for four doubling cycles with G. lucidum extracts and controls at established IC50 dosages. Thereafter, RNA was isolated using an RNeasy Plus Mini Kit (Qiagen). The concentration and purity of the RNA samples were assessed using a NanoDrop® ND-1000 Spectrophotometer (Thermo Fisher Scientific).
The integrity of the RNA sample was checked using an Agilent 2100 bioanalyzer (Agilent Technologies, Inc.) using facilities at the School of Biological Sciences, The University of Auckland. Each RNA sample had a minimum RNA integrity number of 9.5 or higher, indicating that the RNA samples had not degraded. Technical triplicates were performed per extract per cell line.
Affymetrix analysis
The GeneChip® PrimeView™ Human Gene Expression Array (Affymetrix) was used to measure the gene expression profile of each selected cancer cell line after treatment with the extracts and control solvents. The expression of more than 20,000 genes using 530,000 probes covering 36,000 transcripts and variants was measured. 34 Each probe set contains 20 probes targeting different sequences of the same gene. 34 Three repeats per sample were used for Affymetrix gene expression analysis.
The expression level of genes is associated with the absorbance values of the probes targeting each specific gene. 34 The media-only treatment was considered as a negative control for this study as it represented the normal level of gene expression. The gene expression levels after treatment with GWh or GRW were compared with media-only control to calculate the changes in gene expression as a result of G. lucidum treatment using the extracts. Furthermore, the changes in gene expression levels were adjusted with the whiskey-only and rice wine-only controls. This removed the changes in gene expression levels due to the alcohol solvents in the G. lucidum extracts.
Statistical analysis
R software 35 was used for the analysis of Affymetrix data. Data were normalized using robust multiarray average approach. Significance was calculated using limma t-statistic with adjustments to alcohol-only control samples. P-value was adjusted using “fdr” as included in the limma package, where fdr is the Benjamini and Hochberg's method to control the false discovery rate. 36
The data generated from the Affymetrix analysis were filtered based on the level of statistical significance. A prespecified P-value was set at 0.01 for statistical significance. Any probes with an adjusted P-value greater than 0.01 after adjustment for alcohol consumption were removed from further analysis. R was used for statistical analyses. 37
After the removal of probes, further analysis was done separately for up- and down-regulated genes to investigate these differentially expressed genes. The genes with greater than twofold changes in expression were selected for pathway analyses to help identify the most strongly affected pathways.
Pathway analyses, gene annotation tool to help explain relationships (GATHER) (http://gather.genome.duke.edu/), and PathVisio 3.1.2 (www.pathvisio.org) were used to determine the association between gene expression levels and biological pathways. GATHER is specialized in determining the strength of association between genes and pathways. PathVisio is specialized in portraying the interactions between genes within the pathways of interest.
RT-PCR
RNA was converted to cDNA using a Quantitect Reverse Transcription Kit (Qiagen). The expression levels of 28 genes, based on fold change and pathway analysis, were determined using RT-PCR (Custom TaqMan array card, Thermo Fisher Scientific) in triplicate. Glyceraldehyde 3-phosphate dehydrogenase (GAPDH), Hypoxanthine-guanine phosphoribosyltransferase (HPRT1), and 18S ribosomal RNA (18S) were used as housekeeping genes for the normalization of RNA expression. PCR was performed with 7900HT thermocycler (Applied Biosystems), and the amplified products were quantified using TaqMan® probes (Invitrogen). A standard curve was calculated using comparative Ct analyses with SDS2.3 and RQ Manager 2.2 software from three technical repeats. The relative expression was calculated as fold change using Microsoft Excel (2010). Probes where the range of the maximum and minimum fold change is either >1 or <–1 were considered statistically significant.
Western blotting
Protein samples were extracted by adding radioimmunoprecipitation assay buffer to cell culture and placing on ice for 15 minutes. The lysates were centrifuged for 15 minutes at 14,000 × g at 4°C. Protein concentrations in the lysates were measured using the bicinchoninic acid assay. A total of 20 µg of protein was loaded and electrophoresed on a 12.5% SDS-PAGE Bolt mini gel (Novex Bolt 12% Bis-Tris Plus). Size standards from 3 to 188 kDa (SeeBlue® Plus2 Pre-stained Protein Standard Novex) were included in each gel.
After electroblotting, the proteins separated in the gel were transferred to a polyvinylidene difluoride membrane (Bio-Rad) using a semidry Trans-Blot® Turbo™ Blotting System (Bio-Rad). Membranes were stained with Ponceau S solution (Sigma-Aldrich) and then saturated with blocking buffer (5% skim milk powder in 1 × PBS-T) and incubated at room temperature for one hour with gentle rocking. Membranes were then rinsed in PBS-T and incubated with primary antibody (Ab) (Supplementary Table 2) for one hour at room temperature. Membranes were washed three times in PBS-T and incubated with secondary Ab at 4°C overnight.
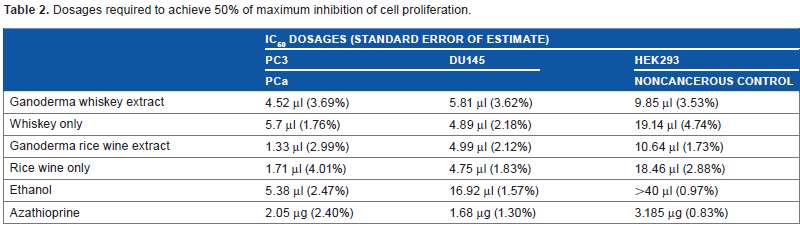
Dosages required to achieve 50% of maximum inhibition of cell proliferation.
Chemiluminescence substrate, Clarity™ Western-enhanced chemiluminescence (Bio-Rad), was added to the membrane and incubated in the dark for five minutes. The membrane was exposed to UV and the signals were measured using image reader LAS-3000 (Fujifilm). The signal was quantified with Science Lab MultiGauge (Fujifilm).
Results
Growth inhibition of the cell lines
The growth inhibitory properties of G. lucidum extracts were investigated using two human PCa cell lines and one noncancerous cell line as a control cell line.
IC50 dosages of each cell line/extract combination are shown in Table 2. GWh has the strongest inhibition of proliferation, followed by whiskey-only and ethanol-only extracts, which suggests that the G. lucidum component in GWh contributes to the inhibition of proliferation. In addition, components in whiskey also showed some inhibition of proliferation, although not as powerful as the GWh. GRW had a stronger inhibitory effect on PC3 than DU145 and showed stronger inhibition than rice wine-only and ethanol-only extracts. The IC
Affymetrix result
Affymetrix gene expression analysis has been used to identify several thousand genes with statistically significant changes in their expression levels (Table 3). PC3 and DU145 cell lines showed changes in expression levels of large number of genes associated with GWh treatment, but few changes in gene expression following the administration of GRW. HEK293, used as a control cell line, showed only a small number of genes with significant changes in expression levels following treatment with both G. lucidum extracts.
Number of genes with statistically significant changes in expression after treatment with GWh extract. All genes shown are after adjustment with whiskey-only and media-only controls.
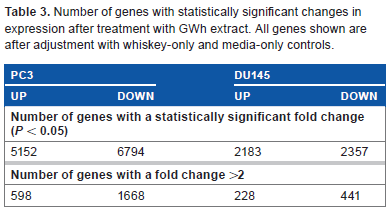
Figure 2 shows all the genes that had statistically significant changes in expression levels after treatment with GWh in PC3 and DU145 cell lines. There are 1,875 genes that have statistically significant changes in expression in both PC3 and DU145 cell lines.
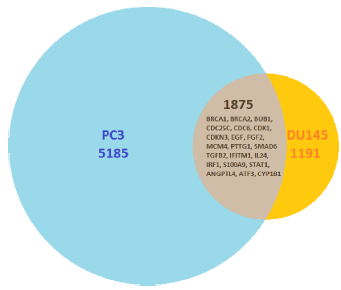
Number of genes with statistically significant changes in their expression levels after treatment with G. lucidum whiskey extract and adjusted with whiskey-only control. Affymetrix analysis showed that between PC3 and DU145 cell lines, there are 1,875 genes that had statistically significant changes in the expression levels in both cell lines. The overlap lists several genes that had undergone RT-PCR analysis to validate the observed expression.
The raw data of Affymetrix gene expression analysis are available at figshare.com/s/c702649a78ff11e5b39206ec4b8d1f61
Pathway analysis using GATHER
The genes identified to have significant changes in expression levels were submitted to GATHER in order to examine the relationships between the relevant genes and biological pathways. Lists of biological pathways were generated and ranked based on their Bayes factor scores.
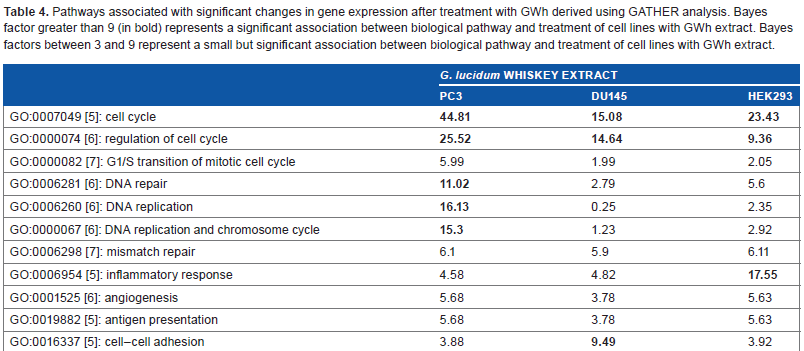
Table 4 shows a list of the significant pathways that were associated with cell cycle, DNA repair, and cancer progression. All cell lines demonstrated statistically significant changes in gene expression levels associated with cell cycle after treatment with GWh. Only PC3, and not DU145 and HEK293, showed strong changes in gene expression associated with DNA repair. All the three tested cell lines showed moderate-to-strong changes in gene expression levels associated with inflammatory response, angiogenesis, antigen presentation, and cell–cell adhesion (Table 4).
Pathways associated with significant changes in gene expression after treatment with GWh derived using GATHER analysis. Bayes factor greater than 9 (in bold) represents a significant association between biological pathway and treatment of cell lines with GWh extract. Bayes factors between 3 and 9 represent a small but significant association between biological pathway and treatment of cell lines with GWh extract.
Pathway analysis using PathVisio
PathVisio is an open-source pathway analysis and visualization software. 38 Using PathVisio 3.1.2 and additional plugins, pathway analysis was performed to determine the strength of association between pathways and sets of genes. Table 5 shows a list of pathways with significant changes in gene expression after treatment with GWh.
Pathways associated with significant changes in gene expression after treatment with GWh derived using PathVisio. Bold faces represent significant association between pathway and extract.
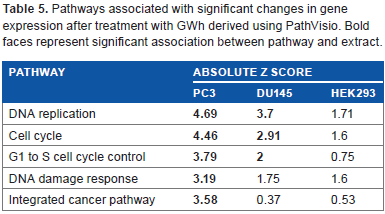
Z-score is another method of presenting statistical association for the strength of association. In Table 5, a Z-score greater than 2 suggests strong association with the pathway. The PCa cell lines used in this study showed a strong association with cell cycle-associated pathways, whereas HEK293, a noncancerous cell line, showed weak or no significant association with the pathways listed (Table 5).
Biologically active pathways
The biologically active pathways associated with cancer and cancer progression involve complex interactions of numerous genes. Using GATHER, biologically active pathways with the strongest associations with changes in gene expression are ascertained. Utilization of the PathVisio 3.1.2 program and data from WikiPathways (http://wikipathways.org/) allowed us to visualize these biological pathways in combination with changes in gene expression levels. Figure 3 shows the interactions between the genes associated with cell cycle and the changes in their expression level after treatment with GWh in the PC3 cell line. Almost all genes, including the cyclindependent kinases (CDK), involved in cell cycle progression were discovered to be down-regulated after treatment with GWh. CDK is a family of proteins crucial for the successful progression of the cell cycle. 39
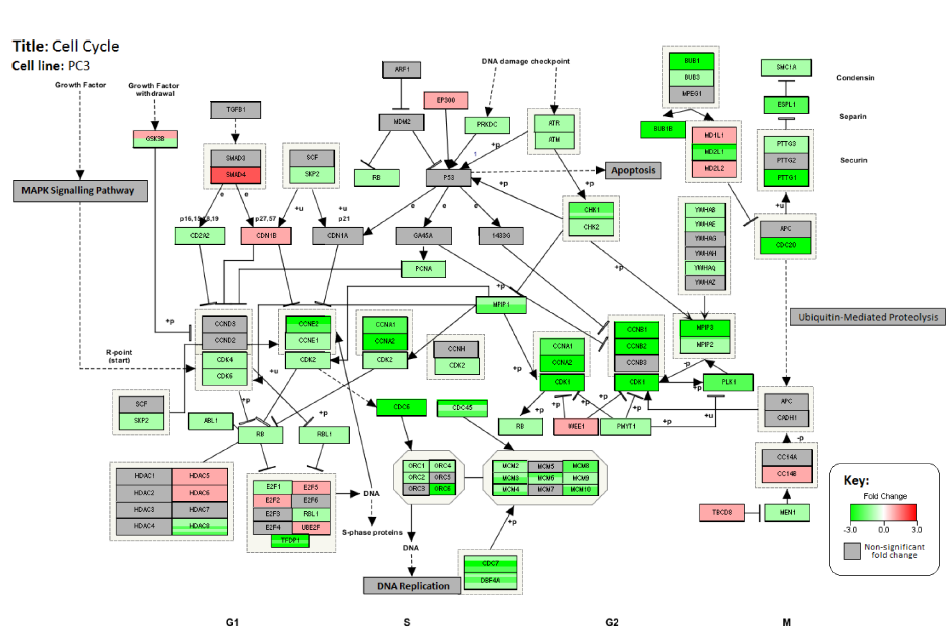
Changes in the expression levels of genes associated with cell cycle pathway in PC3 cell line after treatment with G. lucidum whiskey extract. Down-Regulated genes are highlighted in green and upregulated genes are highlighted in red.
Figures 4 and 5 illustrate the interactions between the genes associated with apoptosis. Figure 4 represents the changes in gene expression levels of these genes after treatment with GWh in the PC3 cell line. Figure 5 shows the changes in gene expression in the noncancerous control cell line, HEK293. The genes involved in the apoptotic pathway are either proapoptotic or antiapoptotic. PC3 shows upregulation of proapoptotic genes, including various caspases, while antiapoptotic genes are observed to be down-regulated. HEK293 shows downregulation of various proapoptotic genes and upregulation of antiapoptotic genes.
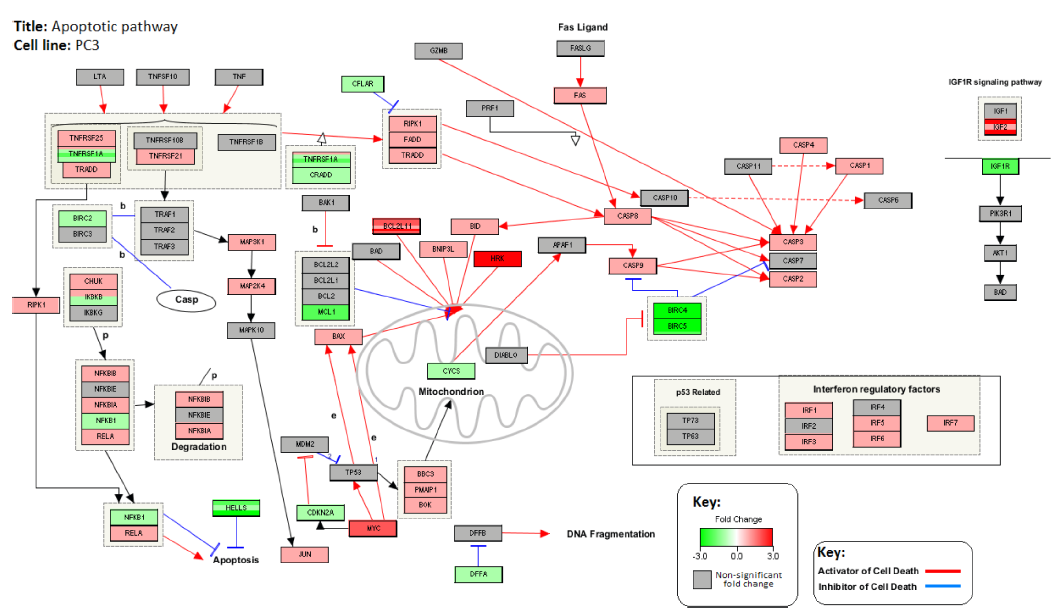
Changes in the expression levels of genes associated with apoptotic pathway in PC3 cell line after treatment with G. lucidum whiskey extract adjusted with whiskey-only control. Down-Regulated genes are highlighted in green and upregulated genes are highlighted in red. Red colored lines indicate interactions that promote apoptosis. Blue colored lines indicate interactions that inhibit apoptosis.
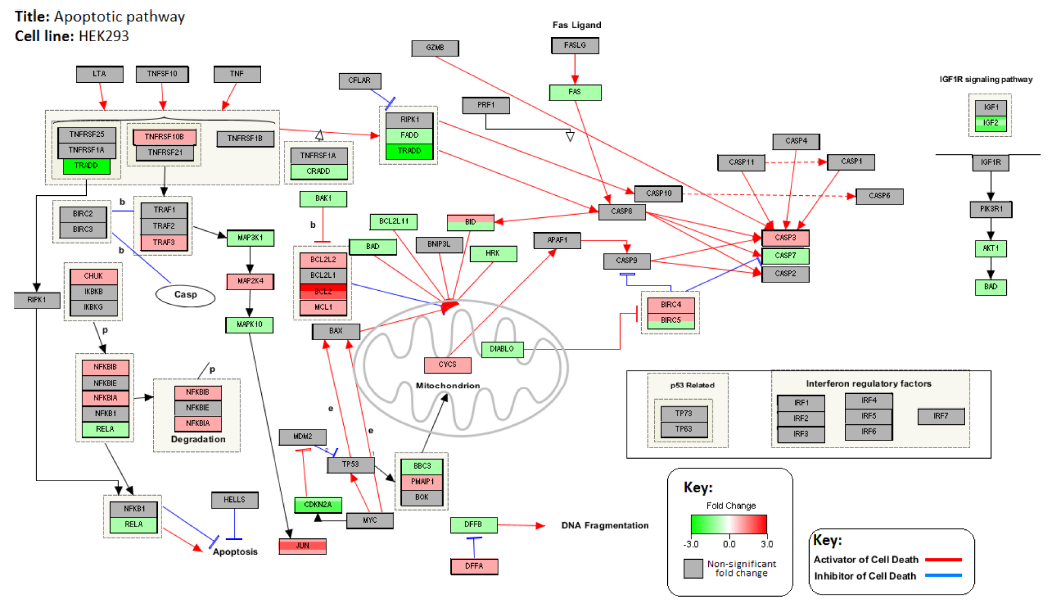
Changes in the expression levels of genes associated with apoptotic pathway in HEK293 cell line after treatment with G. lucidum whiskey extract adjusted with whiskey-only control. Down-Regulated genes are highlighted in green and upregulated genes are highlighted in red. Red colored lines indicate interactions that promote apoptosis. Blue colored lines indicate interactions that inhibit apoptosis.
Figure 6 illustrates the interaction between the genes associated with inflammatory and immune response pathways. The changes in gene expression levels in the PC3 cell line after treatment with GWh are also shown in Figure 6. The immune cells affected by these genes are shown in orange text. A strong upregulation of various cytokines associated with activation of a diverse range of immune cells was observed.
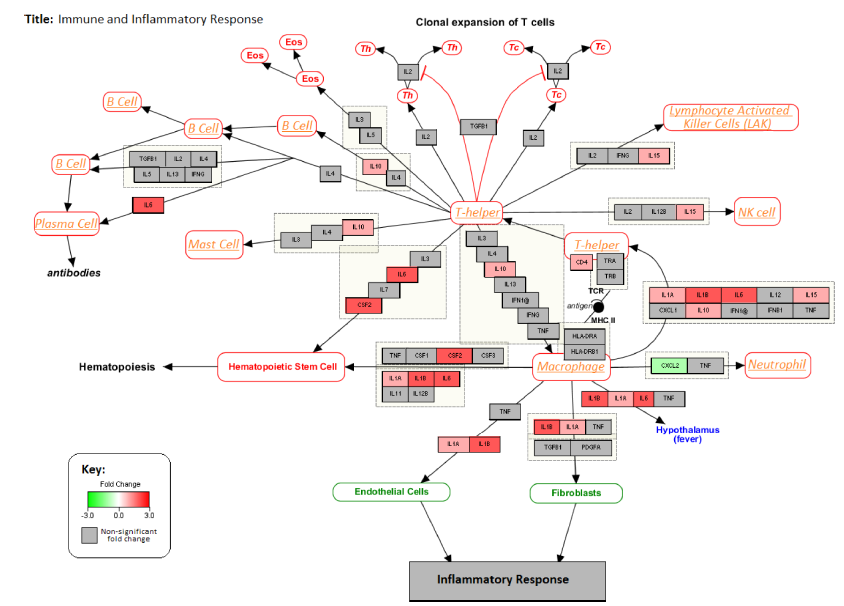
Changes in the expression levels of genes associated with inflammatory cytokines in PC3 cell line after treatment with G. lucidum whiskey extract adjusted with whiskey-only control. Down-Regulated genes are highlighted in green and upregulated genes are highlighted in red.
RT-PCR and WB
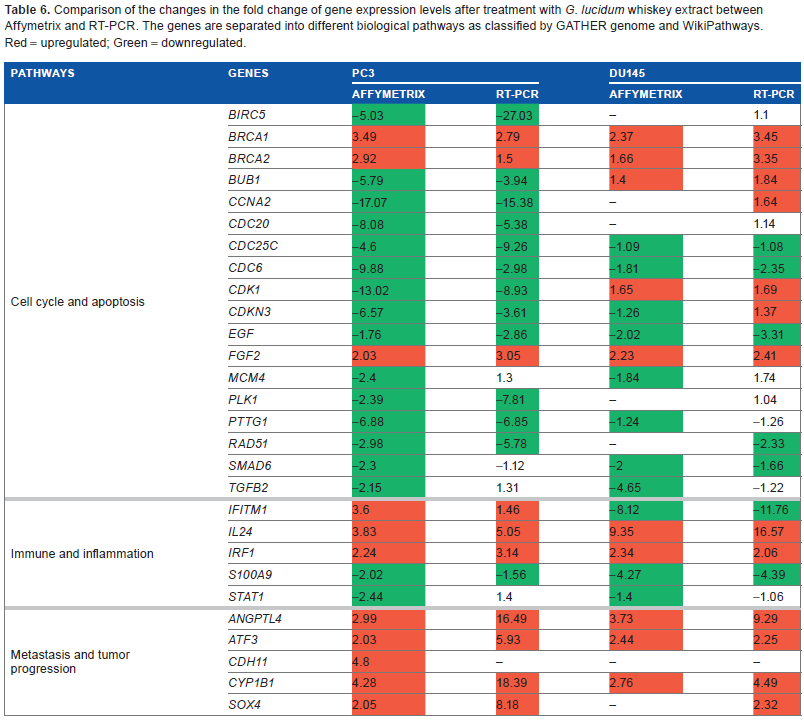
The expression levels of different genes obtained from RT-PCR analysis were compared to the gene expression levels obtained from the Affymetrix array analysis. The comparison between gene expression levels obtained from the Affymetrix and RT-PCR assays by treating the PC3 and DU145 PCa cell lines is shown in Table 6. Most genes showed similar changes in expression levels between RT-PCR and Affymetrix analysis, with the exception of CDKN3 in DU145 cell line that had upregulated expression in RT-PCR analysis but down-regulated expression in Affymetrix.
Comparison of the changes in the fold change of gene expression levels after treatment with G. lucidum whiskey extract between Affymetrix and RT-PCR. The genes are separated into different biological pathways as classified by GATHER genome and WikiPathways. Red = upregulated; Green = down-regulated.
In addition, the protein expression levels were determined by WB. Figure 7 shows the WB bands after treatment with GWh, WhO, and media. Thicker bands representing greater levels of protein can be observed in the figure. Therefore, if GWh-treated bands are thicker than their media-only counterparts, the protein expression levels of the corresponding genes are stimulated by GWh. For all the genes tested, their changes in protein expression levels are in the same direction as their gene expression changes (Fig. 8).
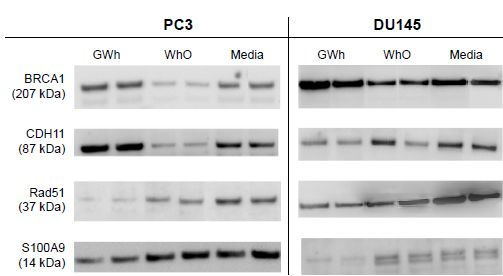
Western blot analysis of protein expression levels in PC3 and DU145 cell lines after treatment with GWh, WhO, and media only (no treatment control).
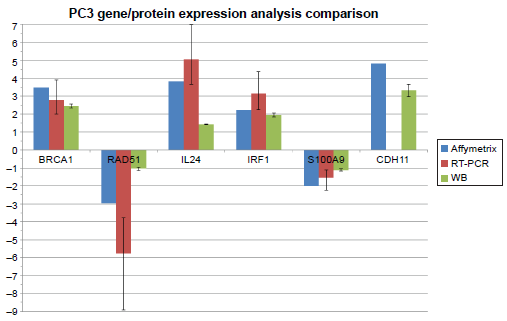
Comparison of the fold changes in gene/protein expression levels of six genes and their related proteins in PC3 cell lines after treatment with G. lucidum whiskey extract. Affymetrix and RT-PCR analyses were used for the measurement of gene expression levels and Western blotting was used for the measurement of protein expression levels.
Discussion
Cell culture
Both the G. lucidum extracts tested showed significant growth inhibitory effects on both cancer cell lines (Table 2). At 50% growth inhibition dosages of the GWh and GRW, their respective solvents also showed smaller but observable growth inhibition (Table 2). This suggests that the alcoholic solvents also contributed to the observed growth inhibitions. Studies have found that malt whiskey may potentially inhibit cancer development by increasing the antioxidant content in humans.40,41 When adjusted for the liquor-only counterpart, G. lucidum still showed strong observable growth inhibitory properties in both the cancerous cell lines. This suggests that G. lucidum extracts have growth inhibitory effects in cancer cell lines and may have potential anticancer properties.
Most biologically active compounds in G. lucidum can be extracted with water or ethanol.8,15,42 It is possible that GRW and GWh contain active ingredients of both G. lucidum water- and ethanol-based extracts, as both types of liquors contain ethanol and water solvents. Therefore, consuming G. lucidum liquor extracts may potentially have a more valuable effect than using only ethanol-based or water-based extracts for use as an anticancer agent.
Affymetrix gene expression analysis
Our results indicate that over 11,000 genes have statistically significant changes in their expression levels after treatment with GWh and GRW. This is suggestive of the fact that G. lucidum extracts have a wide range of effects. Unlike traditional anticancer drugs that target single pathways, G. lucidum extracts consist of a number of components that can potentially exert their anticancer activities through multiple biologically active pathways. This is important because tumor cells can mutate rapidly and develop immunity to drugs that target a single pathway. 43
GWh demonstrated a strong influence on gene expression in the two PCa cell lines tested. Relatively few significant changes in gene expression were detected after treatment with GRW. This is consistent with the observation that the IC50 dosages of GRW and rice wine-only extracts (Table 2) were similar.
In addition, GWh has influenced the gene expression levels in the noncancerous cell line, which suggests that GWh can have an effect on healthy cell lines. In the noncancerous cell line, pathway analysis showed that the genes that promote apoptosis were down-regulated and the genes that inhibit apoptosis were upregulated by G. lucidum extract. This effect is observed only in the control noncancerous cell line, which suggests that the observed effects may promote survival in healthy cells. This observation corresponds with the studies conducted by Cherian et al and Ajith et al, who showed that G. lucidum promotes longevity.44,45
Pathway analysis
The development of cancerous cells is a multistep process involving normal cells, acquiring several hallmarks of cancer to evolve to a neoplastic state. 43 These biological capabilities of malignant cells can be targeted for the treatment of cancer.
Treatment with G. lucidum-based extracts resulted in changes in the gene expression levels of various genes associated with a number of different biologically active pathways (Tables 4 and 5). The use of the Affymetrix array permitted the simultaneous characterization of the expression levels of a large number of genes. This aided in the examination and discovery of biologically active pathways associated with the anticancer activity of G. lucidum.
Cell cycle and apoptosis
Treatment of cancerous cell lines with G. lucidum extracts resulted in changes in gene expression associated with cell cycle and DNA replication. Cell cycle is a process by which cells divide and proliferate; thus, in order to control the deregulated growth of cancer cells, 43 various anticancer compounds, for example, flavonoids and paullones, can be used that act by inhibiting the cell cycle pathway. 46 However, drugs that inhibit DNA replication, such as azathioprine, fail to completely eradicate cancer cells and are often not only associated with a high level of toxicity but can also lead to the development of drug resistance in cancer cells. 47
Affymetrix array analysis and pathway analysis were used to identify genes associated with cell cycle control. Genes such as the CDKs, which are upregulated during cell cycle in normal and cancerous cells, 39 were found to be down-regulated after treatment with GWh in PCa cell lines (Table 6). This indicates that the amount of cells undergoing cell cycle progression is decreased, which contributes to the observed growth inhibitory effects.
Apoptosis is important for the maintenance of multicellular life. It allows cells to initiate controlled cell death for the benefit of the organism as a whole by removal of older, less efficient cells and elimination of damaged and/or virally infected cells.48,49 Cancer cells deregulate apoptosis either through the overexpression of antiapoptotic proteins or through the action of mutations that reduce the efficiency of or completely remove proapoptotic proteins.48,49 The final process of apoptosis involves the activation of a series of caspases known as the caspase cascade.18,19 In the PC3 cell line treated with GWh, the gene expression levels of the proapoptotic caspases are found to be upregulated, which suggests the activation of the caspase cascade that would in turn trigger apoptosis. The activation of the caspase cascade with G. lucidum extracts has been observed in other studies involving various cancer cell lines, including oral mucosal cancer and colorectal cancer.14,15 This effect seems to be cancer specific as it was not observed in the noncancerous control cell line, HEK293. This is important to note as various cytotoxic drugs that promote apoptosis in cancer cells can also cause apoptosis in healthy cells, which contributes to the acute side effects observed from cytotoxic drugs. 50 The observation that the apoptotic effect of GWh is cancer specific suggests that it may be used specifically for cancer therapy without producing severe toxicity in humans.
In HEK293 cell line, GWh increased the expression of antiapoptotic genes such as CDK1. This suggests that GWh may promote cell survival in healthy, noncancerous cells and may contribute to the antiaging health benefits associated with G. lucidum. This finding is consistent with studies that have reported G. lucidum to promote antioxidant activities and reduce aging.44,45 The observed protective effects of G. lucidum in healthy cells can be used in conjunction with cytotoxic drugs, as it reduces the apoptotic rate of normal cells triggered by cytotoxic drugs,9,26 and thus may offer a higher level of protection for normal cells.
Tumor immunity and progression
Inflammation and immunity are two closely linked biological pathways. 51 Both pathways play a key role in the development and progression of tumors. 52 Various studies have found that G. lucidum polysaccharide extracts can promote the immune system, in particular, antitumor immunity that promotes immune-mediated killing of tumor cells.23–26 Using the GATHER pathway analysis, we found that GWh influenced the genes associated with the inflammatory and immune response (Fig. 6), in particular, the upregulation of genes associated with the activation of T-helper lymphocytes that are required to mount an effective immune response. 53 Therefore, G. lucidum extracts may potentially promote immunity via stimulation of T-helper cells. However, as the cell lines used are not immune cells, additional studies using immune cells will be required to assess if G. lucidum extracts have immune-activating abilities.
Furthermore, we identified that treatment with G. lucidum extracts affects cell–cell adhesion and angiogenesis.54,55 Cell–cell adhesion involves the expression of proteins on the surface of the cell and controls the attachment of one cell to another. Strong cell–cell adhesion reduces the risk of tumor cell detachment and, thus, reduces the risk of metastasis. A cell–cell adhesion protein CDH11 was found to have increased in expression after treatment with G. lucidum extracts. The increased CDH11 expression could promote cell–cell adhesion and reduce the risk of metastasis via cell detachment. 56
Angiogenesis is a physiological process that involves the development of new blood vessels from preexisting vessels. 57 Tumor angiogenesis promotes tumor expansion by supplying essential nutrients and oxygen, and the increased blood flow increases the risk of metastasis. Thus, the suppression of these properties will decrease tumor invasive behaviors and reduce the risk of metastasis.20–22
Gene expression comparison with protein expression
We compared the expression levels of the 28 genes obtained by RT-PCR analysis with those obtained by Affymetrix array analysis to validate the accuracy of the Affymetrix analysis and assess the chance of false positives (ie, type-1 errors). Additionally, we selected 6 genes from the 28 tested genes in RT-PCR and performed WB to determine if the changes in gene expression were translated to changes in their protein expression levels. The six selected genes are BRCA1, Rad51, CDH11, IL24, IRF1, and S100A9, which have statistically significant differences in their gene expression levels.
BRCA1 and Rad51 are tumor suppressor genes. BRCA1 plays a major role in DNA damage repair and in the control of cell cycle. 58 In PCa, BRCA1 directly interacts with androgen receptors and induces the expression of cyclindependent kinase inhibitors, leading to inhibition of cell cycle and apoptosis.59,60 Affymetrix and RT-PCR analyses showed upregulation of BRCA1 gene expression in both PC3 and DU145 cell lines (Table 6). In addition, WB showed increased expression of protein expression levels that matches the increased gene expression levels (Table 6).
Rad51 is involved in the repair of DNA double-strand breakages. 61 Overexpression of Rad51 results in a range of consequences, including increased resistance to DNA damaging agents, disruption of the cell cycle, and increased apoptotic cell death. 61 Overexpression of Rad51 is also associated with aggressive PCa. 62 After treatment with GWh, Rad51 gene expression was found to be down-regulated in PC3 cells in both Affymetrix and RT-PCR analysis. WB also showed a decrease in the expression of Rad51 protein. In the DU145 cell line, Affymetrix analysis did not show any significant decrease in Rad51 gene expression after treatment with GWh. Nevertheless, RT-PCR and WB showed a decrease in the expression levels of Rad51 gene and protein, respectively (Table 6).
In the PC3 cell line, Affymetrix analysis showed increased CDH11 gene expression after treatment with GWh. However, RT-PCR failed to detect CDH11 expression levels in both PC3 and DU145 cell lines. CDH11 is involved in cell–cell adhesion and its increased expression in tumors is associated with a reduced risk of metastasis. 56 WB showed an increase in the expression of CDH11 protein after the treatment. This suggests that, even though RT-PCR failed to detect any expression, CDH11 levels are still positively increased by the treatment with G. lucidum extracts.
Protein expression of the gene S100A9 was found to be down-regulated by GWh treatment in both PC3 and DU145 cell lines. The same S100A9 is overexpressed in many cancer types such as breast, prostate, and lung cancers. 63 Its expression is further upregulated by hypoxia, which is also common in tumors. 64 Therefore, the observed downregulation of S100A9 gene expression can potentially reduce inflammation. Other studies have also found that G. lucidum extracts can down-regulate proinflammatory cytokines; however, an alcohol form of G. lucidum extract had not been tested previously.65–67
Both the gene and protein expression levels of IL24 and IRF1 are upregulated after treatment with GWh (Table 6). The genes IL24 and IRF1 have tumor suppressive capabilities that are associated with the Janus-activated kinase (JAK)/signal transducers and activators of transcription (STAT) signaling.68,69 The JAK/STAT signaling pathway is crucial in the cytokine-mediated immune response and is involved in proliferation and apoptosis. 70 IL24 can also induce apoptosis mediated through mitogen-activated protein kinase (MAPK) pathways. 71 IL24 has been shown to induce apoptosis in various cancer cell lines. 72 Upregulation of IL24 and IRF1 has antiproliferative effects in breast and colorectal cancers.73–76 This suggests that GWh can inhibit tumor proliferation and promote antitumor response through JAK/STAT and MAPK signaling pathways.
Conclusion
For the first time, the growth inhibitory activities of two G. lucidum liquor-based extracts, namely, GWh and GRW, in human PCa cell lines and one noncancerous control cell line have been tested. We observed that GWh and GRW have positive growth inhibitory effects on cancerous cell lines. The growth inhibitory effects are stronger in G. lucidum extracts than their liquor-only counterparts. This shows that G. lucidum, when extracted using whiskey and rice wine, has growth inhibitory properties in cancer cells.
In addition, 28 genes and six proteins were selected based on the result of Affymetrix analysis and tested using RT-PCR and WB, respectively. We found that in the PCa cell lines, the gene expression levels were consistent between Affymetrix and RT-PCR analyses. Furthermore, WB showed that the protein expression levels were found to correspond to their respective gene expression levels. The results from the gene and protein expression analyses showed that the expression levels of the selected genes are strongly affected by treatment with GWh at both RNA and protein levels.
Using gene and pathway analyses, we identified several biologically active pathways, including the apoptotic pathway associated with anticancer activities of GWh in PC3 and DU145 cell lines. The potential anticancer effects of G. lucidum include inhibition of cell cycle, induction of apoptosis, and reduction of tumor progression. The biologically active pathways associated with both ethanol and water extracts of G. lucidum were observed in response to GWh treatment, which suggests that GWh contains active ingredients from both water and ethanol components.
Future studies should focus on using metabolomic analysis to identify the active ingredients in the G. lucidum extracts. In addition, this study investigated the effect of G. lucidum in a cell line model. Further studies should be based on an animal model that would allow for the examination of the bio-availability of G. lucidum extracts and the complex interactions within the tumor microenvironment.
Author Contributions
Designed the study: CK, KB, and LF. Carried out the cell culture study: CK. Provided statistical support: DH. Participated in RNA extraction and RT-PCR analysis: PM and YX. Participated in RNA Agilent 2100 bioanalyzer analysis and preparation for Affymetrix gene expression analysis: GM and YX. Drafted and made critical revisions of the manuscript: CK and KB. All the authors commented on the manuscript, read, and approved the final version.
Footnotes
Acknowledgment
The authors acknowledge The University of Auckland for providing access to the resources necessary for the completion of this study.
Supplementary Materials
A list of the primary Abs used in WB, together with their molecular weights and dilution ratio (Abcam). Abs were diluted in 5 mL of 5% nonfat dry milk.
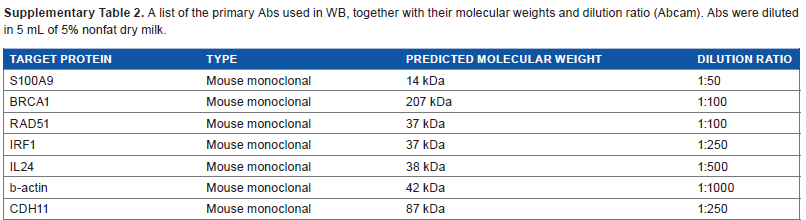
| TARGET PROTEIN | TYPE | PREDICTED MOLECULAR WEIGHT | DILUTION RATIO |
|---|---|---|---|
| S100A9 | Mouse monoclonal | 14 kDa | 1:50 |
| BRCA1 | Mouse monoclonal | 207 kDa | 1:100 |
| RAD51 | Mouse monoclonal | 37 kDa | 1:100 |
| IRF1 | Mouse monoclonal | 37 kDa | 1:250 |
| IL24 | Mouse monoclonal | 38 kDa | 1:500 |
| b-actin | Mouse monoclonal | 42 kDa | 1:1000 |
| CDH11 | Mouse monoclonal | 87 kDa | 1:250 |