
Abstract
In the present study, recurrent copy number variations (CNVs) from non-tumor blood cell DNAs of Caucasian non-cancer subjects and glioma, myeloma, and colorectal cancer-patients, and Korean non-cancer subjects and hepatocellular carcinoma, gastric cancer, and colorectal cancer patients, were found to reveal for each of the two ethnic cohorts highly significant differences between cancer patients and controls with respect to the number of CN-losses and size-distribution of CN-gains, suggesting the existence of recurrent constitutional CNV-features useful for prediction of predisposition to cancer. Upon identification by machine learning, such CNV-features could extensively discriminate between cancer-patient and control DNAs. When the CNV-features selected from a learning-group of Caucasian or Korean mixed DNAs consisting of both cancer-patient and control DNAs were employed to make predictions on the cancer predisposition of an unseen test group of mixed DNAs, the average prediction accuracy was 93.6% for the Caucasian cohort and 86.5% for the Korean cohort.
Keywords
Background
The aim of cancer prediction is to reveal genetic predisposition toward cancer before cancer occurs, so that vigilant prevention and rigorous monitoring may be practiced by those who are highly predisposed. Notably copy number variations (CNVs) have been associated with the risk toward individual cancers.1–23 However, although nearly half of the approximately 100 highly penetrant cancer-predisposition genes are identified as CNVs related to cancers, many of the CNVs are rare CNVs instead of recurrent CNVs. Moreover, hitherto only a small proportion of genes overlapped by CNVs represent highly penetrant cancer susceptibility loci, and the vast majority of CNVs are supposed to have low to moderate penetrance and contribute only modestly to diseases. 24 Recurrent CNVs that might be associated with a generalized predisposition to different cancer are also unknown. Nonetheless, because rare CNVs are absent from a majority of genomes, only recurrent CNVs can provide a foundation for widely useful cancer prediction. Accordingly, the present study has been directed to the detection of possible correlations between recurrent CNVs in the constitutional genome and generalized risk toward cancers that would enable the development of an effective method for predicting the genetic predisposition to cancers.
The search for useful recurrent CNV-cancer correlations requires a comparison of the recurrent constitutional CNVs found in cancer-patients and those found in control-subjects, so that distinguishing recurrent CNV-features that occur with unequal frequencies in the two groups may be identified and employed as prediction markers. In this regard, machine learning incorporating receiver-operating characteristic (ROC) analysis, which was originally introduced to distinguish between meaningful radar signals and noise, and has since found important application in diverse fields of clinical medicine,25–28 could furnish a particularly powerful tool for the selection of CNV-features that can contribute to a distinction between individuals with different levels of predisposition to cancer.
Methods
Data collection
Human SNP array data on whole blood samples from cancer patients and ethnically matched healthy subjects obtained using the high resolution Affymetrix SNP6.0 platform were retrieved from the databases Gene Expression Omnibus (GEO) 29 and caArray. 30 In total, data on 640 samples belonging to Caucasian (47 control and 51 cancer) and Korean (195 control and 347 cancer) datasets from 9 separate studies31–38 were employed as shown in Supplementary files 1 and 3.
Generation of segmented data
The program apt-copy number-workflow with default settings from Affymetrix power tools 39 was employed to generate the CNV callings for each of a target batch of [control + cancer] samples analyzed. In the case of the Caucasian and Korean DNA samples, the averaged microarray data for 270 HapMap samples acquired using the SNP6.0 platform were supplied by Affymetrix and processed using apt-copy number-workflow to generate a reference template for determination of CN-gain or CN-loss. Segmentation of neighboring CNVs into CN-gain segments and CN-loss segments was performed based on the copy number values using circular binary segmentation (CBS) with the default parameters in DNACopy in R program. 40 The genomic coordinates employed in the present study referred to human reference genome version hg19/GRCh37, and the annotation file used with the SNP6.0 platform was release version 32.
Identification of recurrent constitutional CNVs
To identify significantly recurrent CNVs, the GISTIC2 algorithm which considers both the frequency and amplitude of every CNV was employed with the options “-small-mem 1–broad 1–brlen 0.5–conf 0.9–ta 0.2–td 0.2–twosides 1–genegistic 1.” Only those CNVs with a log 2 ratio change of either >0.2 or <–0.2 were included in CNV analysis. Also, only significantly recurrent regions with lengths greater than 1 kb and less than 10 Mb, and with a q-value <0.25 were processed further. Samples from the Caucasian and Korean cohorts were calculated separately to avoid population-specific CNVs interfering with downstream analysis.
CNV analysis
To compare the general properties of CNVs in the control and cancer groups in each of the Caucasian and Korean cohorts, the CN-gains and CN-losses were analyzed separately. The difference in the number of CNVs per sample between the control and cancer groups was tested using the Wilcoxon test. To test for difference in CNV length distribution between the control and cancer groups, the CNVs were divided into three classes according to their lengths, viz. the ≤20 kb class, 20 kb < CNV ≤ 100 kb class, and >100 kb class. The 2 × 3 chi-square test was applied to assess the control-cancer difference regarding the distribution of the CNVs among these three classes.
Sample classification
To remove redundancy and prevent over-fitting of the data, three subsets of the informative CNVs were selected as CNV-features for analysis: (a) CFS subset: CfsSubsetEval from the Weka package was employed together with BestFirst search method to select CNV-features that were highly correlated with the control or cancer class yet largely uncorrelated with each other; (b) frequency-based subset: CNV frequencies between control and cancer were compared using the chi-square test, and CNVs with significantly different control and cancer frequencies were selected as CNV-features; and (c) classifier-based subset: the ClassifierSubsetEval attribute evaluator from the Weka machine learning package was employed with decision table together with BestFirst search method to select the CNV-features. Based on each of these three sets of CNV-features, the Naïve Bayes classification method from the Weka package was used to generate a training model that was tested with 1,000 iterations of twofold cross validation. To further test for robustness of the model, 10,000 permutated datasets were generated by randomly shuffling the group labels (“control” vs. “cancer”) for each sample within the original dataset, and the whole classification process was repeated for each permutated dataset. The significance of the original classification was calculated based on the distribution of correct prediction percentage from the 10,000 permutations. The Naive Bayes classification method was applied separately to the Caucasian and Korean datasets.
For each of the Caucasian and Korean datasets, the CFS classification process was also employed to classify the differences between different cancer types. For this purpose, only the cancer samples were analyzed, and the CNV-features were selected employing the CfsSubsetEval attribute evaluator together with BestFirst search method. Naive Bayes classification was again used to generate a training model that was tested with 1,000 iterations of twofold cross validation.
Sample clustering
The CNV-features selected using the CfsSubsetEval attribute evaluator together with BestFirst search method from the WEKA package were used for sample clustering purposes. Each dataset was clustered into control and cancer groups by employing Ward's method of hierarchical clustering implemented in the pvclust package in R 41 and subjected to 1,000 bootstrappings. k-means clustering was employed for cancer-type clustering by applying the k-mean package in R. Since the number of selected CNV-features was greater than two, the clusplot function in the cluster package was employed to display the clustering results for different cancer types. This function reduced the dimension of the data by principal component analysis (PCA) and yielded a plot of only the first two principal components.
Prediction of cancer-predisposition
To test the accuracy of prediction of cancer-predisposition based on recurrent CNV-features in the Caucasian cohort, normal subjects (N) in the cohort were randomly divided in a trial run into two groupings that were equal in number when there were an even number of subjects; or, when there were an odd number of subjects, an extra subject was randomly allocated to one of the two groupings so that they differed in size by only a single subject. One grouping was randomly assigned to the learning-band, and the other grouping to the test band. Similarly, for the cancer-patients (C), the CNVs from the colorectal cancer-patients were randomly divided into two groupings that were either equal in size or different by only one patient; again one grouping was randomly assigned to the learning-band, and the other to the test band. The glioma patient CNVs and the myeloma patient CNVs were treated the same way to finally yield an [N + C] learning-band and an [N + C] test band containing an equal or near-equal number of N or C samples. Thereupon, a set of correlation-based CNV-features were derived from the CNVs included in the learning-band. Applying this set of learnt correlation-based CNV-features to each and every individual in the test band using equation (1) yielded either a “true” or “not true” allocation of the individual into the normal or cancer class; altogether the predictions pertaining to all the individuals in the test band would yield an accuracy estimate for this trial run based on equation (2).
By repeating the random separation of samples into the learning-band and test band 1,000 times, 1,000 independent accuracy estimates were obtained for the Caucasian cohort, the distribution and average value of which are shown in Figure 6A. The normal subject, and colorectal cancer, gastric cancer, and HCC patient samples in the Korean cohort were likewise analyzed to yield 1,000 independent accuracy estimates, the distribution and average value of which are shown in Figure 6B.
Results
Characteristics of recurrent CNVs
To apply machine learning to recurrent CNVs, recurrent focal constitutional CNVs, 1 kb–10 Mb in length, that have undergone either CN-gain or CN-loss relative to reference human genome were obtained using the GISTIC2 algorithm 42 (see Methods) from Affymetrix single-nucleotide polymorphism (SNP) 6.0 microarrays of the non-tumor white blood cell DNA of 47 Caucasian non-cancer subjects and 26 glioma, 15 myeloma, and 10 colorectal cancer-patients,31–35 yielding a total of 353 CNVs (Supplementary files 1 and 2). Recurrent focal constitutional CNVs were similarly obtained from 195 Korean non-cancer subjects and 101 hepatocellular carcinoma (HCC), 95 gastric cancer, and 151 colorectal cancer-patients,36–38 yielding a total of 535 CNVs (Supplementary files 3 and 4). The distributions of these recurrent CNVs among different chromosomes and their q-values are shown in Figures 1A and 1B.
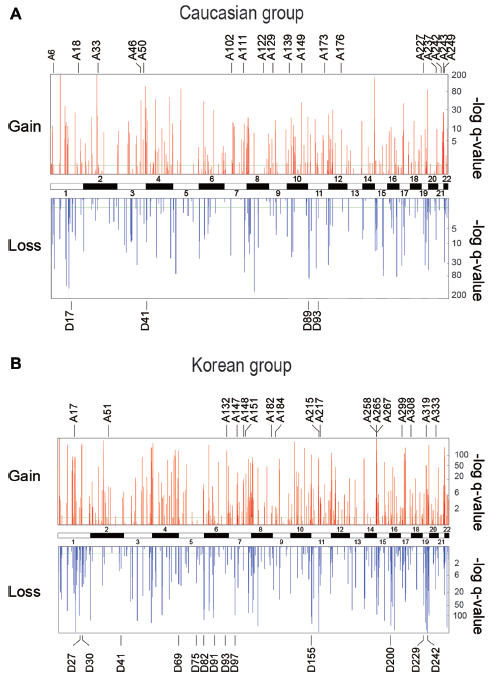
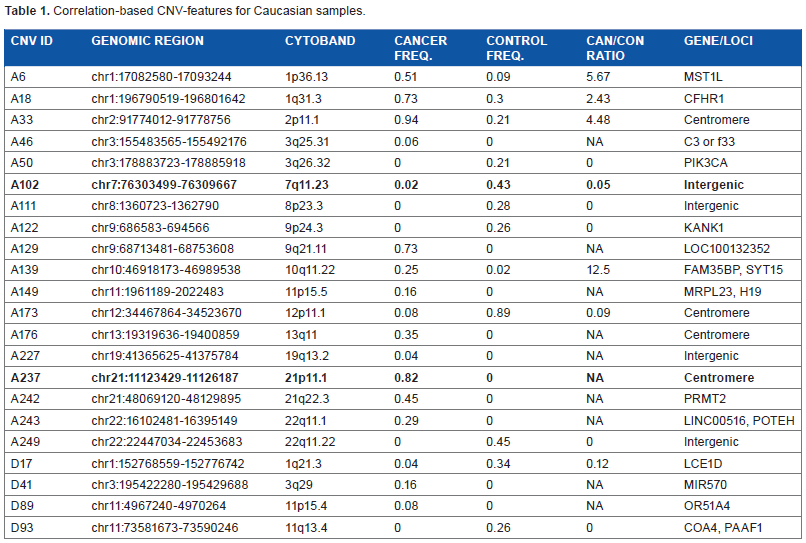
Recurrent CNVs in non-tumor white blood cell DNAs of (A) Caucasian cohort, and (B) Korean cohort. Upper panel shows q-values of CN-gains and lower panel shows q-values of CN-losses; the q-values were generated by GISTIC2 such that a high “–log q-value” indicates a highly non-random event. The CN-gains (A-series) and CN-losses (D-series) selected for inclusion in the correlation-based CNV-features of the Caucasian and Korean cohorts are shown in Tables 1 and 2.
Correlation-based CNV-features for Caucasian samples.
Correlation-based CNV-features for Korean samples.
These CNV regions do not overlap with any CNV region in the Database of Genomic Variants 2013 (DGV; http://projects.tcag.ca/variation/).
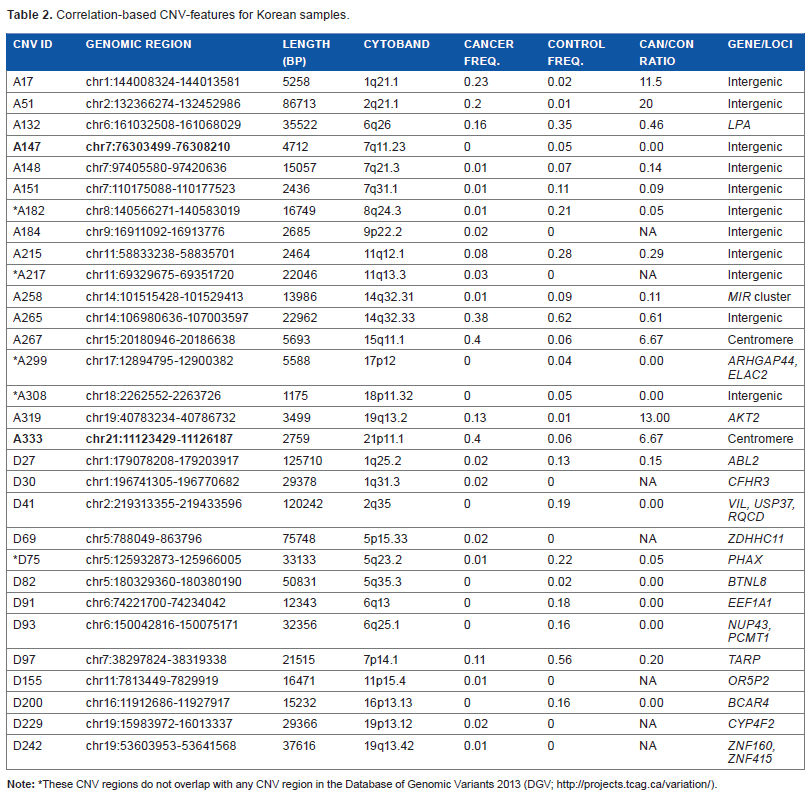
The recurrent focal constitutional CNVs obtained from the Caucasian and Korean cohorts included both CN-gains and CN-losses. There were moderately more CN-gains in the cancer-patient samples compared to controls in the Caucasian cohort, but there was no significant difference between the cancer-patient and control samples in the Korean cohort with respect to CN-gains. In contrast, a strongly significant decrease in CN-losses with P < 0.0001 in cancer-patient samples was observed in both the Caucasian and Korean cohorts (Fig. 2). When the CNVs were separated into small (≤20 kb), medium (20–100 kb), and large (>100 kb) ranges, there were fewer large CNVs than small or medium sized ones in both the control and cancer-patient samples among both the Caucasian and Korean cohorts. As shown in Figure 3, the partition of CNVs among the small, median, and large groups in the cancer-patients was significantly different from that in the controls, reaching P < 0.0001 (calculated by chi-square test) with respect to CN-gains in the Caucasian cohort, and with respect to both CN-gains and CN-losses in the Korean cohort.
Boxplots of the number of CNVs per sample in the control and cancer groups of (A) Caucasian cohort and (B) Korean cohort. Statistical significance was determined using Wilcoxon rank test.
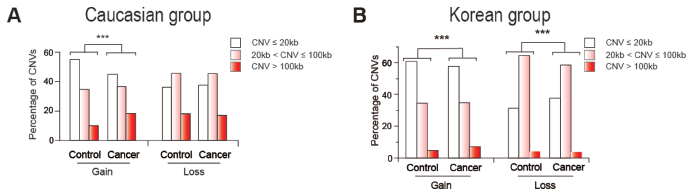
Distribution of CNV lengths in three length groups: short (CNV ≤ 20 kb, white bars), medium (20 kb < CNV ≤ 100 kb, gray bars), and long (CNV > 100 kb, black bars) in (A) Caucasian cohort and (B) Korean cohort. The percentage of CNVs in each group was calculated for the control and cancer cohorts and tested for difference using the chi-square test.
Distinguishing CNV-features
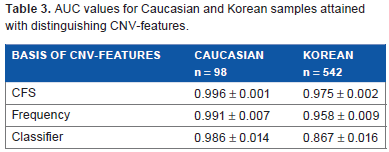
Three different approaches were employed to select sets of CNV-features that could effectively distinguish between the constitutional DNAs of control-subjects and cancer-patients by machine learning, including: (a) correlation-based feature selection (CFS) was used to generate correlation-based CNV-features43,44 that were highly correlated with either the “control” or “cancer” (viz. cancer-patient) class yet uncorrelated with one another; (b) frequency-based CNV-features were selected as CNVs that displayed significantly different frequencies in the control and cancer classes; and (c) classifier-based CNV-features were selected by means of the ClassifierSubsetEval feature evaluator in the Weka machine learning package. 45 The 22 correlation-based CNV-features derived from the combined Caucasian control and cancer samples, comprising 18 CN-gains and 4 CN-losses (Table 1), were recruited from widespread locations rather than any localized region of the human genome (Fig. 1A). The same applied to the 30 correlation-based CNV-features selected from the combined Korean control and cancer samples comprising 17 CN-gains and 13 CN-losses (Table 2; Fig. 1B), as well as the frequency- and classifier-based CNV-features from both ethnic cohorts (Supplementary files 5–8). A training model incorporating the three types of CNV-features and making decision on sample classification into the “control” or “cancer” class based on Naive Bayes yielded useful area under the ROC curve (ROC-AUC plotting true positive fraction versus false positive fraction) values for the Caucasian and Korean samples of 0.867–0.996, which were close to the maximum value of 1.0 and far above the null value of 0.5 (Table 3).
AUC values for Caucasian and Korean samples attained with distinguishing CNV-features.
Figures 4A and B shows the distributions of the recurrent CNVs in, respectively, the Caucasian and Korean cohorts among “cancer” (viz. cancer-patient) and “control” (viz. control-subject) samples. In both graphs, the occurrence frequencies of many of the recurrent CNVs in cancer samples (y-axis) were not greatly dissimilar to their occurrence frequencies in control samples (x-axis). Such CNVs, represented by open circles located between the two P′ = 0.05 curves, would be limited in usefulness as markers for distinguishing between cancer and control samples. In contrast, the recurrent CNVs that were selected as CNV-features by correlation-based, frequency-based, or classifier-based methods displayed a distinctly biased occurrence frequency, either displaying a high cancer frequency/control frequency (viz. “Can/Con”) ratio and distributed above the upper P = 0.05 lines or even the upper P′ = 0.05 lines; or displaying a low Can/Con ratio and distributed below the lower P = 0.05 lines or even the lower P′ = 0.05 lines. The biased-Can/Con ratios of these CNV-features, greater than 10 or smaller than 0.05 in some instances (Tables 1 and 2), readily furnished a rationale for their collective ability to extensively distinguish between the constitutional CNV-profiles of cancer-patients and those of control-subjects, resulting in high ROC-AUC values upon ROC analysis (Table 3).
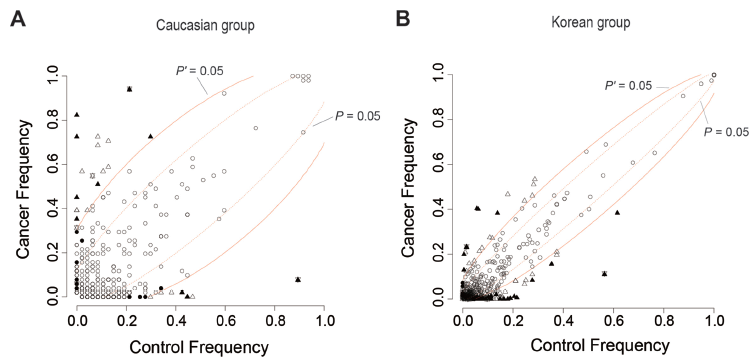
The occurrence frequencies of CNV-features selected by correlation, frequency, and classifier-based methods among the cancer and control samples of (A) Caucasian and (B) Korean cohorts. Solid triangle, CNV-feature selected by both correlation and frequency methods; solid circle, selected only by correlation method; open triangle, selected only by frequency method; solid triangle plus solid inverted triangle, selected by correlation method, frequency method, and classifier method; open triangle plus open inverted triangle, selected by frequency method and classifier method; open circle, not selected by any of the three methods. Chi-square based probability P of cancer and control frequencies being equal is >0.05 between the two dashed lines representing P = 0.05, and <0.05 outside these two dashed lines. The two solid lines representing P′ = 0.05, where P′ stands for P value after Bonferroni correction, likewise separate the in-between region of P′ > 0.05 and the outer regions of P′ < 0.05.
The chromosomal locations of the correlation-based CNV-features selected from the Caucasian and Korean samples are shown in Figures 1A and B bearing their respective A-series (viz. CN-gain) and D-series (viz. CN-loss) ID numbers. All of these CNV-features with the exceptions of Korean Nos. A182, A217, A299, A308, and D75 overlapped with known CNV regions recorded in the Database of Genomic Variants 2013. 46 There were limited identities between the Caucasian correlation-based CNV-features in Table 1 and their Korean counterparts in Table 2: only the bold-fonted Caucasian A102 and A237 CN-features in Table 1 overlapped with the bold-fonted Korean A147 and A333 CNV-features in Table 2, respectively.
The cancer samples from the Caucasian cohort included three types of cancers: glioma, myeloma, and colorectal cancer. Figure 5A shows that the CNV-feature contents in the three types of cancers were dissimilar. The cancer samples from the Korean cohort also included three types of cancers: gastric cancer, HCC, and colorectal cancer. Again, as shown in Figure 5B, the CNV-feature contents in the three types of cancers were dissimilar.
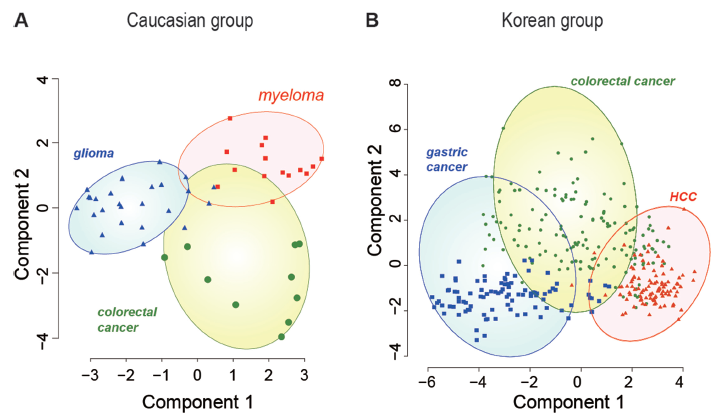
Distribution of correlation-based CNV-features in the non-tumor white blood cell DNA of (A) cancer-patients from Caucasian cohort and (B) cancer-patients from Korean cohort bearing different types of cancers. k-means clustering was employed to cluster the different types of cancer-patient DNAs according to their contents of correlation-based CNV-features using the kmean package in R. Since the number of correlation-based CNV-features was greater than two, the CLUSPLOT function 51 in the cluster package in R was used to reduce the dimensions of the data by PCA to produce the graphical output in terms of only the first two principal components. Different types of cancer-patients are indicated by color: colorectal cancers are represented by blue circles; glioma by green triangles; myeloma by red squares; gastric cancer by blue squares; and HCC by red triangles.
Three of the correlation-based CNV-features in Tables 1 and 2 belonged to genes included in Network of Cancer Genes. 47 Caucasian A50 was a CNV in the oncogene PIK3CA, a member of the family of lipid kinases capable of phosphorylating the 3′OH of inositol in phosphoinositides; these lipid kinases coordinate a diverse range of cell functions including proliferation, survival, vesicular traffic, and cell migration. 48 Korean D27 was a CNV in the oncogene ABL2, a non-receptor tyrosine-protein kinase that plays an important role in cell growth and survival, 49 and Korean A319 was a CNV in AKT2, a serine/threonine kinase that plays a role in cell survival, insulin signaling, angiogenesis, and tumor formation. 50
Prediction of predisposition to cancer
The results in Table 3 demonstrated that the correlation-, frequency-, and classifier-based CNV-features, selected through supervised machine learning employing labeled inputs in the form of constitutional recurrent CNVs from cancer-patients and control-subjects, could provide competent, albeit <100%, discrimination between the non-cancerous blood DNAs of cancer-patients and those of non-cancer controls. The necessary next step was to test whether such CNV-features selected from labeled inputs could make useful predictions on unseen, unlabeled input DNA samples. For this purpose, the combined cancer-patient and control DNA samples of the Caucasian or Korean cohort were randomly separated into a learning-band and a test band (see Methods). Correlation-based CNV-features were selected from the labeled learning-band, and employed to predict the risk factor R for each DNA sample in the unlabeled test band according to equation (1).
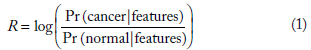
where Pr(cancer|features) is the posterior probability of membership in the cancer (viz. cancer prone) class given the CNV data of a test band sample; Pr(normal|features) is the posterior probability of membership in the normal (viz. non-cancer prone) class given the test CNV data; Pr(features|cancer) is the likelihood function of the test CNV data given membership in the cancer class; Pr(features|normal) is the likelihood function of the test CNV data given membership in the normal class; Pr(cancer) and Pr(normal) are the prior distributions of cancer and normal samples, respectively, within the learning-band.
On this basis, a test band sample being tested is predicted to be normal (viz. “non-cancer prone”) if R < 0, cancer (viz. “cancer prone”) if R < 0, or indeterminate if R = 0. Accordingly, for any cancer sample in the test band, a prediction of R < 0 would represent a “true” prediction, whereas a prediction of R < 0 would represent a “not true” prediction. On the other hand, for any normal sample in the test band, a prediction of R < 0 would represent a “not true” prediction, whereas a prediction of R < 0 would represent a “true” prediction. Therefore, in any trial run, the accuracy of prediction for the run would be given by the total number of “true” and “not true” predictions:
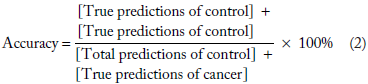
By repeating 1,000 times the random separation of samples into learning-band and test band 1, each time selecting CNV-features from the learning-band samples and using them to make predictions on all the test band samples, 1,000 accuracy estimates as well as their average accuracy were obtained. For each of the Caucasian and Korean cohorts, the 1,000 accuracy estimates obtained from the 1,000 repeat runs all exceeded 80%, yielding an average accuracy of 93.6% for the Caucasian cohort, and 86.5% for the Korean cohort (Fig. 6). These results confirmed the usefulness of extracting CN-features from the constitutional DNAs prepared from the normal blood cells of a learning-band of subjects with high and low cancer-predispositions, and employing these CN-features to make predictions on the individual level of cancer-predisposition among test subjects belonging to the same ethnic group.
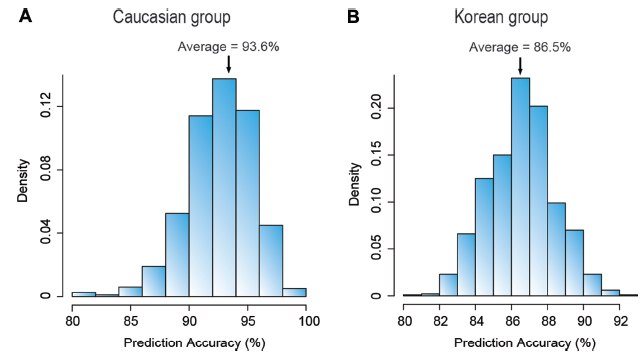
Prediction accuracies of cancer occurrence in (A) Caucasian and (B) Korean cohorts using correlation-based CNV-features. For each of the cohorts, the DNA samples were randomly separated into a learning-band and a test band. Correlation-based CNV-features were selected from the learning-band, and employed to predict the classification of each sample in the test band into the high or low cancer-predisposition classes according to equation (1) (see Methods). By repeating the random separation of samples into learning-band and test band 1,000 times, and each time making predictions on every sample in the test band, 1,000 accuracy estimates were obtained for each of the two cohorts. The minimal distribution of the 1,000 accuracy estimates obtained, and their average values are indicated on the graphs.
Discussion
When the recurrent constitutional CNVs in the non-cancerous white blood cells of cancer-patients and those of controls from both the Caucasian and Korean cohorts were analyzed, significant differences at the level of P < 0.0001 were found between cancer-patient and control DNAs with respect to the number of CN-losses and CNV size distributions (Figs. 2 and 3), pointing to the feasibility of distinguishing between high cancer-predisposition genomes and low cancer-predisposition genomes on the basis of their recurrent CNV-profiles. Application of machine learning to an analysis of their recurrent CNV-profiles confirmed the presence of CNV-features with biased-Can/Con ratios with P′ < 0.05 (Fig. 4), suggesting that they were preferentially enriched in either cancer-patient DNAs or control-subject DNAs. The finding of such a significant fraction of biased-Can/Con CNVs, amounting to >5% of total recurrent CNVs in the Caucasian or Korean samples, was a surprising one. The capability of these biased-Can/Con CNVs for extensively distinguishing between the DNAs of cancer-patients and control-subjects (Table 3), or making possible >85% accurate classification of unlabeled test DNAs into high and low cancer-predisposition classes (Fig. 6), was a straightforward consequence of their biased-Can/Con ratios. Interestingly, these biased-Can/Con CNVs could in fact be detected without machine learning, simply by plotting the occurrence frequencies of all the recurrent constitutional CNVs in cancer-patient and control-subject DNAs as in Figure 4, where these biased-Can/Con CNVs would be readily located outside or very close to the two P′ < 0.05 lines. Therefore, biased-Can/Con ratios were intrinsic properties of this fraction of recurrent CNVs. The advantages of machine learning resided in furnishing a systematic procedure for identifying such CNVs and facilitating their application to the prediction of cancer predisposition.
The basic principle of the CNV-feature based prediction method (Fig. 7) is that, by assembling a large learning-band of labeled DNAs from cancer-patients and control-subjects of the same ethnic group, and selecting distinguishing CNV-features from them, the members of this band can be ranked on either a numerical or percentile R-scale based on their R-scores as estimated by means of equation (1). This R-scale serves as a standard for this ethnic population, so that the R-score of any test subject from the same ethnic population estimated using the same set of distinguishing CNV-features selected from the learning-band will provide an indication of the test subject's relative predisposition to cancer. If the test subject's R-score is high on the scale, either within or close to the R-score zone containing a majority of the learning-band cancer-patient samples, his/her predicted predisposition to cancer will be high. On the other hand, if his/her R-score is well below the R-score zone containing a majority of the learning-band cancer-patient samples, his/her predicted predisposition to cancer will be low. An intermediate R-score will be indicative of an intermediate predisposition to cancer.
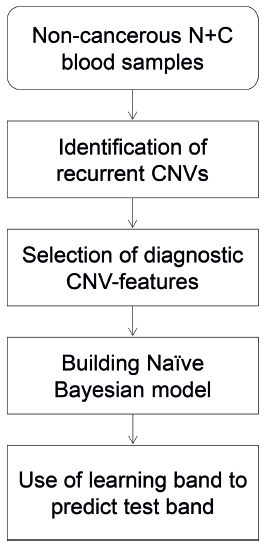
Schematic flow-chart of the use of recurrent CNVs for cancer prediction.
As a novel method for predicting cancer-predisposition, the use of biased-Can/Con recurrent CNVs is expectedly open to multiple refinements. Thus, although Affymetrix SNP 6.0 microarrays of non-tumor DNA prepared from blood were employed in the present study as the source of distinguishing CNV-features, other DNA platforms including whole genome sequencing and AluScans, 52 which can reduce the amount of sample DNA required, may also serve as source sequences for the selection of distinguishing CNV-features. Likewise, although three types of cancers were analyzed for each of the Caucasian and Korean cohorts in this study, the comparative advantages and disadvantages of employing either more or fewer cancer types to establish the R-scale yet remain to be defined with enlarged assemblies of cancer-patient and control-subject DNAs. The possibility that the use of more cancer types might be preferred for the detection of a generalized predisposition to different types of cancers, whereas use of fewer cancer types might be preferred when the aim is to define predisposition to a narrow range of cancers, deserves to be explored. As well, because the incidence of cancers typically increases with age, non-cancer subjects likely have to reach some minimum age before their DNAs can be meaningfully included in a learning-group representing DNAs of low cancer predisposition.
Conclusions
In the present study, the recurrent constitutional DNAs of cancer patients and non-cancer subjects were examined with the aim of selecting CNV-features by means of machine learning that can be applied to cancer prediction. In doing so, the CNV-features selected were found to display biased-Can/Con ratios indicative of markedly unequal occurrence frequencies among cancer-patient DNAs compared to non-cancer subject DNAs. These CNV-features have allowed an extensive discrimination between cancer-patient DNAs and non-cancer subject DNAs, and furthermore the high-accuracy prediction of the predisposition to cancer of unlabeled test subjects based on CNV-features selected from a mixed reference group of labeled DNAs consisting of cancer-patient DNAs and non-cancer subject DNAs.
The cancer biological implications of the existence of recurrent constitutional CNVs with biased Can/Con ratios represent a challenge to cancer research, for the causes for their biased Can/Con ratios are not well understood; among the CNV-features in Tables 1 and 2, only Caucasian A50 is known to be connected with oncogene PIK3CA, Korean D27 with oncogene ABL2, and Korean A319 with oncogene AKT2. In view of this, some of the CNV-features could be connected with potential oncogenes or tumor suppressor genes, or genes that take on oncogene or tumor suppressor roles when they act together in synergistic groups or networks. They might also include contextual genes that establish genomic contexts that enhances or abates tumorigenesis; such genomic contexts might also impact on wider aspects of cancer biology such as tumor progression, genomic stability, metastatic potential, tumor response to drugs, radiation, or immunotherapy, etc. In-depth investigations of the roles played by recurrent constitutional CNVs with biased-Can/Con ratios are clearly needed to advance not only the prediction but also the understanding of cancers.
The utility of machine learning in revealing relationships between recurrent constitutional CNVs and cancers demonstrated in the present study is potentially applicable to other human diseases with a significant genetic component. Hitherto, genome-wide association studies (GWAS) have focused above all on the disease associations of SNPs. However, on account of the large number of SNPs encountered in human genomes, a large sample size is needed for SNP-based GWAS to overcome the problem posed by multiple testing.53,54 In contrast, the number of recurrent constitutional CNVs is typically much lower. Accordingly, a smaller sample size could suffice for CNV-based GWAS, and the GWAS-identified CNVs also could be followed up more readily by thorough investigation to elucidate the roles they play in disease etiology.
Abbreviations
Can/Con, cancer frequency/control frequency; CBS, circular binary segmentation; CFS, correlation-based feature selection; CNVs, copy number variations; CN-gains, copy number gains; CN-losses, copy number losses; GWAS, genome-wide association studies; HCC, hepatocellular carcinoma; ROC, receiver-operating characteristic; ROC-AUC, area under the ROC curve, SNP, single-nucleotide polymorphism.
Author Contributions
HX, SYT, and XD initiated and conceived the study. XD, SYT, and SKN analyzed the data. SYT and HX wrote the paper. All authors reviewed and approved the final manuscript.
Supplementary Materials
Footnotes
Acknowledgments
We are grateful to Prof. J. Tze-Fei Wong for valuable discussion.