
Abstract
The detection of copy number variations (CNVs) on whole-exome sequencing (WES) represents a cost-effective technique for the study of genetic variants. This approach, however, has encountered an obstacle with high false-positive rates due to biases from exome sequencing capture kits and GC contents. Although plenty of CNV detection tools have been developed, they do not perform well with all types of CNVs. In addition, most tools lack features of genetic annotation, CNV visualization, and flexible installation, requiring users to put much effort into CNV interpretation. Here, we present “inCNV,” a web-based application that can accept multiple CNV-tool results, then integrate and prioritize them with user-friendly interfaces. This application helps users analyze the importance of called CNVs by generating CNV annotations from Ensembl, Database of Genomic Variants (DGV), ClinVar, and Online Mendelian Inheritance in Man (OMIM). Moreover, users can select and export CNVs of interest including their flanking sequences for primer design and experimental verification. We demonstrated how inCNV could help users filter and narrow down the called CNVs to a potentially novel CNV, a common CNV within a group of samples of the same disease, or a de novo CNV of a sample within the same family. Besides, we have provided in CNV as a docker image for ease of installation (https://github.com/saowwapark/inCNV).
Introduction
With the emergence of next-generation sequencing (NGS), the study of structural variants is now in great demand. Research on copy number variations (CNVs) is one of the major areas of genetics. In particular, the study of CNV on whole-exome sequencing (WES) is much more popular 1 and affordable 2 than the study on whole-genome sequencing (WGS). The study of CNVs on WES provides insights into human genome diversity and predisposition to diseases, 3 such as autism, 4 schizophrenia, 5 type-2 diabetes, 6 congenital heart disease (CHD), 7 non-syndromic hearing loss8,9 and inherited retinal degenerations, 10 among others. Nevertheless, issues with the accuracy and complexity of captured CNVs as well as their interpretation still exist.
To date, no CNV detection tools have been able to accurately detect all of the different types of CNVs. Although various tools have been developed, each of them is suitable for capturing different kinds of CNVs, and their accuracy overall remains insufficient.11-13 For example, the perfect usage of CONTRA 14 is to detect CNVs on tiny target regions, CNVnator 15 is used for all sizes of CNVs with high true-positive rates (TPR) but has variable false discovery rates (FDR), 16 and CODEX 17 is suitable for identifying rare CNVs.
Moreover, determining the significance of the identified CNVs is not straightforward. The output of CNV detection tools (e.g., CONTRA, CoNIFER, 17 and CNVnator), in general, is provided in text format and does not include genetic or clinical data annotations. Therefore, those tools require extensive efforts to interpret and prioritize the obtained CNVs. For instance, users need to compare all the positions of CNVs on their own and use any annotation tools to determine the genetic meaning of CNVs.
Furthermore, the tools used for CNV annotation and visualization have essential limitations. First, they cannot provide any graphical user interface (GUI). For example, GenVisR, 18 CNView, 19 and iCopyDAV 20 require users to write code themselves to achieve the desired results. Second, although tools such as DeAnnCNV 21 and Ginkgo 22 have GUIs, they still need to apply their pre-built algorithms to detect CNVs. For example, to take advantage of CNV annotation and visualization of DeAnnCNV, the tool has to apply its algorithm and cannot cooperate with others.
Besides, the installation of many CNV tools is complicated for users without programming skills. Several tools (e.g., GenVisR and CNView) need to be installed via the command line. Some other tools are available only on their websites; if developers stop hosting their CNV tools, users will lose access to them. Last, there is a problem with the version of annotation data, in terms of which versions they are or whether they can be updated.
To meet those challenges, we present inCNV, a standalone web-based application for integrating the CNV results from multiple detection tools or samples with user-friendly interfaces. It annotates and visualizes CNV results and allows users to query, filter, and sort captured CNVs. Furthermore, inCNV can prioritize the obtained CNVs to help users in several ways: (1) finding whether the identified CNVs have been reported and/or whether they are pathogenic based on the incorporated databases consisting of the Database of Genomic Variants (DGV), 23 ClinVar 24 and OMIM 25 ; (2) narrowing down candidates for de novo CNVs of a sample within the same family; (3) finding common CNVs across the samples having the same disease; (4) finding whether a sample has CNVs that may cause a specific disease. These features are highlighted in the present paper by analyzing ten samples from The Cancer Genome Atlas (TCGA). 26 Breast cancer genes (e.g., BRCA1, RAD51C and TP53, as reported by Zare et al. 11 ) were used to demonstrate how the CNVs of these genes can be systematically identified and visualized via inCNV. From the technical aspect, users can easily install in CNV on a desktop or a server by using Docker. Regarding the system maintenance, the public databases in inCNV are automatically updated via the data source API provided at https://github.com/saowwapark/inCNV-datasource.
Materials and methods
The overall architecture of inCNV (Figure 1) was divided into five main modules: (A) input data preparation; (B) management of built-in databases; (C) analysis configuration; (D) integrated CNV analyses; (E) exporting results.
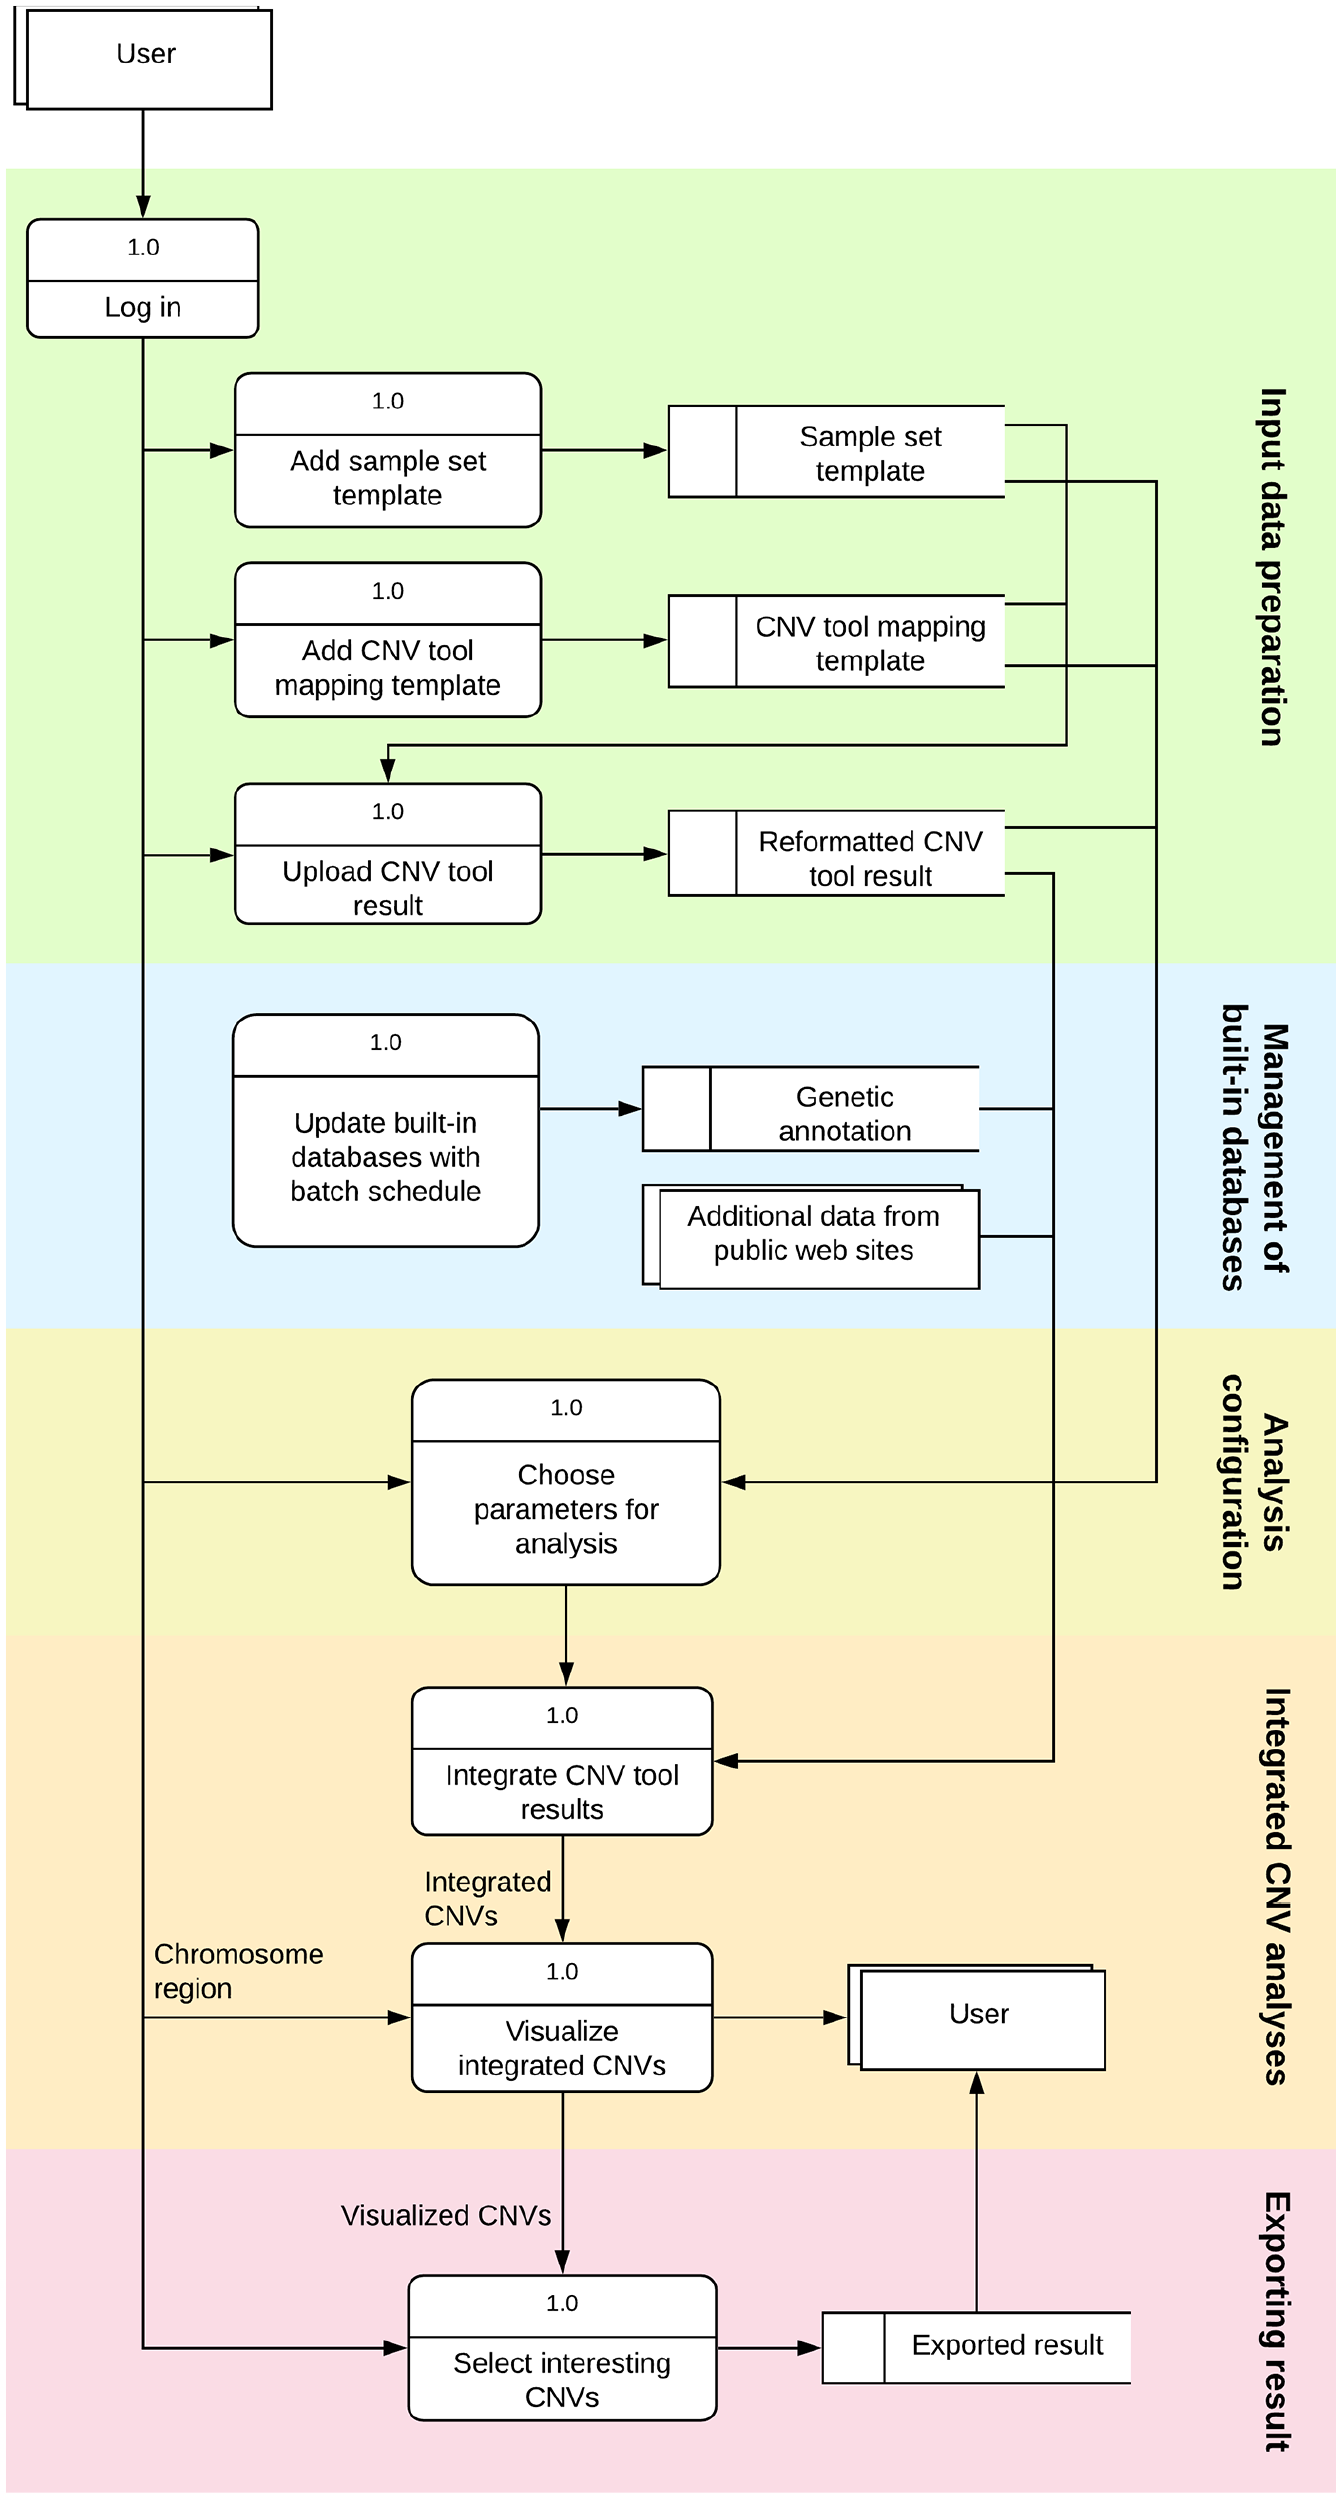
Overall architecture and workflow of inCNV: (1) input data preparation; (2) management of built-in databases; (3) analysis configuration; (4) integrated CNV analyses; (5) exporting results.
Input data preparation
inCNV provides users with a flexible upload component (Figure 2a). Users can upload CNV results from any CNV detection tool that matches a template predefined by the “CNV tool mapping” and “sample set” components. It is worth noting that users can also add new templates. The “CNV tool mapping” component (Figure 2b) allows users to define input file formats, which are used to map onto the CNV results generated from any CNV detection tools. In other words, inCNV can interpret CNV result files from any tools (see information on “input data preparation” at https://github.com/saowwapark/inCNV). The “sample set” component (Figure 2c) allows users to define a group of samples of CNV results they plan to upload into the system. With this component, users can define a name, a description, and sample names of the sample set. Moreover, inCNV provides a login process that allows users to analyze their files at ease without the need to upload them again. Also, users can delete their uploaded files anytime.

Input data preparation includes (a) an upload file component, (b) a CNV tool mapping component, (c) a sample set component.
Management of built-in databases
We acquired biological data from many sources in order to attach biological significance to the captured CNVs. These data were reformatted and linked together for CNV annotations. We used them to align and visualize the given CNVs in the analysis result page. in CNV obtained data related to annotations from two sources: (1) public databases pre-built into the system; (2) additional data linked to external websites. The public databases included the DGV database released on 25-Feb-2020 for both GRCh37 and GRCh38, the ClinVar database released on 17-Mar-2020 for both GRCh37 and GRCh38, the Ensembl database with release 87 of GRCh37, and release 99 of GRCh38, as well as human reference genomes obtained from UCSC 27 released on 17-Jan-2020 for GRCh37 and 10-Aug-2018 for GRCh38. The DGV was used as the primary reference to known CNVs. All variants from DGV with the type of CNV were extracted and collected into the inCNV database. Furthermore, we incorporated clinical variants with OMIM from ClinVar and gene symbols from Ensembl and HUGO Gene Nomenclature Committee at the European Bioinformatics Institute (HGNC) 28 into the inCNV database. Human reference genomes were used to identify the flanking regions of a given CNV. To give users more details about how detected CNVs are related to DGV, ClinVar, and Ensembl, in CNV also provided the uniform resource locator (URL) linking to their websites.
Analysis configuration
An analysis configuration module provides the process of choosing CNV results for the next procedure, “integrated CNV analyses.” The configuration module is divided into two submodules:
(1) the configuration of individual-sampled analysis showing the integration of CNV results of one sample from numerous CNV detection tools.
(2) the configuration of multiple-sampled analysis showing the integration of CNV results of many samples from a single CNV detection tool.
In both submodules, users filter the CNV results by a reference genome, a sample set, and a sample name. Then, users choose the results they want to integrate and specify a CNV type and a chromosome they want to see details (Figure 3).

Main screen for the analysis configuration of individual-sampled analysis.
Integrated CNV analyses
inCNV provides two main analyses: (1) individual-sampled analysis; (2) multiple-sampled analysis. Both of them have similar features but are suitable for different use cases (details on their usage are provided in the “results and discussion” section).
The overall features of this module can be categorized into four components: (1) overview configuration; (2) overview chart; (3) all merged CNVs; (4) main chart;
Overview configuration
This component shows the summary information from the “analysis configuration” module, for example, a selected reference genome, a sample name, a chromosome, a CNV type, and file names of uploaded CNV results etc (Supplemental Figure S1).
Overview chart
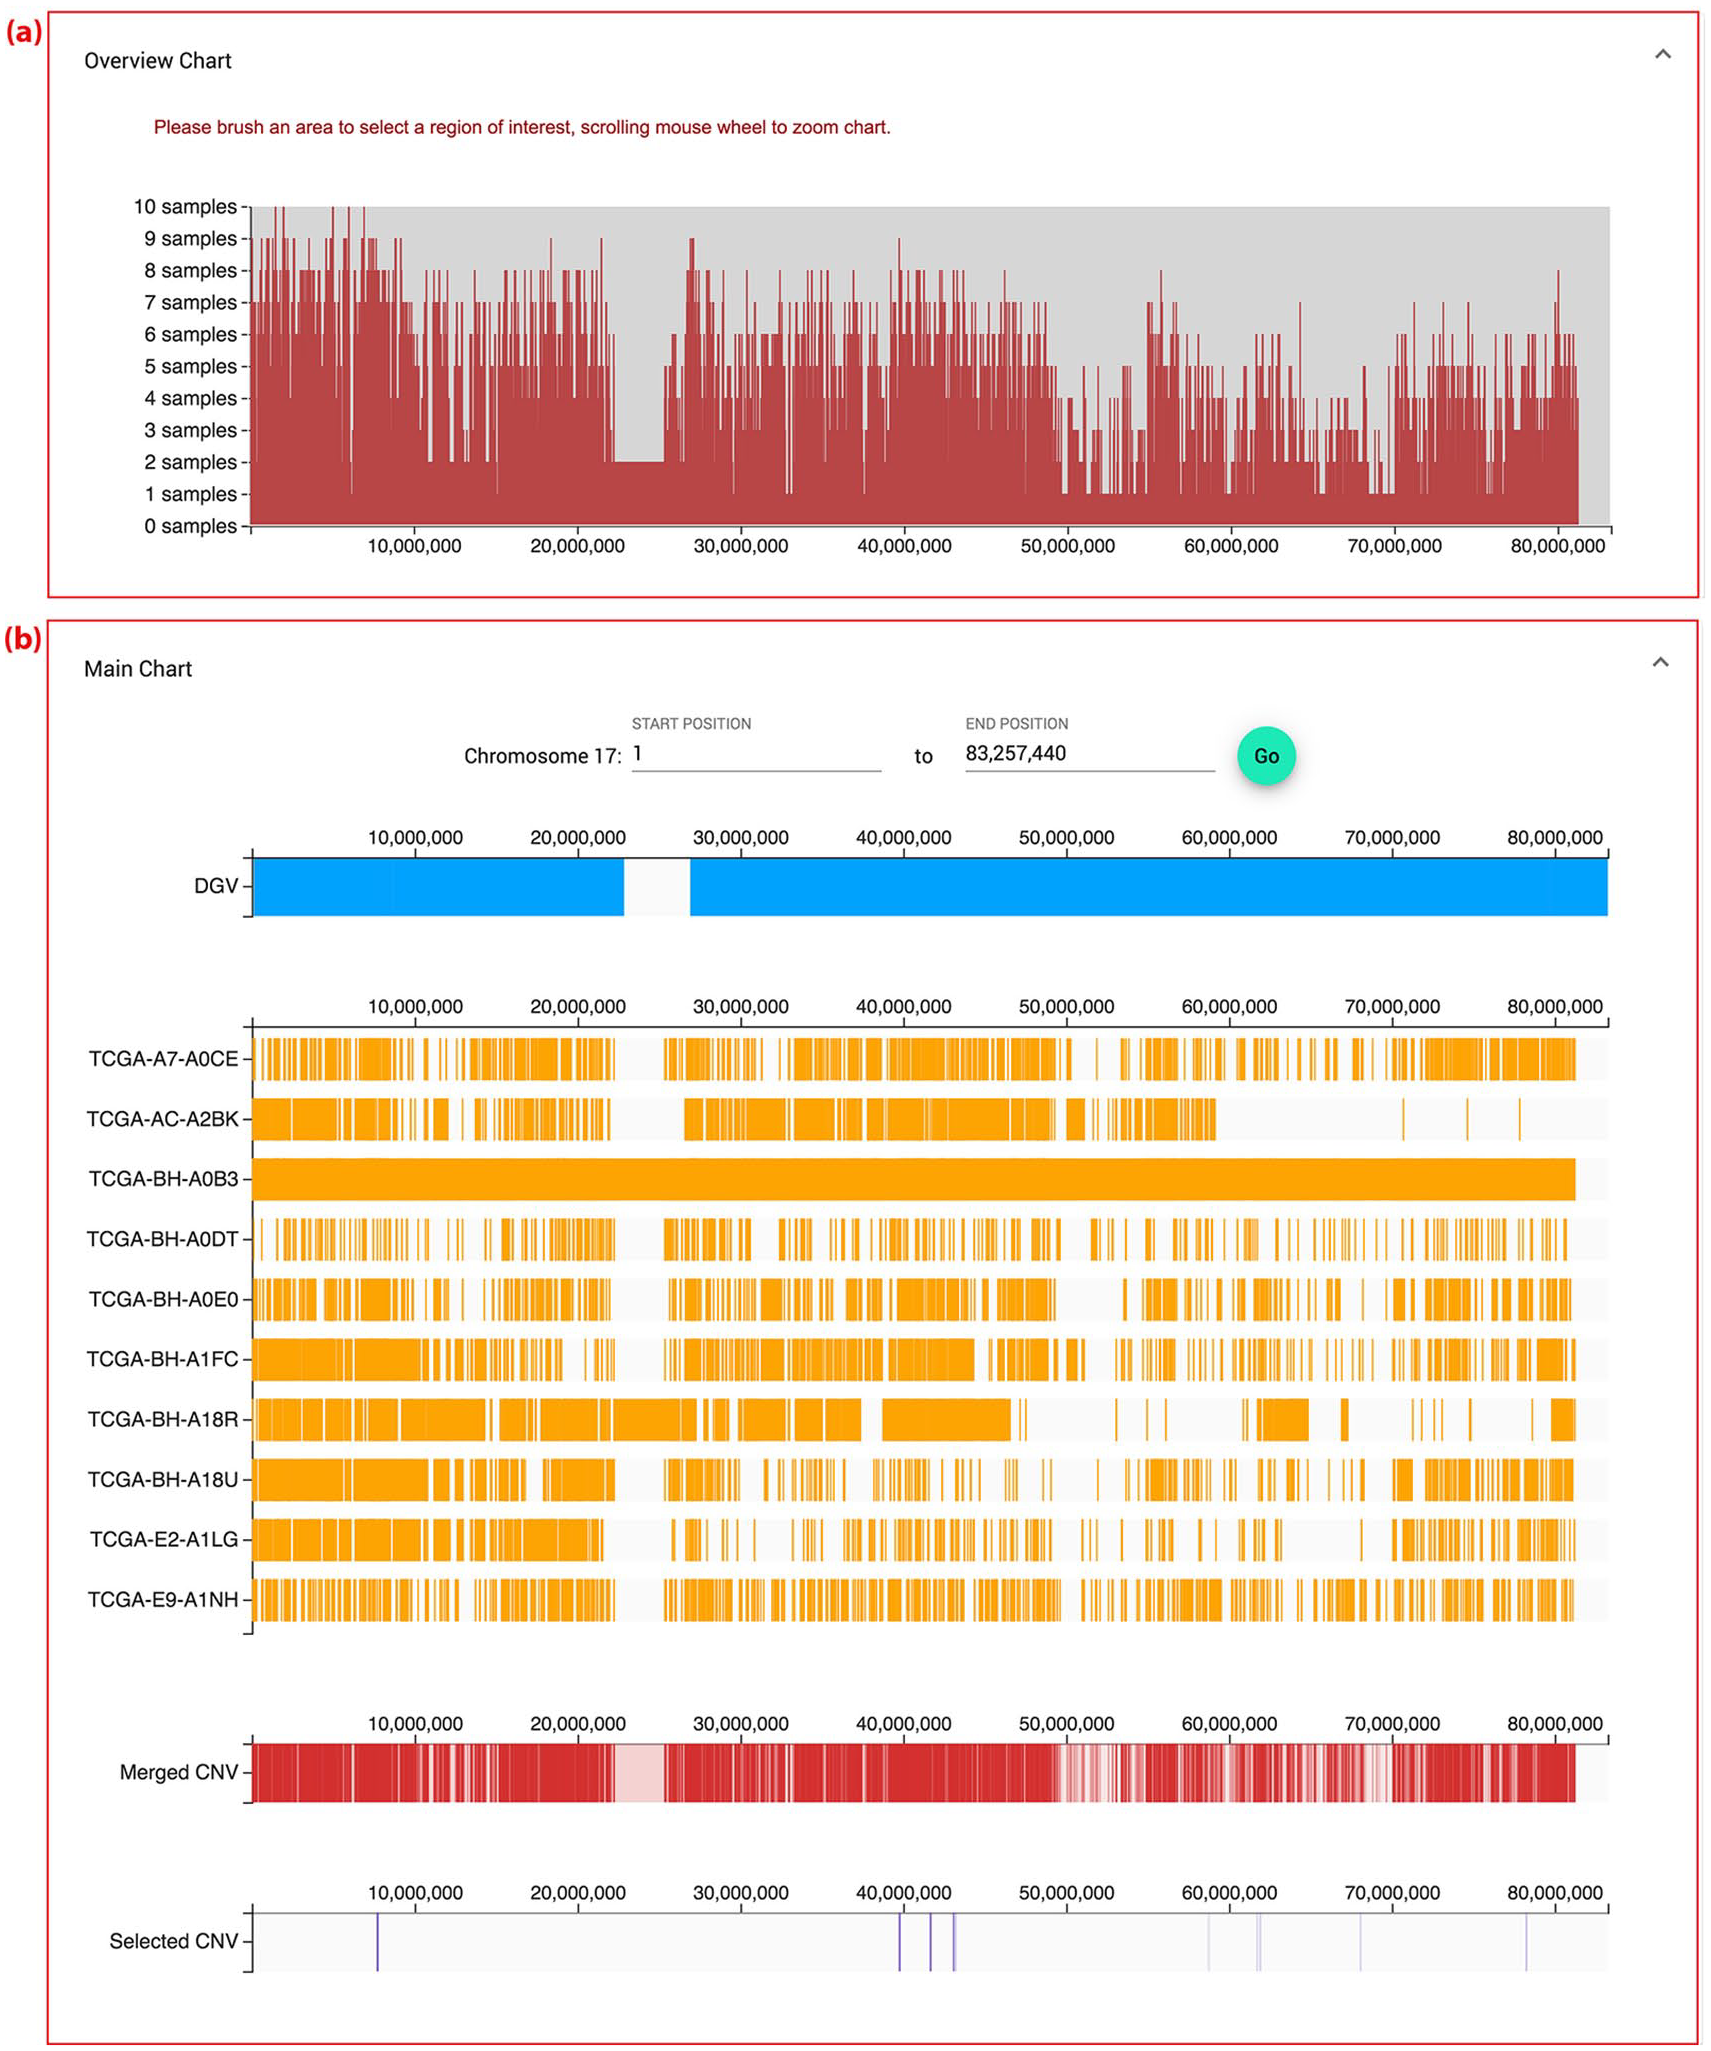
The overview chart of inCNV illustrates the distribution of CNVs along a chromosome (Figure 4a). This chart displays the integrated result of CNVs in a broader view with a particular type of CNVs namely, duplication or deletion. The x-axis represents the base positions on a chromosome, and the y-axis signifies the number of overlapping CNVs. It is important to note that the y-axis of individual-sampled analysis indicates the overlap of CNV detection tools, but the y-axis of multiple-sampled analysis shows the overlap of samples. Moreover, this chart allows users to scroll the mouse wheel to zoom in and out along the chromosome and highlight an area to select a region of interest. The details of the selected region are provided in the “Main Chart” component (Figure 4b).

Visualization of individual-sampled analysis after integrating CNV tool results from multiple CNV detection tools: ADTEx, cn.MOPS, CONTRA, ExomeCNV and VarScan2 on chromosome 17 with deletion-typed CNV. (a) Overview chart—the distribution of overlapping CNVs along a chromosome from multiple CNV detection tools. (b) Main chart. (b1) Regional selection on a chromosome—users can select the range along the chromosome to see CNVs in charts. (b2) DGV chart depicting the CNV positions of DGV along the chromosome region. (b3) A group of inputted-CNV charts—each chart represents the results of each CNV detection tool. (b4) Merged CNV chart providing integrated CNV tool results. (b5) Selected CNV chart showing the selected CNVs. (b6) Region of interesting CNVs—CNVs that are agreed by the largest number of CNV detection tools but some part of them does not match with the DGV chart.
All merged CNVs
This component displays all CNVs integrated from the uploaded CNV result file(s) of multiple tools or samples, in a table form. Users can filter the results and see the details of the integrated CNVs via: (a) the filtering component; (b) the detailed table component (as described below).
Filtering component
Regarding “individual-sampled analysis,” users can filter the integrated CNVs with gene symbols from Ensembl, variant accession from DGV, OMIM and phenotypes from ClinVar as well as filtering by CNV detection tools (Figure 5a and Supplemental Figure S2). As regards “multiple-sampled analysis,” users can filter the integrated CNVs with the same attributes except for the CNV detection tool, replaced with the sample name.

“All Merged CNVs” of individual-sampled analysis. This shows the details of all CNVs integrated from multiple CNV tools (ADTEx, cn.MOPS, CONTRA, ExomeCNV, and VarScan2) on chromosome 17 with deletion-typed CNV and after searching for CNVs covering a region of breast cancer genes (BIRC5, BRCA1, BRIP1, ERBB2, GRB7, KPNA2, KRT17, RAD51C, or TP53). (a) Expandable searching component. (b) A detailed table. (b1) An CNV with the greatest number of overlapping tools. (b2) An expanded row showing annotation data of captured CNVs, including related genes from Ensembl, reported CNVs from DGV and clinical-related CNVs from ClinVar.
Detailed table component
This component is the table in “All Merged CNVs” (Figure 5b). The table represents all information on the integrated CNVs. The information can be expanded by clicking on a particular row, consisting of annotations from DGV, Ensembl, and ClinVar, as well as flanking sequences. Users can click on any icon of these annotation sources to see more details linked to external data via the Internet. Furthermore, users can click on the table header to sort the results by such columns as start position, end position, and the number of overlapping tools (for individual-sampled analysis) or the number of overlapping samples (for multiple-sampled analysis).
Main chart
The purpose of the “Main chart” component is to visualize CNV details, allowing users to explore and manage identified CNVs at ease. This component comprises two parts: (1) regional selection on a chromosome (Figure 4b1) and (2) visualized charts (Figure 4b2–b5). The regional selection part allows users to specify their chromosome region of interest. The visualized charts consist of a “DGV” chart, a group of inputted-CNV charts, a “Merged CNVs” chart, and a “Selected CNVs” chart. Their x-axes represent base positions of a chromosome; moreover, regions of x-axes vary, depending on a highlight in the “Overview Chart,” selected CNVs in the “All Merged CNVs” table, or base positions in the regional selection part.
The DGV chart represents the location of CNVs based on the DGV database acquiring five CNV types: “duplication,” “deletion,” “gain,” “loss,” and “gain+loss” (Figure 4b2). Users can view the DGV information namely chromosome name, variant name, variant type, and variant subtype by hovering their mouse over the chart.
The inputted-CNV charts show the CNV results of each CNV detection tool or sample (Figure 4b3). Regarding individual-sampled analysis, the y-axis expresses the CNV tool names; in contrast, with multiple-sampled analysis, the y-axis represents the sample names. Users can hover their mouse over the inputted-CNV charts to view the corresponding base positions on a chromosome. By clicking on them, users can see an inputted-CNV dialog (Supplemental Figure S3) containing the CNV annotations, namely Ensembl, DGV, and ClinVar, as well as the flanking regions of the CNV.
The “Merged CNVs” chart visualize the integrated CNV results with a heatmap corresponding to the selected region (Figure 4b4). The heatmap uses color to indicate the overlap of CNV detection tools or samples; the more intense the color is, the more possible the CNVs becomes. However, intense color may represent a false positive depending on the algorithms of CNV detection tools. As a result, to effectively identify CNVs, users need to be aware of the characteristics of CNV detection tools suitable for different kinds of CNVs. Hovering or clicking on the “Merged CNVs” chart gives the same information as doing on the inputted-CNV chart except for having more information, namely the “overlapping CNV tools” element (for individual-sampled analysis) or the “overlapping sample names” element (for multiple-sampled analysis) and a “select CNV” checkbox element (see Supplemental Figure S4). Users can easily select the merged CNV by checking the checkbox. After that, the selected CNV will be shown in the “Selected CNVs” chart and the “All Selected CNVs” table, described as part of the “Exporting results” module.
The “Selected CNVs” chart represents the selected CNV regions (Figure 4b5). Hovering and clicking on a bar within this chart will provide the same information as doing on the “Merged CNVs” chart (Supplemental Figure S5).
Exporting results
This module collects the selected CNVs into the “All Selected CNVs” table and exports them into a tab-delimited text file (Supplemental Figure S6). Users can select or unselect a CNV into or from the “All Selected CNVs” table via such a few components as the “All Merged CNVs” table, the “Merged CNVs” chart, and the “Selected CNVs” chart, as described previously.
Implementation
inCNV was designed as a three-layer architecture comprised of (1) frontend, (2) backend, and (3) database. The frontend was developed by the Angular framework (version 9.0.0). With respect to UIs, inCNV used the Angular material UI component library (version 9.0.0) and d3.js library (version 5.14.2). The current version of inCNV supports Chrome, Opera, and Safari browsers.
We used Node.js with Typescript and Express framework for backend development. The backend incorporated the indexedfasta-js package (version 1.0.12) from JBrowse 29 to read FASTA file format. Besides, we used MySql as our database management system (DBMS). We also provided inCNV as a docker image, which can be cloned from https://github.com/saowwapark/inCNV and installed on any host with a Docker engine. The installed inCNV on a localhost will then automatically send a request to retrieve the data sources provided at https://github.com/saowwapark/inCNV-datasource in order to configure the initial database and other data sources of the system. Detailed steps for the installation can be found on our git repository.
Data sets
To demonstrate the usage of inCNV, we used CNV data provided by Zare et al 11 The data stemmed from running several CNV detection tools, namely ADTEx, 30 cn.MOPS, 31 CONTRA, ExomeCNV, 32 and VarScan2 33 against the WES of ten breast cancer patients in a BRCA project obtained from The Cancer Genome Atlas (TCGA). 26
According to Zare et al 11 the result files from ADTEx, cn.MOPS, and ExomeCNV described the types of CNVs with standard numbers. The numbers “1,” “2,” and “3” represented a CNV deletion, no CNV (normal), and CNV duplication respectively, and numbers higher than “3” expressed amplification. For our datasets, we used the number “1” to denote CNV deletion and “3” or above to denote CNV duplication.
The result files from CONTRA and VarScan2 represented the CNV types in log2 ratio. Zare et al 11 used the thresholds of ±0.2 for the classification of CNV types. Therefore, to be consistent with Zare et al,11 in our data sets we used log2 ratio > +0.2 as the criteria for CNV duplication and log2 ratio < ‒0.2 as the criteria for CNV deletion.
We modified the results files from Zare et al 11 before uploading them into inCNV: (1) Filter out unnecessary data for inCNV analysis; (2) Reformat the remaining data to match with CNV tool templates, predefined by using the “CNV tool mapping” component of the input data preparation module. The modified files were provided as “demo data” at https://github.com/saowwapark/inCNV/tree/master/demo-data.
Results and discussion
inCNV provides three types of analyses: (A) individual-sampled analysis; (B) multiple-sampled analysis; (C) combined-processed analysis.
Individual-sampled analysis
The individual-sampled analysis focuses on the intersection filtering of integrated CNVs from numerous CNV detection tools on one sample. To demonstrate this type of analysis, we followed the steps: (1) Integrate the CNV results of the TCGA-BH-A0E0 sample from five tools, namely ADTEx, cn.MOPS, CONTRA, ExomeCNV, and VarScan2 with the deletion type of CNV on chromosome 17 (see the “analysis configuration” module); (2) Filter the results with breast cancer genes on chromosome 17, namely BIRC5, BRCA1, BRIP1, ERBB2, GRB7, KPNA2, KRT17, RAD51C, and TP53; 34 (3) Sort the results by the overlapping numbers. As a consequence, thirteen CNVs overlapped between those CNV detection tools (Figure 5): Five CNVs overlapped across four tools; seven CNVs were common among three tools; one CNV overlapped across two tools. This proved that inCNV could integrate, filter, and prioritize the CNVs with multiple algorithms from several CNV detection tools at ease. Moreover, there was an interesting case in which inCNV found the overlapping CNVs in agreement with several tools but not matching with DGV as shown in Figure 4b6. This case allowed users to narrow the scope of the identification of novel CNVs. Furthermore, inCNV provides a feature of CNV flanking region extraction. This feature can extract the left and right flanking sequences of a CNV, supporting biologists to use them for primer design.
Multiple-sampled analysis
The multiple-sampled analysis focuses on intersection filtering from the integrated CNV results of multiple samples identified by one CNV detection tool. To demonstrate this type of analysis, we used the CNV results obtained from CONTRA of ten breast cancer samples. Based on the integrated CNV results by inCNV, we searched for CNVs that were only related to cancer genes like the way we did in the individual-sampled analysis. As a result, we found fourteen CNVs within or covering the region of the breast cancer genes (BIRC5, BRCA1, BRIP1, ERBB2, GRB7, KPNA2, KRT17, RAD51C, and TP53). One CNV overlapped across the seven samples. Three CNVs were common among six samples. Two CNVs overlapped across five samples, and four CNVs overlapped across three samples. These results indicated that inCNV helped determine the relationship between samples of the same disease (Figure 6 and Supplementary Figure S7). Also, inCNV can be used in several other cases. For example, inCNV can be used to find de novo CNVs of a sample within the same family.4,35 To this end, users can filter out common or known CNVs and explore whether the remaining CNVs of the proband are different from their parents. Moreover, we can use inCNV to determine whether the sample has potential to develop a specific disease by the following steps: (1) Integrate the CNVs of the sample of interest with the CNVs of a sample set of the same disease; (2) Search for genes that are specifically related to the disease; (3) Search for the sample of interest; (4) Sort the results by the number of overlapping samples. Accordingly, if there are numerous remaining CNVs with a high frequency of overlapping, the sample of interest is prone to the disease. This determination, however, requires further experimental confirmation via wet labs.
Visualization of multiple-sampled analysis after integrating the CNV results of ten samples of breast cancer called with CONTRA on chromosome 17 with the deletion-typed CNV. (a) Overview chart as described for the multiple-sampled analysis. (b) Main chart with a group of inputted-CNV charts, each of which represents the CNV results of each sample.
Combined-processed analysis
Users can combine the results of individual-sampled and multiple-sampled analyses to identify the interesting CNV. For example, users can apply multiple-sampled analysis to find a patient who is at risk of developing a disease. Then, to prioritize CNVs with multiple algorithms, users can use individual-sampled analysis with the integration of CNV detection tools to validate the final result before conducting wet-lab experiments.
Minimum system requirement
The current version of inCNV only supports real-time processing. The response time of the server with 4 CPU cores of Intel® Xeon® Gold 6140 CPU @ 2.30 GHz for multiple-sampled analysis of ten samples as described above, was about 28 seconds using 2.232 GB of RAM. From the user’s perspective, based on a MacBook Pro, Dual-Core Intel Core i5 using the Opera web browser, the time and memory used to render the results were ~1 seconds with 188 MB of RAM. In regard to the multiple-sampled analysis of one hundred samples, the response time of the same server was 458 seconds with 4.495 GB of RAM, while the web browser on the user side required 8 seconds and 1 GB of RAM to render all of the results. Since the current version of inCNV only supports real-time processing, we recommend installing inCNV on a server with at least 4 CPU cores and 8 GB of RAM for good user experience. We plan to also allow for analysis via batch processing in future versions.
Conclusion
The results presented here demonstrate that inCNV can integrate CNV results from several CNV detection tools to identify CNVs with more coverage for all types of CNVs; however, the correction depends on the algorithms of the chosen CNV detection tools. Besides, inCNV can help users filter, prioritize, select, annotate, and interpret potential CNVs for further wet-lab experiments with much less effort. To be sustainable, we have made re-formatted annotation data public so that users can see the provided online data and its released versions, and inCNV can automatically update the genome annotation data from our online resources. Moreover, inCNV is suitable for users who lack knowledge of programming as it can be installed via a docker, and users can easily run it with graphical user interfaces (GUIs). Finally, inCNV can also be used for whole genome sequencing (WGS) by following the same steps described in this paper.
Supplemental Material
SupplementaryFigureS1_xyz43797f5286c20 – Supplemental material for inCNV: An Integrated Analysis Tool for Copy Number Variation on Whole Exome Sequencing
Supplemental material, SupplementaryFigureS1_xyz43797f5286c20 for inCNV: An Integrated Analysis Tool for Copy Number Variation on Whole Exome Sequencing by Saowwapark Chanwigoon, Sakkayaphab Piwluang and Duangdao Wichadakul in Evolutionary Bioinformatics
Supplemental Material
SupplementaryFigureS2_xyz437979e461416 – Supplemental material for inCNV: An Integrated Analysis Tool for Copy Number Variation on Whole Exome Sequencing
Supplemental material, SupplementaryFigureS2_xyz437979e461416 for inCNV: An Integrated Analysis Tool for Copy Number Variation on Whole Exome Sequencing by Saowwapark Chanwigoon, Sakkayaphab Piwluang and Duangdao Wichadakul in Evolutionary Bioinformatics
Supplemental Material
SupplementaryFigureS3_xyz437970ab82d0a – Supplemental material for inCNV: An Integrated Analysis Tool for Copy Number Variation on Whole Exome Sequencing
Supplemental material, SupplementaryFigureS3_xyz437970ab82d0a for inCNV: An Integrated Analysis Tool for Copy Number Variation on Whole Exome Sequencing by Saowwapark Chanwigoon, Sakkayaphab Piwluang and Duangdao Wichadakul in Evolutionary Bioinformatics
Supplemental Material
SupplementaryFigureS4_xyz4379737abbccb – Supplemental material for inCNV: An Integrated Analysis Tool for Copy Number Variation on Whole Exome Sequencing
Supplemental material, SupplementaryFigureS4_xyz4379737abbccb for inCNV: An Integrated Analysis Tool for Copy Number Variation on Whole Exome Sequencing by Saowwapark Chanwigoon, Sakkayaphab Piwluang and Duangdao Wichadakul in Evolutionary Bioinformatics
Supplemental Material
SupplementaryFigureS5_xyz437978492ac1e – Supplemental material for inCNV: An Integrated Analysis Tool for Copy Number Variation on Whole Exome Sequencing
Supplemental material, SupplementaryFigureS5_xyz437978492ac1e for inCNV: An Integrated Analysis Tool for Copy Number Variation on Whole Exome Sequencing by Saowwapark Chanwigoon, Sakkayaphab Piwluang and Duangdao Wichadakul in Evolutionary Bioinformatics
Supplemental Material
SupplementaryFigureS6_xyz437973680e2a4 – Supplemental material for inCNV: An Integrated Analysis Tool for Copy Number Variation on Whole Exome Sequencing
Supplemental material, SupplementaryFigureS6_xyz437973680e2a4 for inCNV: An Integrated Analysis Tool for Copy Number Variation on Whole Exome Sequencing by Saowwapark Chanwigoon, Sakkayaphab Piwluang and Duangdao Wichadakul in Evolutionary Bioinformatics
Supplemental Material
SupplementaryFigureS7_xyz4379755012068 – Supplemental material for inCNV: An Integrated Analysis Tool for Copy Number Variation on Whole Exome Sequencing
Supplemental material, SupplementaryFigureS7_xyz4379755012068 for inCNV: An Integrated Analysis Tool for Copy Number Variation on Whole Exome Sequencing by Saowwapark Chanwigoon, Sakkayaphab Piwluang and Duangdao Wichadakul in Evolutionary Bioinformatics
Footnotes
Acknowledgements
The authors would like to thank Natsuda Navamajiti for inspiring the key concept of this study on integrating CNV results by focusing on ease of understanding, rather than merely providing genetic information that is hard to interpret.
Funding:
The author(s) disclosed receipt of the following financial support for the research, authorship, and/or publication of this article: This work has been partially supported by the Chulalongkorn Academic Advancement into its 2nd Century (CUAASC) Project and by the Ratchadaphiseksomphot Endowment Fund Part of the “Research Grant for New Scholar CU Researcher’s Project” (RGN_2559_025_06_21).
Declaration of conflicting interests:
The author(s) declared no potential conflicts of interest with respect to the research, authorship, and/or publication of this article.
Author Contributions
DW and SC conceptualized the manuscript. SC investigated the manuscript. SC methodologized the manuscript. SC implemented the software for this manuscript. SP provided technical support for this manuscript. Updated data sources designed by SP and implemented by SC. SP provided docker for installation. DW supervised the manuscript. SC drafted the original manuscript. DW wrote, reviewed and edited the manuscript.
Supplemental material
Supplemental material for this article is available online.
References
Supplementary Material
Please find the following supplemental material available below.
For Open Access articles published under a Creative Commons License, all supplemental material carries the same license as the article it is associated with.
For non-Open Access articles published, all supplemental material carries a non-exclusive license, and permission requests for re-use of supplemental material or any part of supplemental material shall be sent directly to the copyright owner as specified in the copyright notice associated with the article.