
Abstract
A total of 1,263 adults from Newfoundland and Labrador were studied in the research. Body mass index (BMI) and percent trunk fat (PTF) were analyzed as biomarkers for obesity. The Mendelian randomization (MR) approach with two single-nucleotide polymorphisms in the fat-mass and obesity (FTO) gene as instruments was employed to assess the causal effect. In both genders, increasing physical activity significantly reduced BMI and PTF when adjusted for age and the FTO gene. The effect of physical activity was stronger on PTF than BMI. Direct observational analyses showed significant increase in BMI/PTF when physical activity decreased. A similar association in MR analyses was not significant. The association between physical activity and BMI/PTF could be due to reversed causality or common confounding factors. Our study provides insights into the causal contributions of obesity to physical activity in adults. Health intervention strategies to increase physical activity among adults should include some other plans such as improving diet for reducing obesity.
Keywords
Introduction
There is worldwide acceptance among medical authorities that physical activity is an important element of healthy living.1–3 Conversely, physical inactivity is increasingly being viewed as one of the most serious causal factors for public health problems in developed countries today. 4 The World Health Organization (WHO) estimates that 3.3 million people die around the world each year due to physical inactivity, making it the fourth leading underlying cause of mortality. 5 It is confirmed that seven chronic diseases have been consistently associated with physical inactivity: coronary heart disease, hypertension, stroke, colon cancer, breast cancer, type 2 diabetes, and osteoporosis.6–9
“A 10% reduction in the prevalence of physical inactivity” in Newfoundland and Labrador (NL) “can potentially reduce $150 million annually in direct health care costs. In 2009, 55% of females and 56% of males in Eastern Health Region reported being physically inactive during leisure time. There has been increase in inactivity for both genders between 2003 and 2011” (Health Promotion Strategic Framework 2012–17; Eastern Health).
Katzmarzyk and Janssen in 2004 reported physical inactivity and obesity as the two of the greatest threats to public health in Canada. 9 Data from the 2012 Canadian Census show that 61.9% of Canadian adults are overweight or obese, which is of great concern. Moreover, NL has had the highest percentage of overweight/obese residents in Canada since 2008 with 63.2% adults reported being overweight or obese that year. In 2013, 30% of residents of NL were obese, showing a significant increase since 2003 (Newfoundland and Labrador Centre for Health Information, September 2014). According to a recent study, 10 by 2019 an estimated 71% of the adult population in NL will be overweight or obese.
Physically inactive people are also more likely to be obese (BMI ≥ 30 kg/m2), which is itself an important risk factor for many chronic diseases including coronary artery disease, stroke, hypertension, diabetes, and cancer. 11 A large number of epidemiological studies have focused on examining the relationship between physical activity levels and obesity. Several studies suggest that high physical activity is beneficial in reducing central (abdominal) obesity.12–15 However, there is no current study, which confirms that levels of physical activity are a causal effect of obesity in this province. The purpose of this study was to find answers to the following causality questions:
Does (abdominal) obesity causally influence inactivity in NL?
Is the well-known association between physical activity and obesity a “reversed causality” or due to common “confounding factors?”
Findings from this study will be informative for those of us targeting obesity as one of the efforts to increase levels of physical activity in NL, or promote other solutions, such as maintenance of diet.
Materials and Methods
Subjects
All data used were taken from the CODING (
Baseline descriptive characteristics of the study population stratified by gender.

Anthropometric and body composition measurements
Anthropometric, body composition, and biochemical measurements were performed following a 12-hour fasting period. Height (nearest 0.1 cm) and weight (nearest 0.1 kg) measurements were collected and BMI was calculated. BMI was defined as weight divided by height squared (kg/m2). Obesity status has been grouped as normal weight (BMI 18.50–24.99), overweight (BMI 25.00–29.99), and obese (BMI ≥ 30 kg/m2) as recommended by the WHO. Percent trunk fat (PTF) was measured utilizing dual-energy X-ray absorptiometry (DXA; Lunar Prodigy, GE Medical Systems, Madison, WI, USA). DXA produces a measurement of adipose tissue in the body with a low margin of error. The enCORE software package (version 12.2, GE Medical Systems, Madison, WI, USA) was used for DXA data acquisition.
Physical activity
Levels of physical activity were measured using the Ability of the Atherosclerosis Risk in Communities (ARIC) questionnaire, 16 which consists of a Work Index, Sports Index, and Leisure Time Activity Index. A variable excluding workplace activity was used in the data analysis.
Genotyping
Genotyping was completed using a blood sample drawn from each individual. Genotyping of 11 SNPs–-rs9939609, rs1421085, rs1121980, rs7193144, rs8050136, rs9939973, rs16945088, rsl7817449, rs3751812, rs9935401, and rs9941349 from the fat-mass and obesity-associated (FTO) gene–-was performed using the high-throughput MassARRAY® platform (Sequenom Inc, San Diego, CA, USA). Genotypes were assessed using MassARRAY® Typer Analyzer version 4.0. SNP genotyping success rate was over 99%.
Measuring (central) abdominal obesity
In this study, we considered PTF as a measurement for central (abdominal) obesity and BMI as a measurement for general obesity. BMI as the standard way of measuring overweight and obesity reflects total body fat without considering the distribution of fat. PTF, which for this study was measured by DXA, is more closely associated with obesity-related detrimental effects on health. 17 , 18
Causality
When compared to randomized experiments, concluding causal effects under observational studies for the issue of confounding factors are considered to be inadequate. Causal inference from observational data revolves around the crucial assumption that some component of the observational study happened by chance or that the predictor of treatment referred to as an instrumental variable was randomly assigned. 19
Using variation in genes as instrumental variables, Mendelian randomization provides an alternative way of dealing with the problems of confounding factors in observational studies; 20 these factors are believed to be present but cannot be controlled for because they are not fully understood. 21 Mendelian randomization can be used to assess whether central obesity causally affects physical activity.
Statistical analysis
For the basic characteristics of the CODING study participants, the mean and standard deviation of all continuous variables as well as the proportion of individuals within each categorical variable were calculated. Data were analyzed using R version 3.0.0 GUI.
For all model assessments, the raw (unstandardized) variables were used, as both F-statistic and P-values are insensitive to standardizing variables. However, for comparing the magnitude of the effects (BMI versus PTF, or the two SNPs of the FTO gene), variables were standardized.
Direct association studies between the obesity-related measurements (PTF/BMI) and physical activity were conducted using multiple linear regression analysis adjusted for age. Analysis of variance technique was applied for further analysis to adjust for potentially confounding factors between obesity and physical activity. Among the factors associated with obesity in adults as found in some studies,22–24 the following factors were available in the CODING study: gender, age, smoking status, physical activity score, diabetic status, maternal BMI, drinking status, (prescribed) medical status and eight dietary intake variables.
The Mendelian randomization technique requires that the factors that may potentially confound the association between abdominal obesity and physical activity be independent of the instrumental variable (FTO gene). This assumption was therefore examined by analyzing the association between each of these factors and the FTO genotyping. To assess the associations between every two categorical variables (eg, FTO and smoking) a chi-squared test was applied.
Many studies have shown an association between the FTO gene (fat mass- and obesity-associated) and obesity-related traits in populations of different ethnic backgrounds. More specifically, a single-nucleotide polymorphism (SNP) in the FTO gene, namely, rs9939609, was previously found to have association with obesity.25–29 Out of 11 SNPs studied for this research, rs9939609 and rs1121980 (with the largest effect size in the meta-analysis of genome-wide associations for BMI) 30 and the association studies for PTF 15 were considered for further analysis. The basic genetic information about these two SNPs can be found in Table 2.
Basic genotyping information from the CODING study by gender.

Payne et al 15 recorded that the FTO SNP rs9939609 within the NL population is in high linkage disequilibrium (nonrandom association of alleles at different loci) with rs1121980 (r 2 > 0.80). Therefore, the entire research was replicated using the two SNPs as instrumental variables. Moreover, based on the results from their study, different genetic models were investigated and additive models were selected for both SNPs.
Pleiotropy (the influence of one gene on multiple unrelated phenotypic traits) and population stratification (systematic difference in allele frequencies between subpopulations of a population), which are the most known limitations of Mendelian Randomization, were then assessed. NL has been found to have unique genetic architecture based on homogeneity, isolation, and extended linkage disequilibrium.15,31 However, the instrumental variable assumption that there should not be any direct effect of any genotype on the outcome (as implication for pleiotropy) is not violated, since the genetic variants used as instruments were related to the exposure of interest (BMI/PTF) and not the outcome (physical activity). 32 Major population stratification is unlikely, since this study benefits from a large sample of unrelated individuals from the NL population.
The two-stage least squares (TSLS) approach was then performed to estimate the magnitude of the causal effect of each phenotype on the levels of physical activity. More specifically, in the first stage, PTF/BMI was modeled based on the FTO SNPs and age for each gender. In the second stage, the fitted values of PTF/BMI from the first stage were plugged in into the model for physical activity based on PTF/BMI, age, and confounding factors. In order to reduce the potential bias of a weak instrumental variable, F-statistics from the first-stage regression between genotype and BMI/PTF were examined. The Durbin-Wu-Hausman (DWH) test was applied to compare effect estimates from TSLS analysis and direct observational analysis.
Results
Baseline characteristics
Samples from 1,263 independent, unrelated individuals were considered for the analysis in order to avoid biased results due to genetic resemblance of related individuals. Out of the total subjects, about 22% (280 subjects) were males and about 78% (983 subjects) were females. The average age for the males was 38.4 years (SD = 14.2 years) and that of the females was 42.7 years (SD = 11.3 years).
The overall BMI was 27.4 kg/m2 among the males and 26.2 kg/m2 among the females. 55.6% of the entire subjects were overweight and obese. This proportion was 51.7 and 69.3 for females and males, respectively. Moreover, males reported lower average PTF (29.1%, SD = 10.1%) than females (38.4%, SD = 8.6%). Overall PTF was 36.3% (SD = 9.7%) across the entire subjects used in this study (Table 1). Furthermore, PTF and BMI were moderately correlated (Pearson's correlation coefficient = 0.63).
Findings from the outcome variable of this study show physical activity score averages at 6.2 units (SD = 1.3 units) for all the subjects. Among males, the physical activity score stood an average of 6.4 units (SD = 1.4 units) and at an average of 6.1 units (SD = 1.3 units) among females.
Based on a t-test comparing the trunk fat percentage and BMI for both the genders, and differences in minor allele frequencies, all the following models were stratified by gender.
Association studies
Payne et al 15 showed that in males, rs9939609 and rs1421085 were significant in explaining PTF, but none of the two SNPs was significant in females. They also did not find an association between the two SNPs and BMI in the NL population for either gender.
Many studies show that higher levels of physical activity can reduce the likelihood of being overweight or obese.12,13,33 Our study on the NL population confirms these results for both genders. More specifically, the results from Table 3 (first-stage least squares, modeling PTF/BMI based on the FTO SNPs and age), show that every score increase in physical activity is highly associated with 1.82 and 2.02 percent decrease in PTF for males and females, respectively. For BMI, an increase in every unit of physical activity is highly associated with 0.4 and 0.69 kg/m2 decline in BMI for males and females, respectively. Moreover, physical activity in the presence of the SNPs and age explains an additional 8.8% and 5.6% of the variability reduction in PTF in females and males, respectively. The additional variability in BMI, however, is negligible (less than 2% in both genders; Coefficients of Partial Determination from the output of R, data not shown).
Association study between PTF/BMI and physical activity by gender (adjusted for age and FTO SNP), first stage.

Refers to physical activity.
Our results from Model One (reversed association formulated as PTF = physical activity + age + FTO + error) in Table 4 show that for males, every percent increase in PTF is associated with an average 0.04 score decrease in physical activity. This impact is slightly higher (lower z-score) in females. Moreover, every kilogram per meter square increase in BMI for females is associated with 0.045 unit decrease in physical activity. Comparing the z-score coefficients, adjusted R-squared and F-statistic values in Models One and Two (reversed association formulated as PTF = physical activity + age + FTO + corresponding significant confounding factors + error) in the table, it can be seen that these associations were largely unchanged by adjusting for confounders. Moreover, for both genders in the two models, the magnitude of PTF versus BMI is higher for physical activity. For males, however, the association between BMI and physical activity (after adjusting for confounding factors) is no longer significant at level α = 0.005.
Direct observational analysis (reversed association study) between PTF/BMI and physical activity by gender.

Refers to PTF/BMI.
Adjusted for age.
Adjusted for confounding factors.
The results of the investigation on potential confounding factors that may affect physical activity are presented in Table 5. Smoking and medical status for both genders significantly lower the physical activity score. Trans-fat intake has a negative impact on physical activity score only among females. These factors were employed as confounding factors for our Mendelian randomization study.
Association study between the potential confounding factors and physical activity by gender.

Mendelian randomization analysis (MRA)
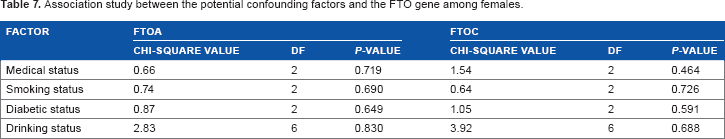
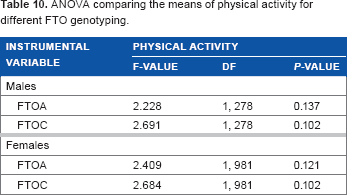
We examined the required assumption for MRA that the confounding factors should be independent of the instrumental variable (FTO gene). Analyzing the association between these factors (listed in Statistical analysis) and the FTO SNPs, the assumption was confirmed. These findings are shown in Tables 6–9. This suggests that the aforementioned confounding factors may be used in MRA. The ANOVA test comparing the mean physical activity scores showed no significant difference among genotyping of the two FTO SNPs. These results (shown in Table 10) imply that the FTO SNPs do not directly affect levels of activities in either gender, which is required for MRA.
Association study between the potential confounding factors and the FTO gene among females.

All coefficients should be interpreted as compared to the base genotype TT.
Association study between the potential confounding factors and the FTO gene among females.
Association study between the potential confounding factors and the FTO gene among males.

Association study between the potential confounding factors and the FTO gene among males.

ANOVA comparing the means of physical activity for different FTO genotyping.
Although direct observational studies for males showed a significant association between PTF and physical activity, Mendelian randomization analyses did not show a similar and significant association (coefficients based on TSLS are reported in Table 11). The direct impact of PTF on the physical activity score was stronger in females as compared to males. For females only, the DWH test showed a significant difference between the two methods. This implies that the direct association method is significantly different from the TSLS method, which means that the FTO SNP would work as an intermediate factor to make a significant contribution to the variability in PTF/BMI. However, as the study by Payne et al 15 showed no associations between the two SNPs and PTF in females, these SNPs were not suitable candidates for MRA in the first place. Therefore, the two SNPs of the FTO gene are not proper candidates for MRA on BMI, for either gender. The direct impact of BMI on physical activity score for females, however, is significant.
Comparing direct estimate of the effect of BMI/PTF vs. TSLS method on physical activity.

Notes:
TSLS Model is physical activity based on the estimated PTF from the first stage, adjusted for age and confounding factors.
Direct Estimate model is physical activity based on PTF/BMI, adjusted for age and confounding factors.
PTF/BMI. Significant (level 0.05) factors are indicated with bold font.
It suggests that for females, physical activity may be directly modeled based on BMI, age, and confounding factors, without the indirect influence of the FTO SNPs. These associations were largely unchanged when using FTOC instead of FTOA.
Discussion
In this study, we assessed the causality of abdominal (central) obesity on physical activity among adults of the NL population. We also investigated bidirectional associations between physical activity and obesity in adults of NL. Our results show that for both genders, increase in physical activity significantly reduces BMI and PTF, when adjusted for age and the FTO gene. Our observational analyses showed that increase in BMI/PTF is significantly associated with decrease in physical activity when adjusted for age. However, similar association between PTF and physical activity in Mendelian randomization analyses was not significant.
While many studies on the causality effect of obesity on individuals' health use BMI as a biomarker for obesity,30,34,35 in our research, we used PTF as a measure of fat-mass in addition to the standard measure of obesity (BMI). Our results show that the marginal effect of PTF on physical activity was stronger as compared to that of BMI. This was expected, as BMI does not differentiate between fat and lean mass, and physical activity positively correlates with lean mass.
We also inferred causality using the Mendelian randomization technique as outlined by other researchers.32,36,37 This method uses variation in genes as instrumental variables to provide an alternative way of dealing with the problems of confounding factors in observational studies. Moreover, we used the FTO gene, which is reliably established in independent studies to be highly associated with the exposure variables (BMI and PTF).15,38,39 Our study is on the NL population, which is generally isolated and homogenous (mostly Caucasians). It provides a suitable population for generalized genetic results.
Exploratory MR approach investigating the association between adiposity and activity levels may provide evidence for causality in this direction. However, it does not exclude the possibility that physical activity has a causal effect on obesity. A genetic instrument for physical activity is required to test the relationship in a bidirectional manner. Moreover, we were limited with few possibilities of finding all the factors that confound between BMI/PTF and physical activity, since our dataset did not include information on the social and economic status of the individuals.
Further work is required to determine a more accurate estimate of the causal effect in the reverse direction. This study still provides some insight into the causal contributions of (central) obesity to physical activity score in adults of NL. It means that the health intervention strategies at the provincial level that attempt to increase physical activity among adults in the province should perhaps include some other plans, such as improving diet, for reducing abdominal obesity.
Author Contributions
Analyzed the data: FB. Wrote the first draft of the manuscript: FB. Contributed to the writing of the manuscript: FB and TA. Agree with manuscript results and conclusions: TA. Jointly developed the structure and arguments for the paper: FB and TA. Made critical revisions and approved final version: TA. All authors reviewed and approved of the final manuscript.
Footnotes
Acknowledgments
The authors are grateful to Dr. Guang Sun and his lab members for providing the data for analysis. The authors also wish to thank the referees for their great suggestions and comments that helped to improve the manuscript.