
Abstract
The role of metabolic syndrome (MetS) on stroke has been explored only in many observational studies. We conducted Mendelian randomization (MR) to clarify whether or not the genetically predicted MetS and its components are causally associated with stroke and its subtypes. Genetic instruments of MetS and its components and outcome data sets for stroke and its subtypes came from the gene-wide association study in the UK Biobank and MEGASTROKE consortium, respectively. Inverse variance weighting was utilized as the main method. Genetically predicted MetS, waist circumference (WC), and hypertension increase the risk of stroke. WC and hypertension are related to increased risk of ischemic stroke. MetS, WC, hypertension, and triglycerides (TG) are causally associated with the increasing of large artery stroke. Hypertension increased the risk of cardioembolic stroke. Hypertension and TG lead to 77.43- and 1.19-fold increases, respectively, in small vessel stroke (SVS) risk. The protective role of high-density lipoprotein cholesterol on SVS is identified. Results of the reverse MR analyses show that stroke is related to hypertension risk. From the genetical variants perspective, our study provides novel evidence that early management of MetS and its components are effective strategies to decrease the risk of stroke and its subtypes.
Introduction
The Global Burden of Diseases, Injuries, and Risk Factors Study (GBD) 2019 reported that stroke ranks as the second leading cause of death and third leading cause of death and disability combined worldwide. 1 In 2019, the number of cases was 12.2 million, and the related deaths were 6.55 million. However, the disease burden has remained heavy despite substantial breakthroughs in emergency treatment for stroke since 2015. 2 Therefore, stroke prevention is regarded as an effective measure, given that 85% of all strokes may be preventable. 3 At present, apart from non-intervenable factors (e.g., age and race), modifiable risk factors in life (e.g., tobacco use, alcohol consumption, and total cholesterol) gradually attract increasing interest in stroke prevention, given that it has substantially decreased the incidence of stroke by about 42% in high-income countries within the last 30 years. 4 Thus, the high incidence of stroke may be decreased by identifying and through intervening modifiable risk factors.
The World Health Organization (WHO) defines metabolic syndrome (MetS) as a cluster of pathologic conditions, consisting of glucose abnormalities, hyperlipidemia, central obesity, and hypertension. 5 In general, incidence of MetS is increasing rapidly, and approximately one quarter of people in Western countries have MetS.6,7 Mounting evidence from many observational studies has indicated that MetS is independently correlated with the increased risk of stroke. 8 However, clear confounders, such as retrospective studies and research designs, are inherent shortcomings in these studies, which may impede the understanding of the corresponding conclusions.
Mendelian randomization (MR) is a robust statistical approach to genetic variants to make a causal inference, which could overcome the limitation of observational studies. 9 Single-nucleotide polymorphisms (SNPs) are assorted randomly in forming a zygote during gestation. 10 Collectively, random assortment of interventions in MR analyses is similar to assignments in randomized clinical trials.10,11 Moreover, no study has been conducted to investigate the causal association of MetS and its five components on stroke subtypes. Therefore, we performed this bidirectional MR analysis to yield their causal links.
Methods
Study design
The outline of our bidirectional MR study is shown in Figure 1. In the MR analysis, we identified the causal relationship between MetS and its five components and stroke and its subtypes. In addition, the causal effect of genetically predicted stroke and its subtypes on MetS and its components is investigated through reverse MR analysis. Ethical review and approval were not required in our study. Informed consent was acquired from all subjects in the original genome-wide association studies.
The flow chart of our MR analysis. MR: mendelian randomization; SNP: single nucleotide ploymorphism; HDL-C: high-density lipoprotein cholesterol.
Date sources of exposures and outcomes
Genetic predictors for MetS and its components (waist circumference [WC], hypertension, triglycerides [TG], and high-density lipoprotein cholesterol [HDL-C]) came from the meta-analysis of gene-wide association study (GWAS) in the UK Biobank (MetS: 291,107 participants; WC: 462,166 samples; hypertension: 463,010 subjects; TG: 441,016 samples; HDL-C: 403,943 participants).12–14 Instrumental variables (IVs) of fasting blood glucose (FBG) were available from GWAS in the meta-analyses of glucose and insulin-related traits consortium (MAGIC), consisting of 281,416 samples. 15 The detailed sources of data sets used in our study are summarized in Supplementary Table 1.
Outcome data sets on stroke and its subtypes were taken from the MEGASTROKE consortium in the European population. 16 The data sets consisted of five stroke traits, (stroke: 67,162 cases and 453,702 control; ischemic stroke [IS]: 60,341 cases and 452,221 controls; large artery stroke [LAS]: 6688 cases and 238,763 controls; cardioembolic stroke [CES]: 9006 cases and 378,720 controls; and small vessel stroke [SVS]: 11,710 cases and 286,854 controls). Stroke is diagnosed based on WHO’s definition, which is rapidly exacerbating signs of focal (or global) cerebral dysfunction, experiencing over 24 hours, or resulting in death without evident triggers other than that of the blood vessel source.
Genetic instrument selection
Genetic instruments related to MetS and its components should meet the criterion that all SNPs satisfied a significance level (P < 5 × 10⁻⁸), and an r2 threshold was <0.05 when we pruned independent SNPs in linkage disequilibrium analysis (at a window size of 10,000 kb). The MR Pleiotropy RESidual Sum and Outlier (MR-PRESSO) approach was employed to identify significant outliers explaining possible pleiotropy, 17 which should be removed to reduce the heterogeneity and horizontal pleiotropy. Value of the F-statistics represents the strength of our MR study, and the computational formula is F-statistics = (Beta/Se), 2 where Beta and Se are the relational coefficients between IVs and traits and standard error, respectively. Value of F-statistics >10 is an indicator of statistical robustness. 18 Lastly, qualified SNPs selected as IVs are presented in Table 1.
The R2 and F-statistics for the genetic instruments in the MR and reverse MR analyses.
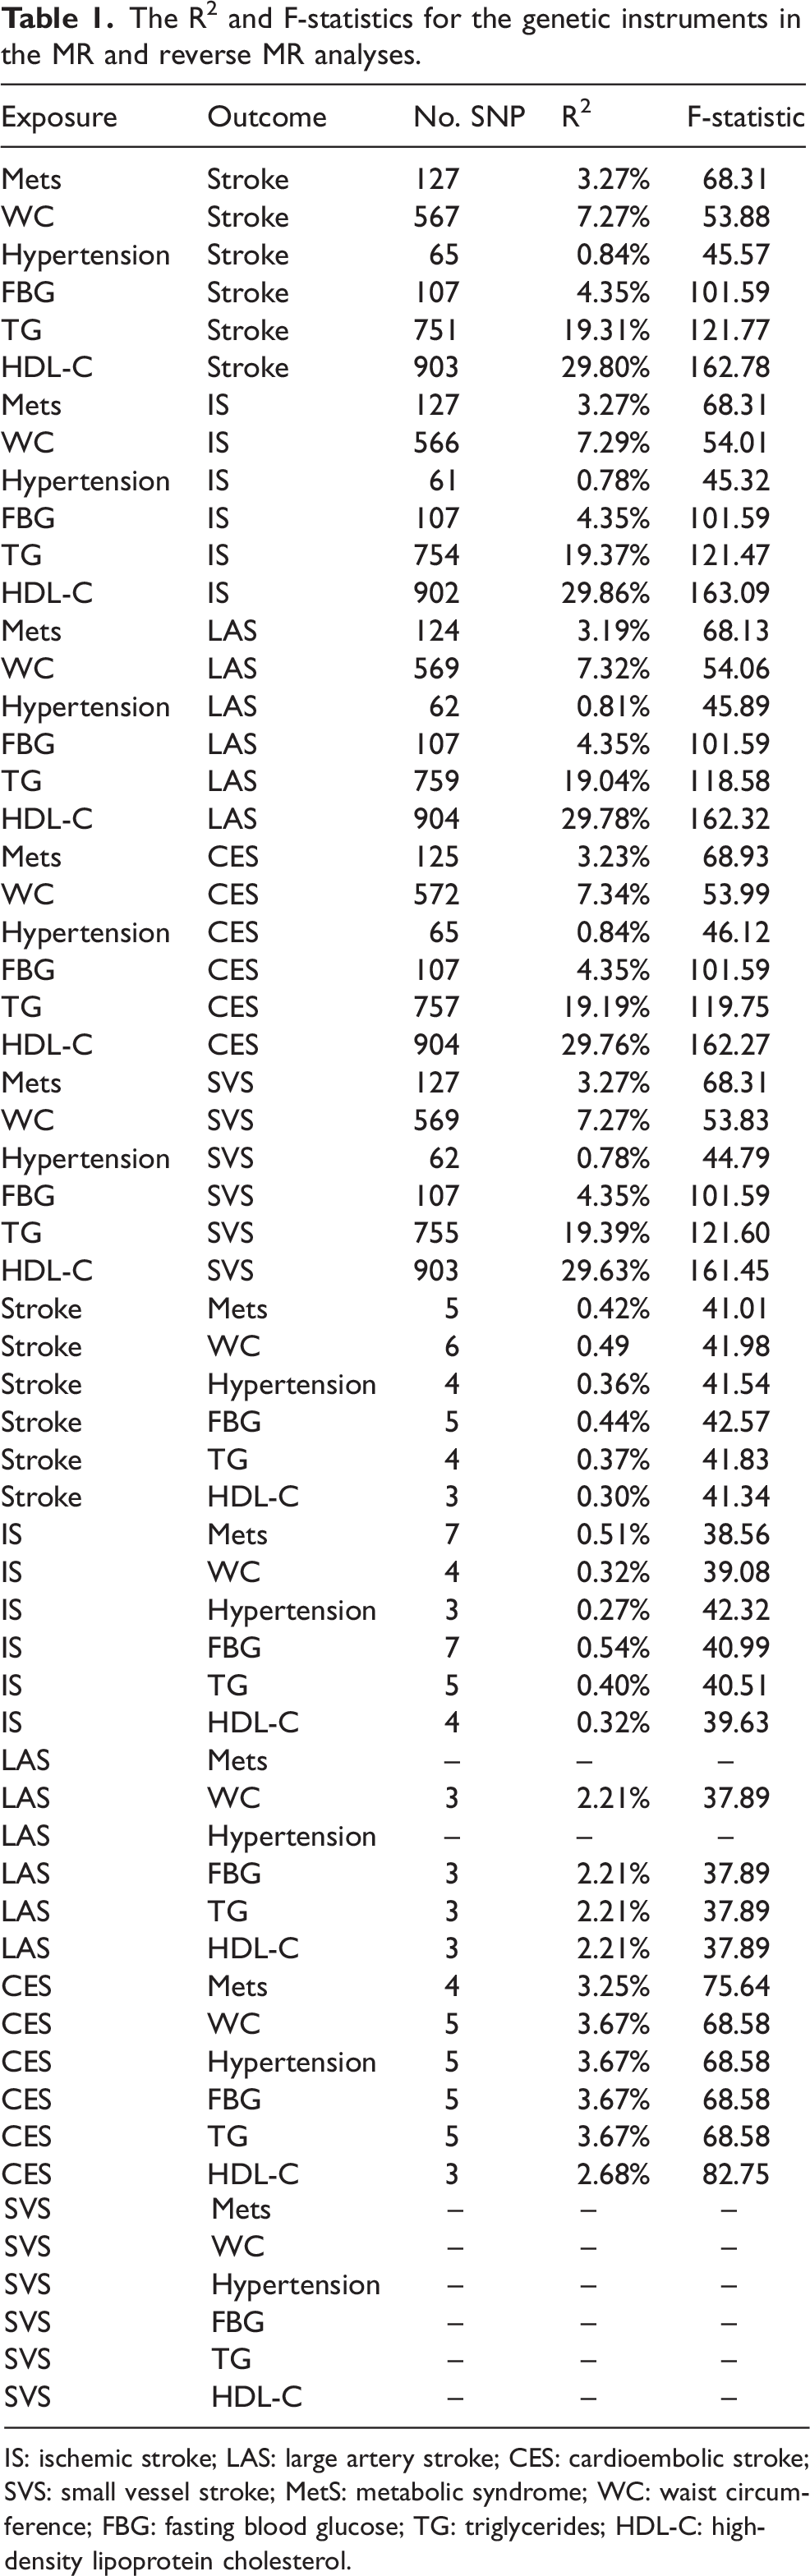
IS: ischemic stroke; LAS: large artery stroke; CES: cardioembolic stroke; SVS: small vessel stroke; MetS: metabolic syndrome; WC: waist circumference; FBG: fasting blood glucose; TG: triglycerides; HDL-C: high-density lipoprotein cholesterol.
Main statistical analyses
The main analytical method is the random effects inverse variance weighting (re-IVW) approach to identify the causal effect of risk factors on outcomes in the MR and reverse MR analyses. The reason is that the IVW method can obtain a robust result in the condition of no signs of pleiotropy (no violation of the independence assumption).
Statistical significance is set at the threshold of the Bonferroni-corrected P < 0.0016 (0.05/30) in this study. All analyses were conducted using the “TwoSampleMR”, “mr.raps”, “cause”, and “forestplot” packages in R software (version: 3.6.5).
Sensitivity analyses
This study used five methods to perform sensitivity analyses. The comparison result of egger intercept term with zero in the MR-Egger analysis represents the directional pleiotropy. Even if all IVs are invalid, MR-Egger can obtain valid causal effect estimates. 19 The weighted median approach can gain consistent findings via aggregating numerous estimates into a single total estimate, even if half of SNPs are not valid. 20 A relative low standard error exists in the maximum likelihood method, although it may be deviated by a small sample. 21 The findings in the MR-RAPS analysis remain robust in the presence of weak IVs, on the condition that horizontal pleiotropy exists. 22 The MR-PRESSO method can identify significant outliers and remove them thereafter for pleiotropy. Collectively, markedly reliable results can be produced. 17 The results of the global test were used to account for horizontal pleiotropy.
The egger intercept term in the MR-Egger analysis and P value of the MR-PRESSO approach were introduced into the regression model to detect directional pleiotropy. We also performed Cochran’s Q test to determine possible heterogeneity. In addition, the findings of the leave-one-out analysis was used to illustrate the robustness of the conclusion when excluding IVs at a time.
Results
Causal effect of genetically predicted MetS and its components on stroke
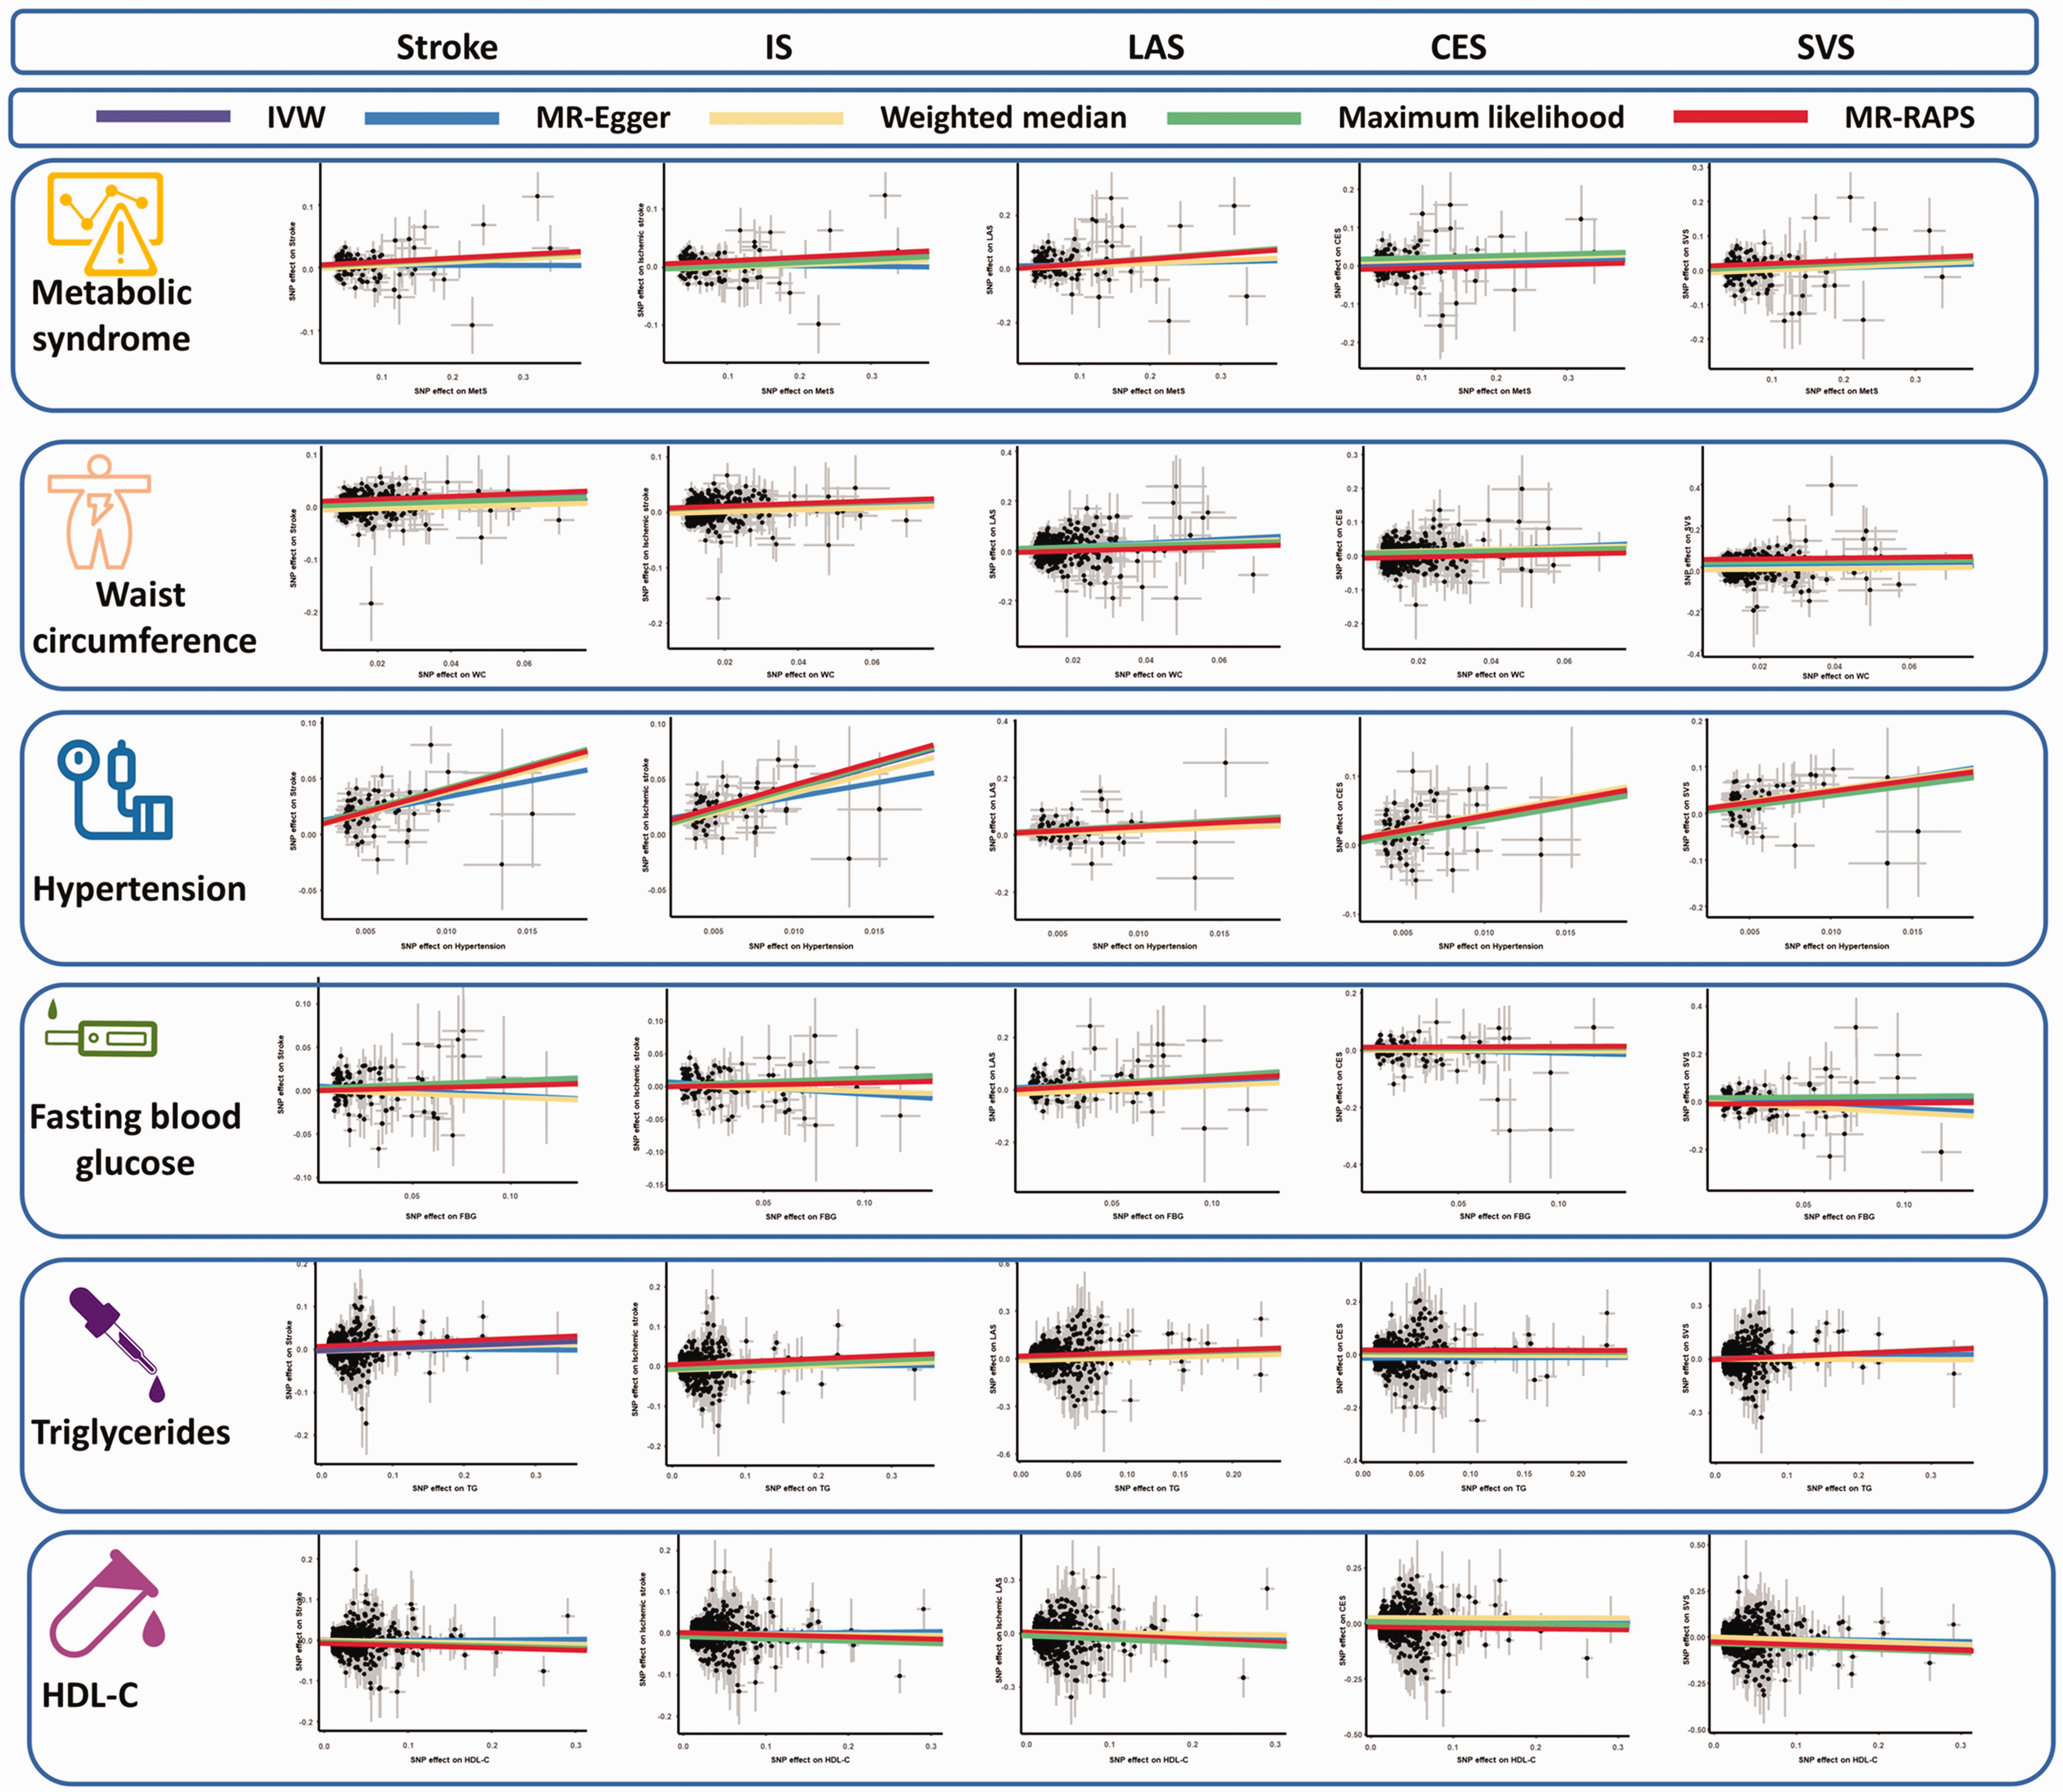
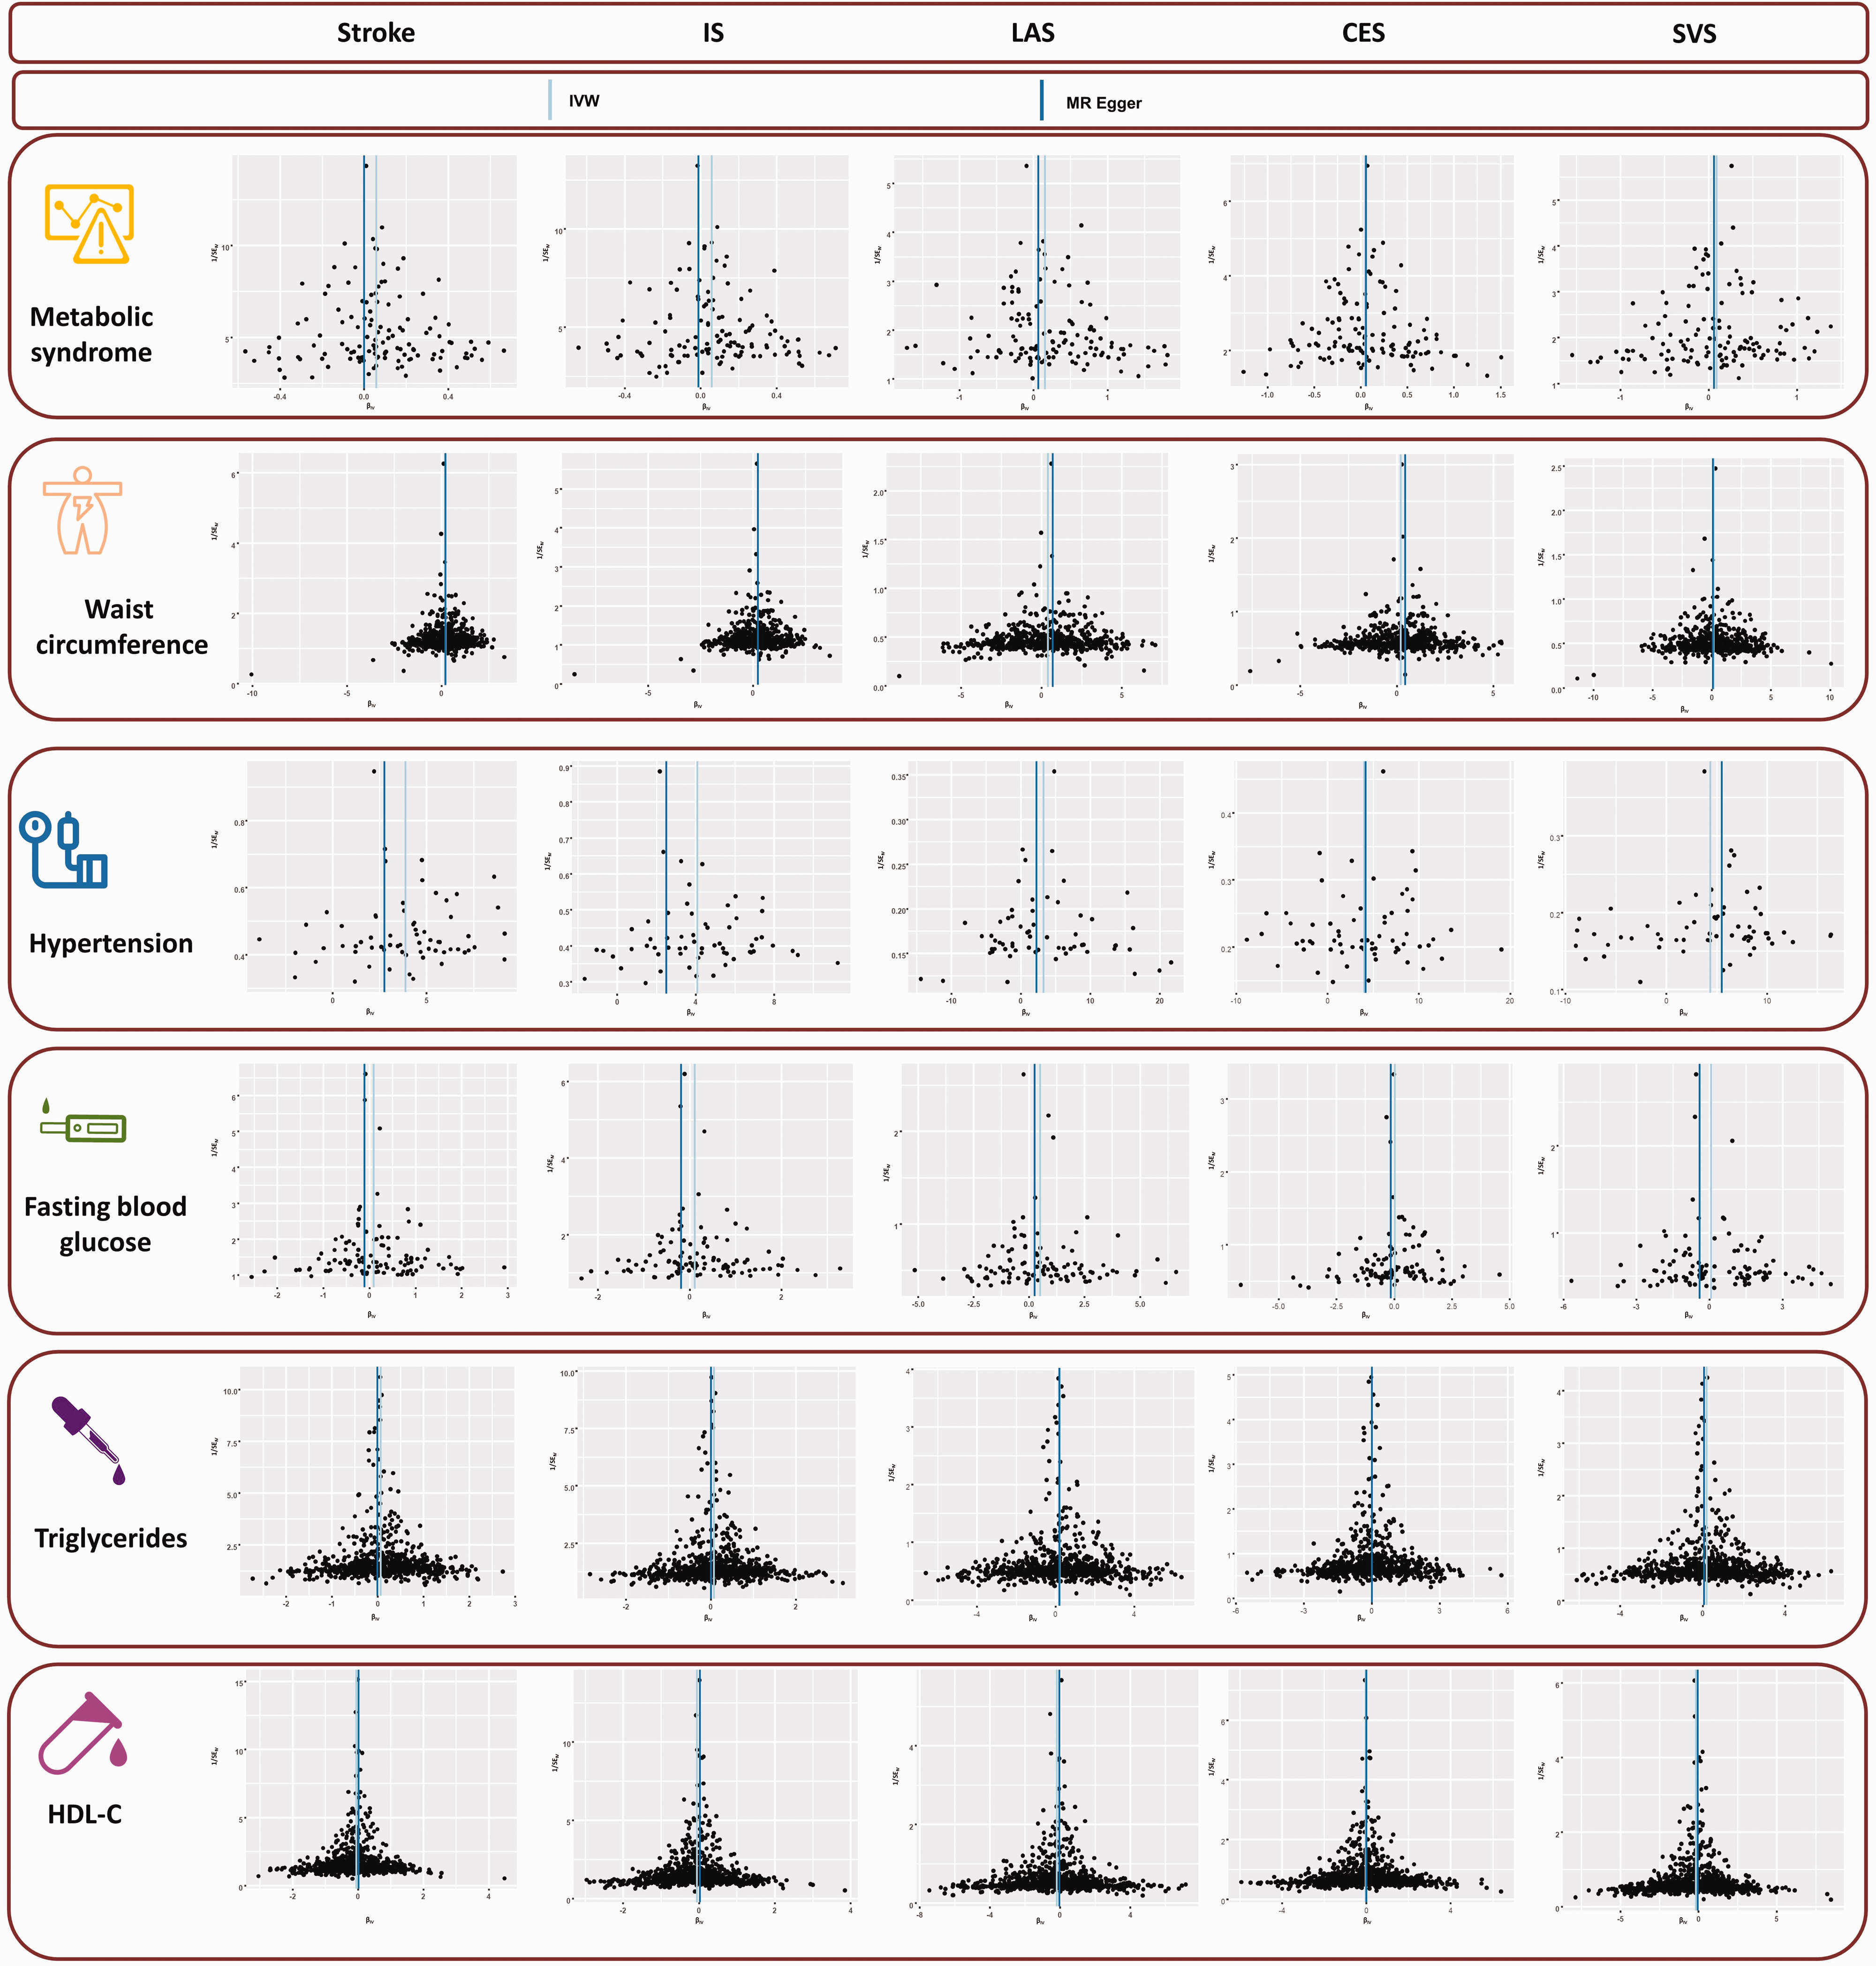
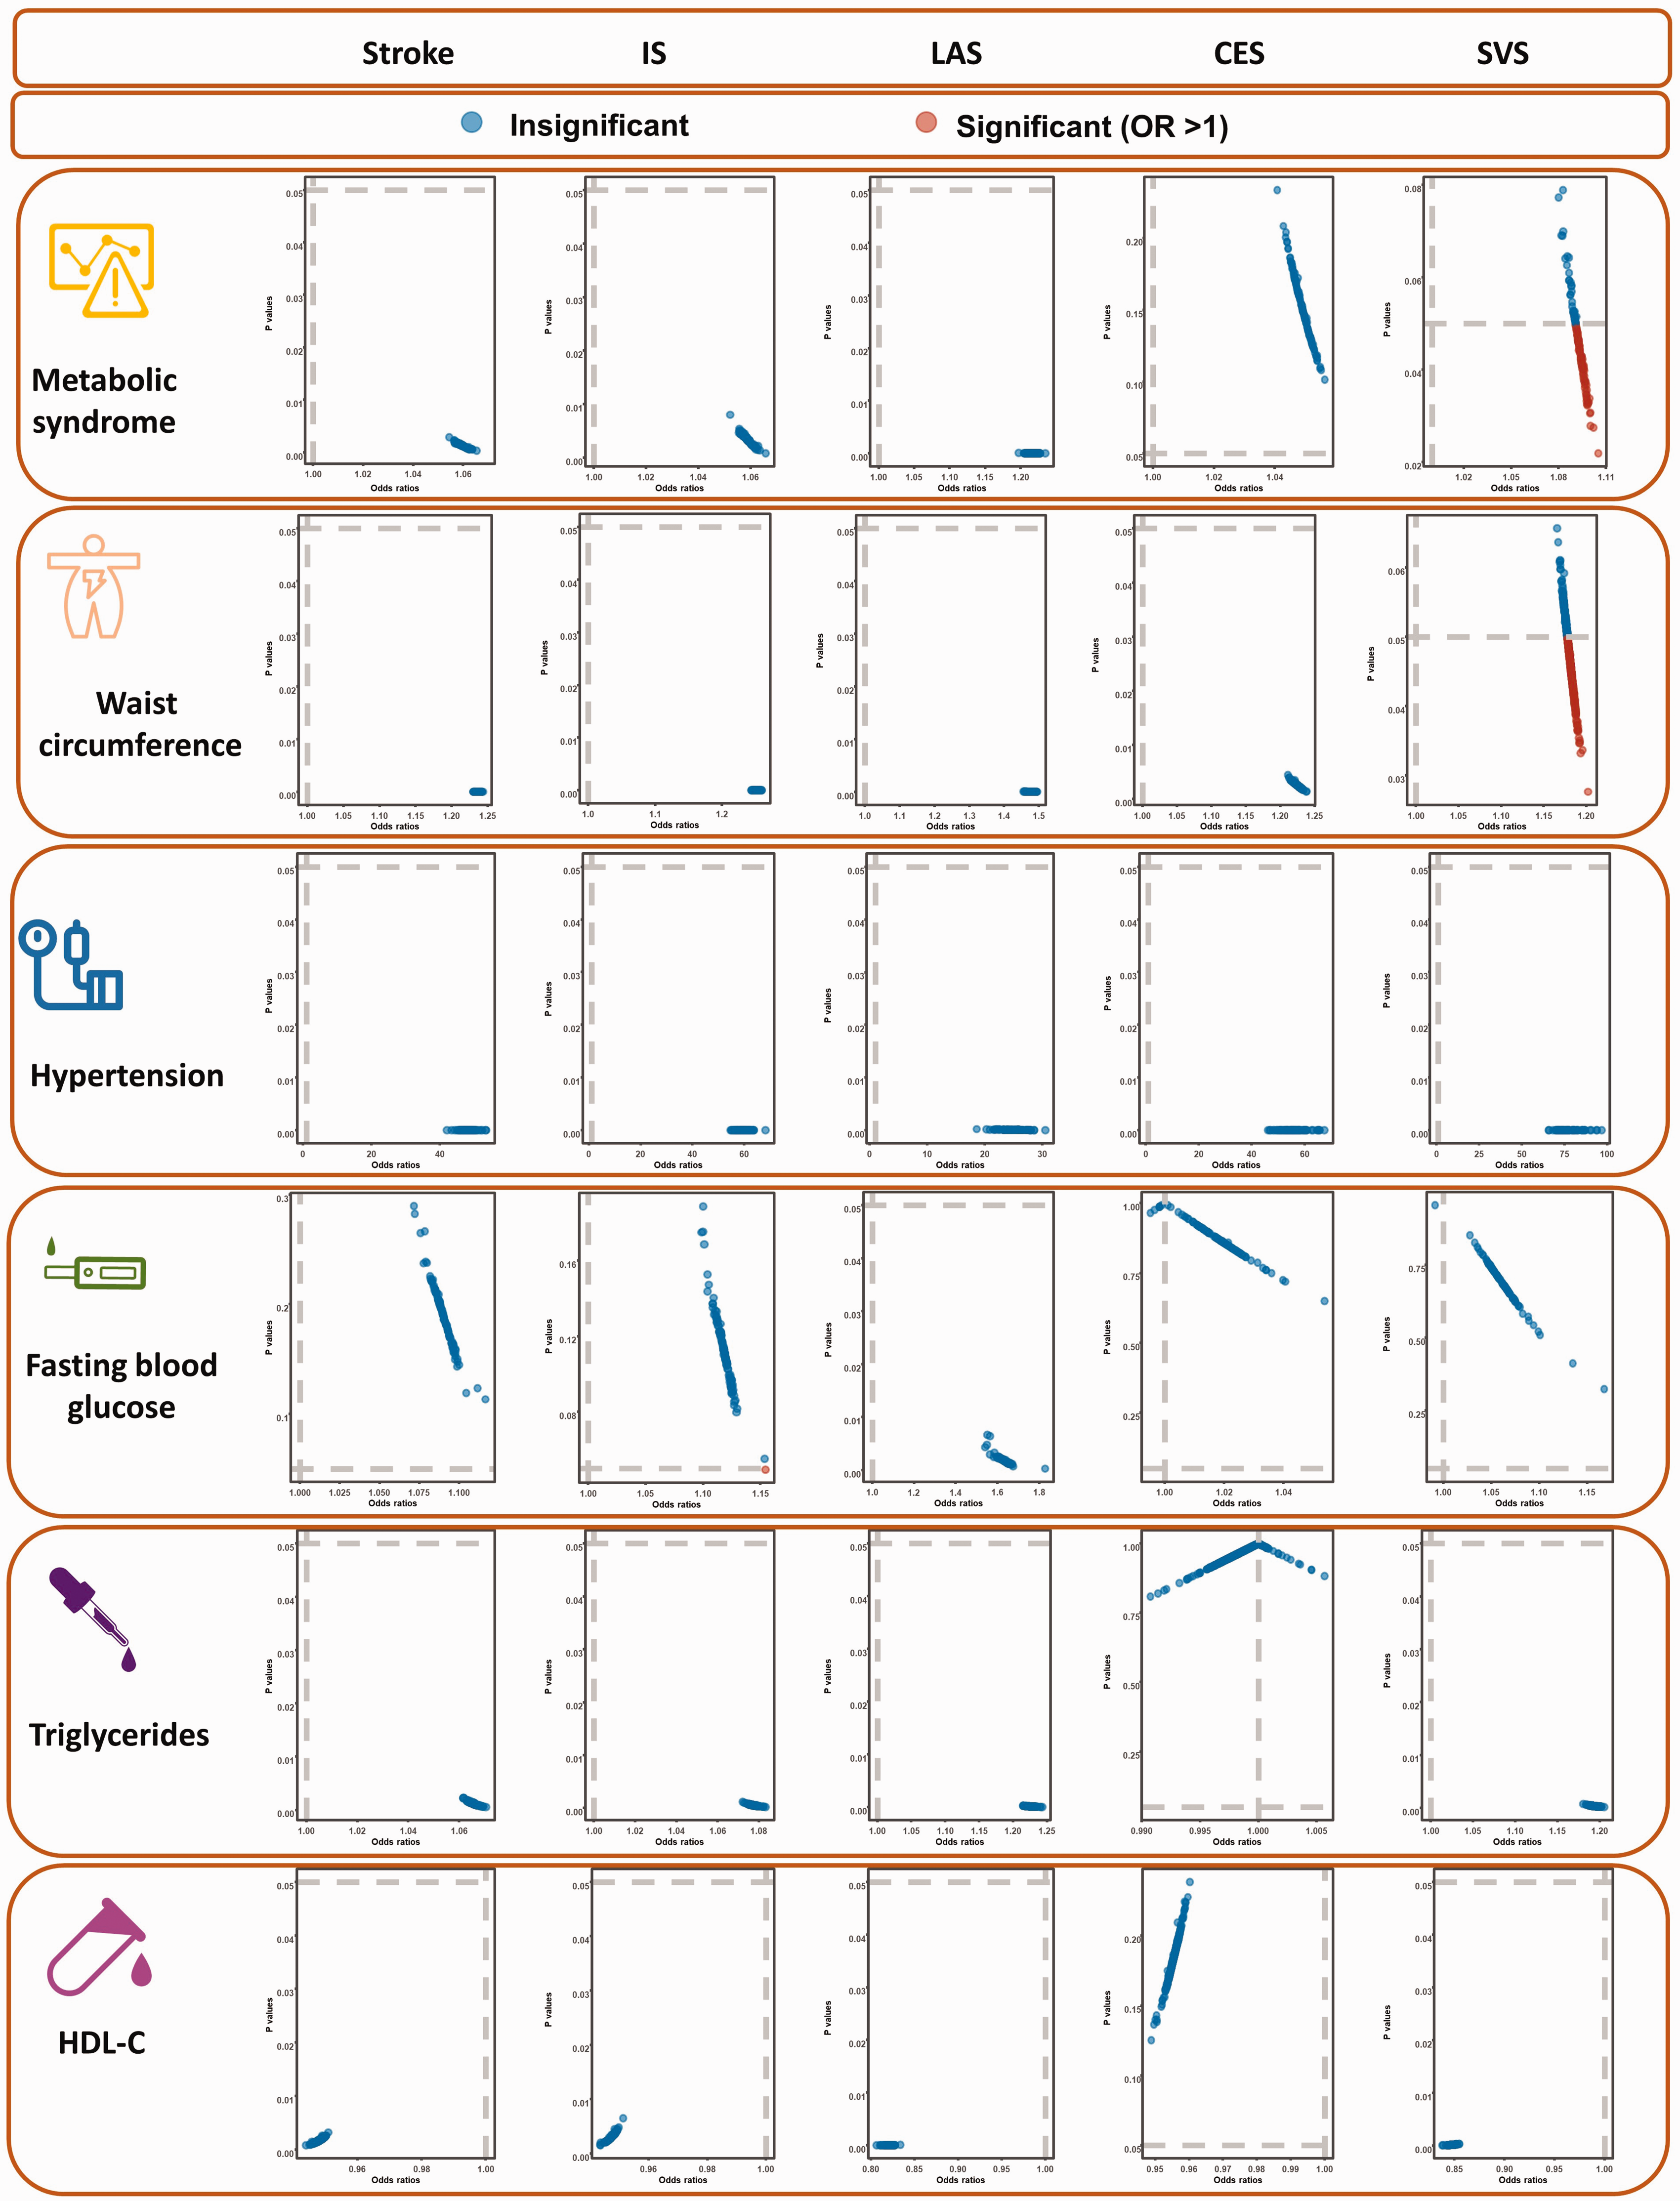
Results from the IVW analysis are presented in Table 2, and suggest that MetS increases a 1.05-fold risk of stroke (95% confidence interval [CI]: 1.02–1.09, P = 0.0012). Scatter plot (Figure 2) shows that the IV effect on stroke is intensified when the SNP effect on MetS increases. In sensitivity analyses, causal association between MetS and stroke still exists (Maximum likelihood method: OR: 1.06, 95%CI: 1.02–1.09, P = 0.0002; MR-RAPS: OR: 1.06, 95%CI: 1.02–1.10, P = 0.0011; Table 2). Results in the Cochran’s Q analysis demonstrate visible heterogeneity (Q = 163.13, P = 0.01), while the funnel plot in Figure 3 shows a symmetry of the MR results, suggesting no signs of heterogeneity. No pleiotropy was identified using the MR-Egger (egger intercept term = 0.0040, P = 0.112) and MR-PRESSO methods (P > 0.05). Moreover, no influential IVs were identified in the leave-one-out analysis when excluding any one of SNPs (Figure 4). Frost plot manifesting the causal estimate of every SNP on stroke is shown in Figure 5.
The causal effect of MetS and its components on stroke and its subtypes.
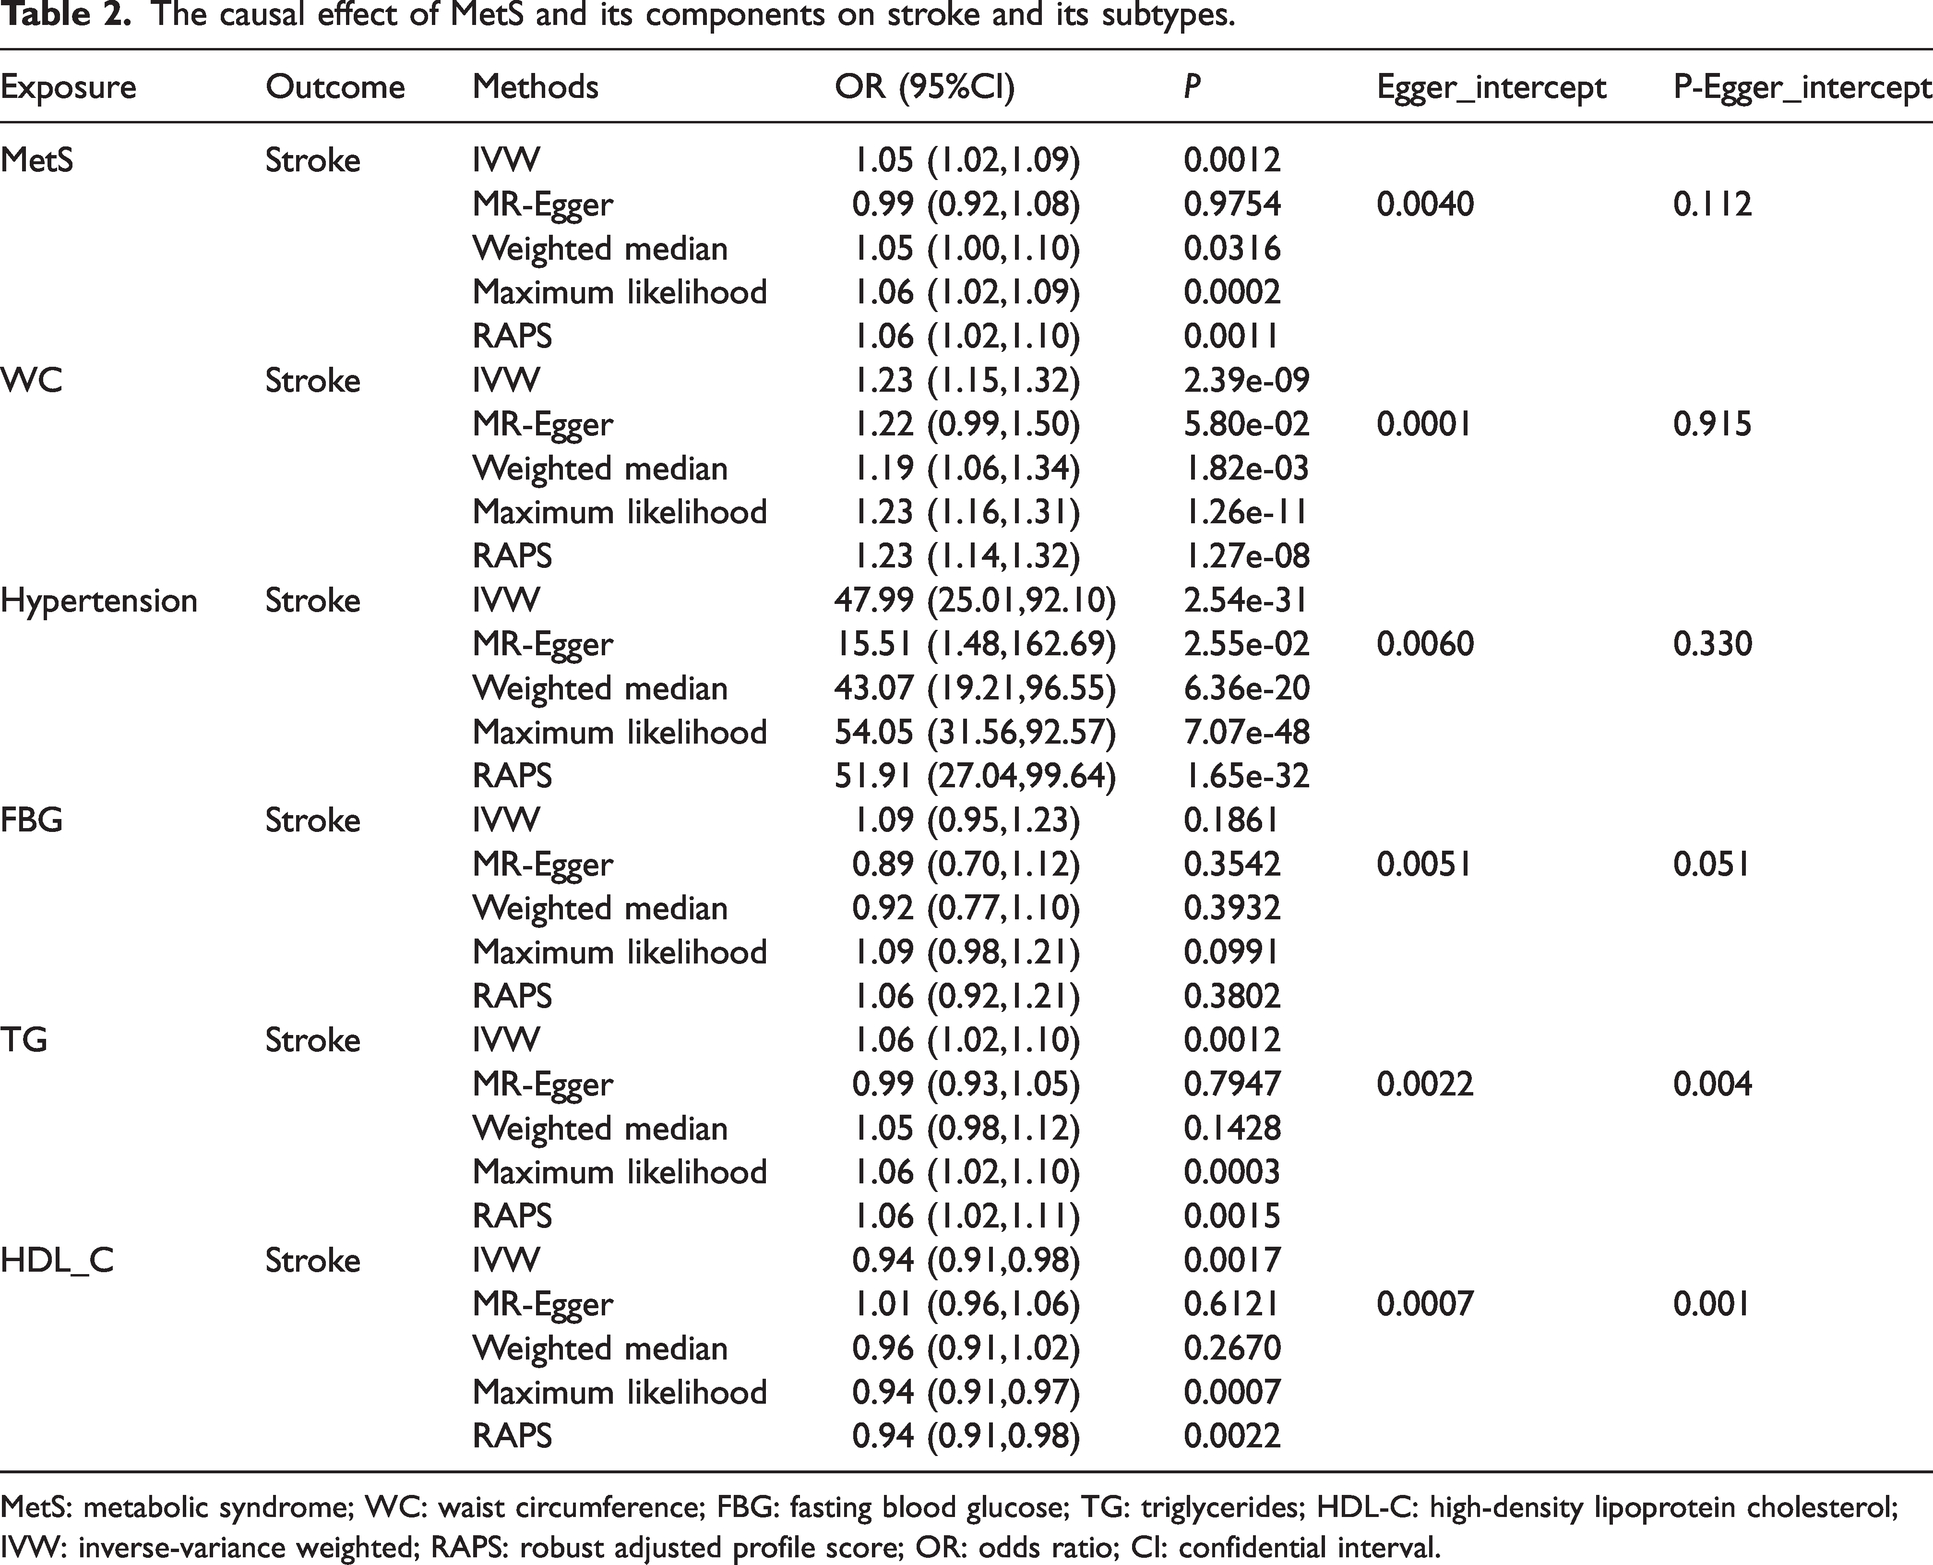
MetS: metabolic syndrome; WC: waist circumference; FBG: fasting blood glucose; TG: triglycerides; HDL-C: high-density lipoprotein cholesterol; IVW: inverse-variance weighted; RAPS: robust adjusted profile score; OR: odds ratio; CI: confidential interval.
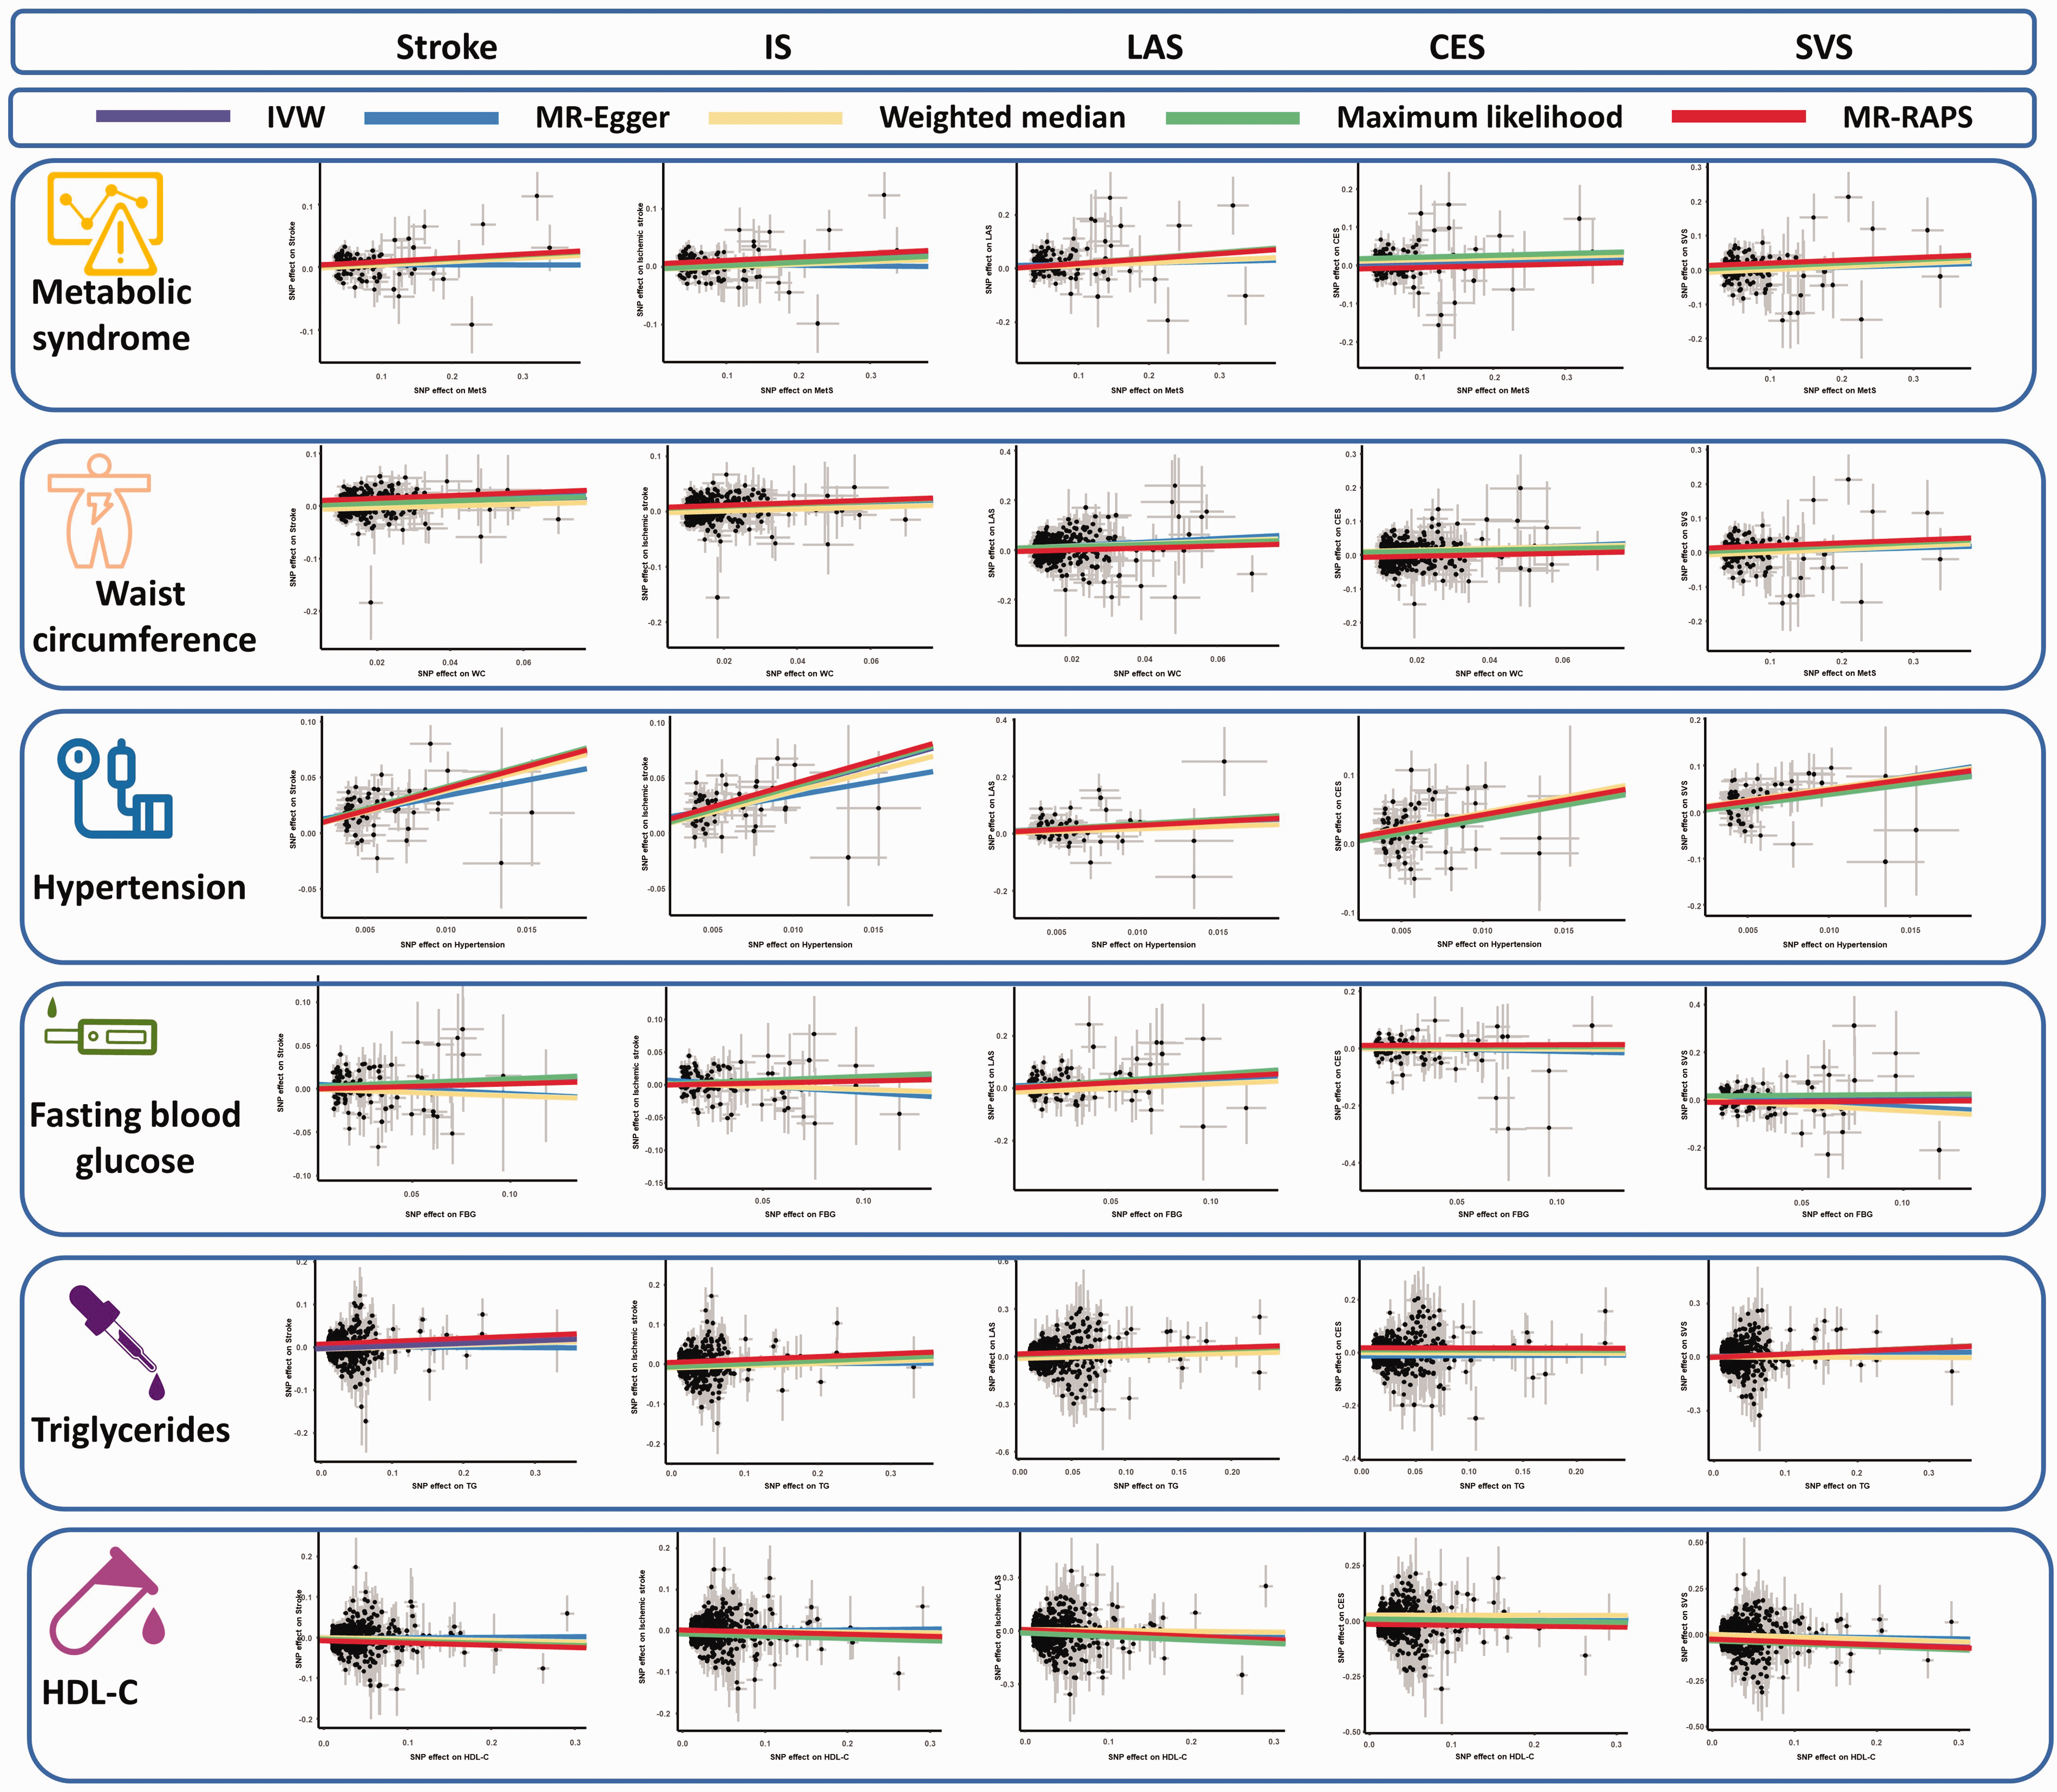
The scatter plots of the association between genetically predicted MetS and its components on stroke in the MR analysis. IS: ischemic stroke; LAS: large artery stroke; CES: cardioembolic stroke; SVS: small vessel stroke; HDL-C: high-density lipoprotein cholesterol; IVW: inverse-variance weighted; RAPS: robust adjusted profile score.
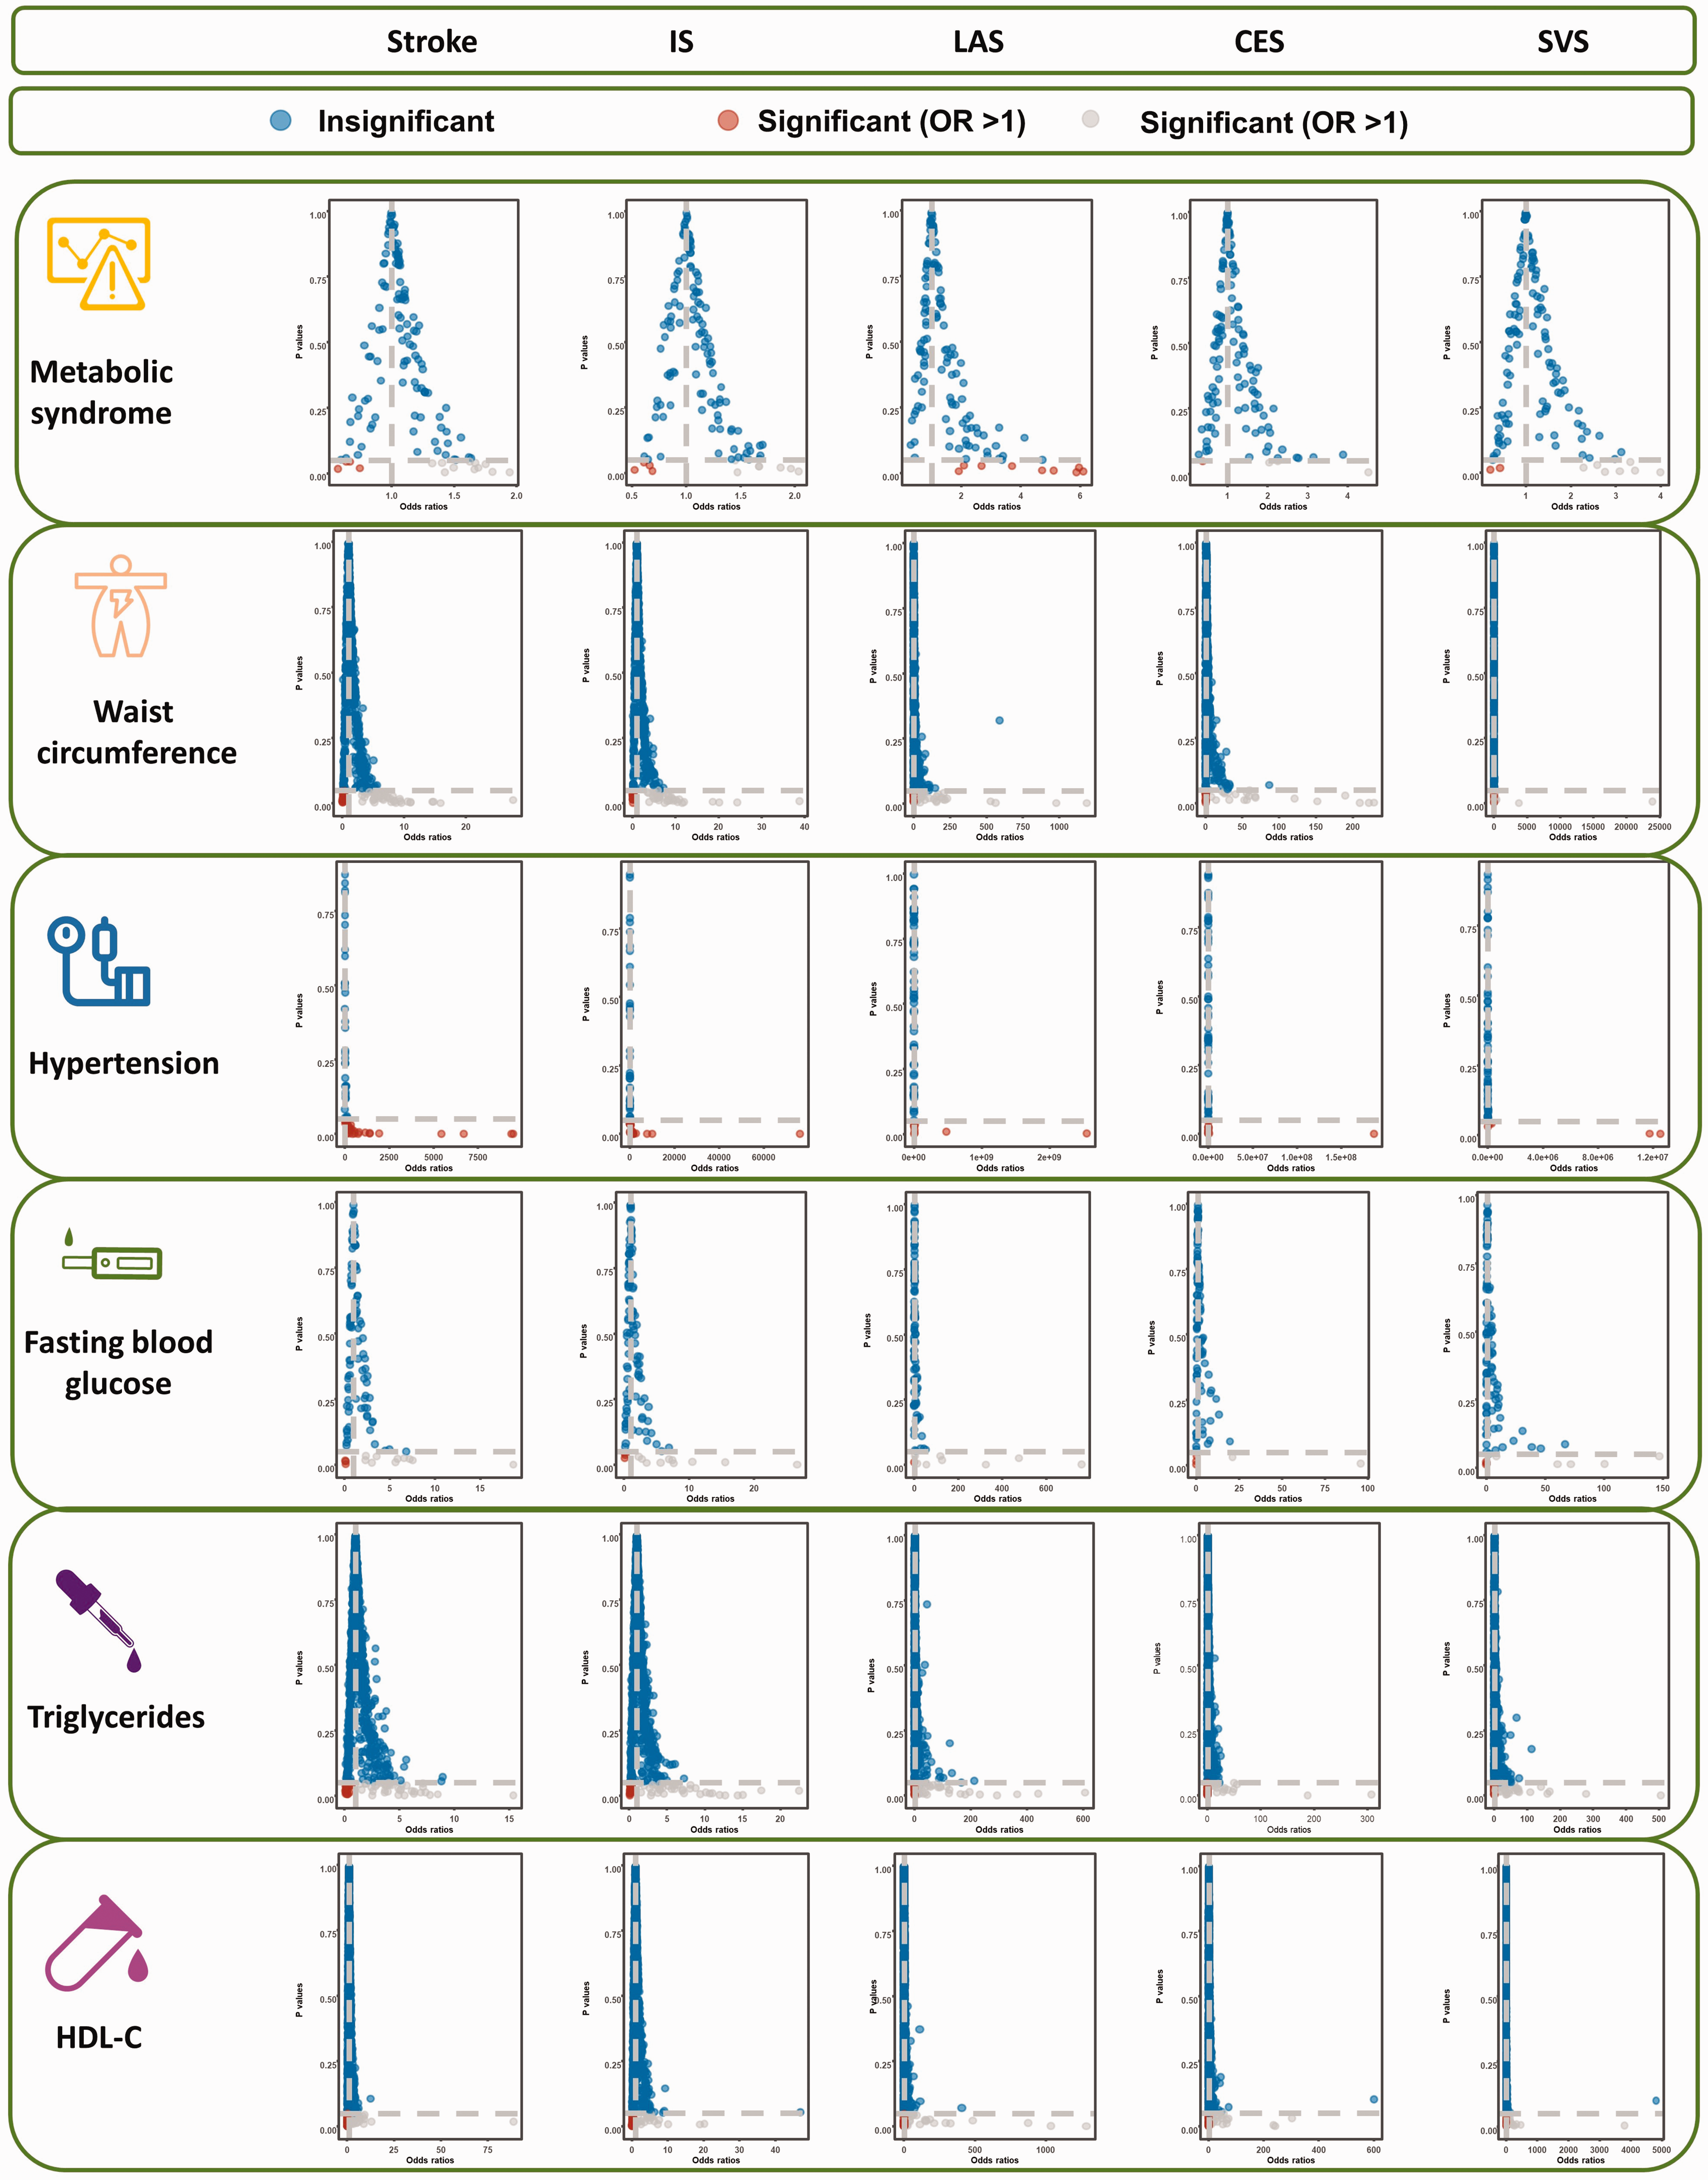
The funnel plots of the association between genetically predicted stroke on MetS and its components in the reverse MR analysis. IS: ischemic stroke; LAS: large artery stroke; CES: cardioembolic stroke; SVS: small vessel stroke; HDL-C: high-density lipoprotein cholesterol; IVW: inverse-variance weighted.
The leave-one-out analysis of the association between genetically MetS and its components on stroke in the MR analysis. IS: ischemic stroke; LAS: large artery stroke; CES: cardioembolic stroke; SVS: small vessel stroke; HDL-C: high-density lipoprotein cholesterol; OR: odds ratio.
The frost plots of the association between genetically MetS and its components on stroke in the MR analysis. IS: ischemic stroke; LAS: large artery stroke; CES: cardioembolic stroke; SVS: small vessel stroke; HDL-C: high-density lipoprotein cholesterol; OR: odds ratio.
For MetS’ components, WC and hypertension were genetically related to the increasing risk of stroke, while not related to FBG, TG, and HDL-C (all P > 0.0016, Table 2, Figure 2). ORs with 95%CI on stroke is 1.23 (95%CI: 1.15–1.32, P = 2.39 × 10⁻⁹) for WC and 47.99 (95%CI: 25.01–92.10, P = 2.54 × 10⁻³¹) for hypertension. The causal association of HDL-C on stroke is suggestive (P = 0.0017), while the protective effect of HDL-C on stroke is identified (OR: 0.94, 95%CI: 0.91–0.98). Nevertheless, potential horizontal pleiotropy is observed for TG and HDL-C in the MR-Egger regression analyses (P < 0.05), and the causal effect of TG and HDL-C on stroke estimated by CAUSE is unsupported (P = 0.56, P = 0.33, respectively). Evident heterogeneity is detected in Cochran’s Q analysis (all P < 0.05), but MR results in the funnel plot (Figure 3) are symmetrical, suggesting the absence of heterogeneity. In addition, the results in the leave-one-out analysis reveal a robust positive association after leaving any single SNP out in turn (Figure 4). This result indicates that no influential SNPs are found. Causal estimates for every IV are shown in Figure 5.
Causal effect of genetically predicted MetS and its components on is-IS
Harmful effect of genetically predicted MetS on IS has weak statistical significance (OR: 1.05, 95%CI: 1.01–1.09, P = 0.0032), which is similar to the results in the MR-RAPS analysis (OR: 1.06, 95%CI: 1.02–1.10, P = 0.0021) (Supplementary Table 2). As shown in Figure 2, the risk of IS tends to increase as IV’s effect on MetS increases. Although results of Cochran’s Q analysis suggest heterogeneity, MR results in the funnel plot are symmetrical (Figure 3). This result indicates an absence of heterogeneity. Accordingly, there are no evidence of pleiotropy in MR-Egger (egger intercept term = 0.0051, P = 0.082) and MR-PRESSO analyses (P > 0.05). Moreover, no influential IVs are identified in the leave-one-out test after omitting any SNPs (Figure 4). The results of the MR analyses for each SNP are presented in Figure 5.
For the components (Figure 2), the risk of IS is increased by WC (OR: 1.25, 95%CI: 1.16–1.34, P = 2.03 × 10⁻⁹) and hypertension (OR: 59.54, 95%CI: 32.64–108.60, P = 1.57 × 10−40). TG may increase the risk of IS, but causal association is not supported and estimated by CAUSE (P = 0.94). FBG and HDL-C are not related to increased risk of IS after performing CAUSE analyses (all P > 0.05). For heterogeneity, Cochran’s Q analysis indicates evident heterogeneities for WC, FBG, TG, and HDL-C (all P < 0.05). Results in all funnel plots suggest no signs of heterogeneity (Figure 3). Meanwhile, there is absence of pleiotropy in the MR-Egger (all P > 0.05) and MR-PRESSO (all P > 0.05) analyses. Furthermore, results of the leave-one-out analyses suggest that no influential IVs are identified after removing any SNP in turn (Figure 4). Estimates for every SNP are shown in Figure 5.
Causal effect of genetically predicted MetS and its components on LAS
As shown in the Supplementary Table 3, genetically predicted MetS is positively related to LAS (OR: 1.21, 95%CI: 1.10–1.33, P = 2.96 × 10⁻⁵). Positive causal association remains supported in the maximum likelihood (OR: 1.21, 95%CI: 1.11–1.32, P = 5.79 ×10⁻⁶) and MR-RAPS (OR: 1.20, 95%CI: 1.09–1.32, P = 1.50 × 10⁻⁴) analyses. Figure 2 shows the harmful effect of MetS on LAS. In Cochran’s Q test, no sign of heterogeneity is detected (P values of Cochran’s Q > 0.05, as shown in Figure 3). No signs of pleiotropy are observed in the MR-Egger (egger intercept term = 0.0101, P = 0.157) and MR-PRESSO (P > 0.05) analyses. In addition, results in the leave-one-out analysis demonstrate that the causal association is robust after leaving any single SNP out in turn (Figure 4). The forest plot manifesting the estimate of every SNP on LAS is shown in Figure 5.
Positive causal associations among WC, hypertension, TG, and LAS are also observed. ORs with 95%CI on LAS is 1.47 (95%CI: 1.23–1.76, P = 1.91 × 10⁻⁵) for WC, 25.05 (95%CI: 5.07–123.80, P = 7.75 × 10⁻⁵) for hypertension, and 1.22 (95%CI: 1.10–1.36, P = 1.46 × 10⁻⁴) for TG (Figure 2). Causal effect of genetically predicted FBG on LAS is on the edge of significance (P = 0.0017), and FBG has a trend to increase the risk of LAS (OR: 1.62, 95%CI: 1.20–2.20). Despite pleiotropy, there are no signs of causal association between HDL-C and LAS after being estimated by CAUSE (P = 0.079). Heterogeneity of WC, hypertension, TG, and HDL-C is detected in Cochran’s Q test, although the symmetry of MR results in the funnel plots suggests no sign of heterogeneity (Figure 3). Causal association among WC, hypertension, TG, and LAS remains stable after removing any SNP in turn (Figure 4). Figure 5 presents the estimates of each SNP on LAS.
Causal effect of genetically predicted MetS and its components on CES
Results of IVW demonstrate that MetS and its five components (WC, hypertension, FBG, TG, and HDL-C) are not significantly correlated to CES (all P > 0.05), while hypertension increases the risk of CES (OR: 55.51, 95%CI: 15.52–198.53, P = 6.48 ×10⁻¹⁰) (Supplementary Table 4). Causal association of MetS and its five components on CES visualizing in the scatter plots reveals that MetS, WC, FBG, TG, and HDL-C do not increase the risk of CES (Figure 2). Moreover, there is no sign of heterogeneity for MetS, WC, FBG, and TG according to findings of Cochran’s Q analyses (P > 0.05). Although heterogeneity for hypertension and HDL-C is detected in the Cochran’s Q analyses (P < 0.05), the funnel plots (Figure 3) suggest a symmetry of the MR results, indicating no signs of heterogeneity. No evidence of pleiotropy is observed in the MR-Egger analyses for MetS and its components (all P > 0.05) and MR-PRESSO analyses (all P > 0.05). The leave-one-out analysis obtains consistent results when leaving any SNP out in turn (Figure 4). Frost plots display the causal estimates from each IV on CES (Figure 5).
Causal effect of genetically predicted MetS and its components on SVS
As shown in Supplementary Table 5, a potential causal association of MetS and WC on SVS is observed (MetS: OR: 1.09, 95%CI: 1.00–1.19; P = 0.0441; WC: OR: 1.18, 95%CI: 1.01–1.39; P = 0.0471). Moreover, causal effect of genetically predicted hypertension and TG on SVS is significant (hypertension: OR: 77.43, 95%CI: 19.48–307.64; P = 6.43 × 10⁻¹⁰; TG: OR: 1.19, 95%CI: 1.08–1.31, P = 3.44 × 10⁻⁴). Causal association between FBG and SVS does not exist after performing CAUSE analysis (P > 0.05). HDL-C may be a protective factor for SVS (OR: 0.84, 95%CI: 0.77–0.92, P = 1.41 × 10⁻⁴). Scatter plots reveal that hypertension and TG increase the risk of SVS (Figure 2). Results of MetS, WC, FBG, TG, and HDL-C in Cochran’s Q tests reveal visible heterogeneity (all P values of Cochran’s Q test < 0.05). However, funnel plots (Figure 3) present a symmetrical MR analysis, indicating an absence of heterogeneity. No evidence of pleiotropy is observed in the MR-Egger analyses for MetS, WC, hypertension, TG, and HDL-C (all P > 0.05) and MR-PRESSO analyses (P > 0.05). Causal association between FBG and SVS is unsupported after being estimated by CAUSE (P = 0.65). In addition, the leave-one-out analysis suggests a robust causal association after removing any SNP in turn (Figure 4). Causal estimates for every IV on SVS are shown in Figure 5.
Causal effect of genetically predicted stroke on MetS and its components in the reverse MR analysis
Results of the IVW analysis (Supplementary Table 6–9 and Supplementary Figure 1) show that neither stroke nor IS, LAS, CES, and SVS are causally related to MetS and its five elements (all P > 0.05), except the association between stroke and hypertension. Stroke may have harmful effects on hypertension (OR: 1.03, 95%CI: 1.01–1.06, P = 2.13 × 10⁻⁴). Results of the MR-Egger and MR-PRESSO analyses reveal that no potential pleiotropy exists (all P > 0.05). Cochran’s Q analyses (all P > 0.05) and MR results in the funnel plots (Supplementary Figure 2) do not detect heterogeneity. Results of the leave-one-out analyses also remain stable (Supplementary Figure 3). Causal estimates from each IV on SVS are shown in Supplementary Figure 4.
Discussion
In our bidirectional MR analyses, we strengthen the evidence that MetS and its five components are important risk factors for stroke and its subtypes. Results in the reverse MR analyses reveal that liability to stroke is not associated with MetS and its components, even though stroke increases the risk of hypertension.
Although the definition or diagnostic of MetS have not been harmonized, it is widely recognized that MetS increases the risk of stroke. Epidemiological evidence has proposed that MetS is significantly correlated with increased risk of stroke8,23 For example, results of a 9.1-year follow-up of 5,171 subjects indicate that people with MetS had higher risk of stroke compared with those without (hazard ratio (HR) = 1.86). 23 Findings of a meta-analysis, including 16 cohorts with 116,496 samples, reveal that MetS is regarded as an independent hazard factor for stroke. 24 In our MR analyses, results supported the causal association between MetS and stroke. Moreover, research on the causal association of MetS on LAS, CES, and SVS is scant at present. This MR study first provides evidence that MetS increases the risk of LAS but not CES. MetS is significantly related to increased risk of SVS. For the reverse association, our MR results show that causal association between stroke and MetS does not exist.
For the elements of MetS, two large cohorts reported that WC is tightly correlated with increased risk of stroke among Westerners.25,26 However, evidence on association was inconsistent. A study in Japan only found positive relationships of WC within women. 27 Inconsistent results may be a result of race, lifestyle, severity of obesity, or some significant risk factors. In our MR analysis, we found that WC is closely associated with the risk of stroke, IS, and LAS, while a potential causal association is detected between WC and SVS and CES. Accumulating evidence suggests that higher FBG level significantly increases the risk of stroke and may be regarded as a predictor for stroke.28–31 A comprehensive meta-analysis of 102 observational studies suggests that FBG is closely associated with increased risk of stroke. 29 However, no significant relationship between higher FBG levels and stroke was identified in our MR analysis. Moreover, causal association between EBG and LAS is suggestive. Circulating lipoprotein was significantly associated with stroke. 32 Observational studies have suggested inconsistent results on the association among TG, HDL-C, and stroke; most of them have supported a direct relationship.33,34 By contrast, research on subtypes of stroke has been scant in most observational studies. An MR study has suggested that HDL-C is a protective factor for SVS, which is supported by our MR results. 35 Moreover, the current study does not support the causal association of genetically high TG on stroke and its subtypes. 35 However, we found that TG is positively related to the risks of LAS and SVS. This inconsistent result may be a result of sample size and parameters. Therefore, future studies with large sample size are required to explore the role of TG on stroke.
Although the clear mechanisms linking MetS and its components to stroke remain unclear, several possible explanations have been proposed. Some MetS-related changes lead to damages in the fibrinolysis competence, hyperglycemia, endothelium injury, and pro-inflammatory response, thereby possibly leading to aggravating cerebrovascular injury and further resulting in stroke. 36 Moreover, inflammatory processes of atherosclerotic change in vessels may play a significant role in the risk for stroke in persons with distinct elements of MetS, such as FBG and WC. Inflammation response may lead to vascular degradation and insulin resistance 37 and the release of endothelin-1 caused by resisting results in the constriction of the artery after stroke. 38 Therefore, inflammatory processes strike a significant effect on the link of MetS on increased risk of stroke.
Results of previous observational studies may have been influenced by numerous potential confounders, such as study design, limited sample size, or retrospective study in clinics. The strength of the MR study overcomes the underlying impact of confounding factors and yields causal inferences. Moreover, we performed bidirectional MR analyses to facilitate the understanding of the results. In addition, we solved the pleiotropy in our MR analysis. However, this MR study still has some limitations. First, the participants of LAS, CES, and SVS are relatively small. Second, bias derived from population stratification could not be ruled out. Lastly, the data sets originated from the European population, thereby limiting the generalization of the conclusion. In future studies, replication in other ancestries, more rigorous clinical study design, and large studies with more samples should be performed to verify the conclusions.
Conclusion
Our study supports the causal association between MetS and its five components and stroke and its subtypes. In the reverse MR analysis, no association was detected except the link between stroke and hypertension. Early management of MetS and its elements should be regarded as important measures in the first-class prevention of stroke.
Supplemental Material
sj-pdf-1-jcb-10.1177_0271678X231169838 - Supplemental material for Genetic insights into the risk of metabolic syndrome and its components on stroke and its subtypes: Bidirectional Mendelian randomization
Supplemental material, sj-pdf-1-jcb-10.1177_0271678X231169838 for Genetic insights into the risk of metabolic syndrome and its components on stroke and its subtypes: Bidirectional Mendelian randomization by Qiang He, Wenjing Wang, Hao Li, Yang Xiong, Chuanyuan Tao, Lu Ma and Chao You in Journal of Cerebral Blood Flow & Metabolism
Footnotes
Funding
The author(s) disclosed receipt of the following financial support for the research, authorship, and/or publication of this article: This study was supported by the 1·3·5 project for disciplines of excellence-Clinical Research Incubation Project, West China Hospital, Sichuan University (2018HXFH010).
Data availability statement
All data in our MR analyses is available from public databases.
Acknowledgements
We give the great appreciation to the participants and working staff for their excellent job to the study.
Declaration of conflicting interests
The author(s) declared no potential conflicts of interest with respect to the research, authorship, and/or publication of this article.
Authors’ contributions
Q.H and W.W analyzed the data and wrote the manuscript; H.L, Y.X, and Q.H interpreted the data; C.T, L.M and C.Y designed the study.
Supplemental material
Supplemental material for this article is available online.
References
Supplementary Material
Please find the following supplemental material available below.
For Open Access articles published under a Creative Commons License, all supplemental material carries the same license as the article it is associated with.
For non-Open Access articles published, all supplemental material carries a non-exclusive license, and permission requests for re-use of supplemental material or any part of supplemental material shall be sent directly to the copyright owner as specified in the copyright notice associated with the article.