
Abstract
Efficient nutrient assimilation into useful animal-derived products is the ultimate requirement for successful animal production. Infection in young growing animals can decrease energy and nutrient use required for growth rate by redirection of nutrients to support immune defense processes. Bovine leukemia virus (BLV) infection is prevalent in several regions of the world including the U.S. Most BLV infections are characterized by viral latency in the majority of infected cells. Few, if any, definitive studies in cattle have addressed the potential perturbations of gene expression induced in host cells by BLV infection. This study uses integrated global gene expression information and knowledge of the regulatory events in cells to identify transcription regulation networks that control peripheral blood mononuclear cell (PBMC) responses to BLV infection. The aim is to identify the molecular and cellular pathway responses that are functioning during the viral latency stage of BLV infection. The data and regulatory network analysis indicate that CDC25A and transcription factors such as STAT1 and STAT3 may serve as important signaling pathways for the BLV-induced cellular responses. These findings provide vital information for the functional role of genes that participate in PBMC responses to BLV infection and pinpoint these newly characterized genes as potential molecular targets and biomarkers for animal infectious diseases.
Introduction
Bovine leukemia virus/bovine leukosis virus (BLV) is a B-cell tropic deltaretrovirus that is genetically and structurally similar to human T-cell lymphotropic virus type I and II. Even though less than 10% of infected cattle will develop a fatal malignant lymphoma or lymphosarcoma, BLV induces a lifelong infection in lymphoid tissue in dairy and beef cattle. The majority of cattle infected with BLV remain clinically asymptomatic throughout their lives. About 30% of these will develop a persistent lymphocytosis, which is a benign condition characterized by a permanent expansion of the B-cell population in peripheral blood.1,2
BLV infection is prevalent in several regions of the world. In a 1996 study by the US Department of Agriculture's National Animal Health Monitoring System (NAHMS), blood samples from dairy cattle were tested using the Agar Gel Immuno-diffusion test (AGID). In a second 2007 study, bulk tank milk was collected and tested using Enzyme linked-immunosorbent Assay (ELISA). The authors screened several herds in the course of the two research projects and determined BLV to be prevalent in the majority of U.S. dairy operations. While the two studies used different testing methods, the results were consistent in showing a wide distribution of BLV. The reports also supported the concept that although the infection was common, the actual clinical signs of BLV were not frequently observed (http://www.aphis.usda.gov/vs/ceah/ncahs/nahms/dairy/dairy96/DR96blv.pdf; http://www.aphis.usda.gov/vs/ceah/ncahs/nahms/dairy/dairy07/Dairy2007_BLV.pdf).
Efficient assimilation of nutrients into useful animal-derived products is the ultimate requirement for successful animal production. When young growing animals encounter various infections, the energy and nutrients used for growth will decrease due to redirection of nutrient use for the support of immune defense processes. These fundamental perturbations will also be reflected in changes in gene expression. In the case of BLV infection, however, there is not yet any information regarding the nature of the potential gene expression changes that could be induced by BLV. BLV infection persists throughout the life of an animal in at least a portion of the infected cells, which indicates that the virus is at a transcriptionally silent stage. However, the manner by which host cells respond to this ‘silent infection’, especially in terms of gene expression, is still unclear.
Peripheral blood mononuclear cells (PBMCs) are blood cells that have a round nucleus similar to that of lymphocytes or monocytes. These cells are a critical component of the immune system with regard to fighting infections. PBMCs play a sentinel role, allowing the host to efficiently sense and adapt to the presence of threats such as BLV. In farm animals, the host response to infection involves a complex interaction between two genomes (the host and the pathogen) and the environment. Although some of the observed variation in natural resistance to infection is related to environment factors, a significant component appears to be genetic. 3 This study used integrated global gene expression information and knowledge of the regulatory events in cells to identify transcription networks controlling peripheral blood mononuclear cell (PBMC) responses to BLV infection and to identify the molecular and cellular pathways involved.
Materials and Methods
All calves used in these studies were born and reared at the U.S. Department of Agriculture Beltsville Agricultural Research Center (Beltsville, MD), and their use in the study and the associated protocols were pre-approved by the U.S. Department of Agriculture Beltsville Animal Care and Use Committee in regard to animal comfort, safety, and welfare. The animals were screened for BLV infection using a commercial testing service (Animal Health Diagnostic Center, College of Veterinary Medicine, Cornell University). The normal occurrence of BLV in the general cattle population tested is about 20% to 30%. Five BLV positive calves showing high titration with ELISA testing and five BLV negative calves were used for gene expression comparisons. Fresh blood samples from 10 animals were obtained immediately before the experiments.
Isolation of Total RNA
Total RNA was extracted using Trizol following the manufacturer's recommendations (Invitrogen). Trace genomic DNA in the crude total RNA samples was removed by incubation with 4-10 units DNase I per 100 µg total RNA (Ambion, Austin, TX) at 37 °C for 30 min. Total RNA was further purified using an RNeasy Mini kit (Qiagen, Valencia, CA). The concentration of the total RNA was determined using a NanoDrop ND-1000 spectrophotometer (NanoDrop Technologies, Rockland, DE) and RNA integrity was verified using a Bioanalyzer 1000 (Agilent, Palo Alto, CA).
Generation of Biotin-Labeled cRNA
Biotin-labeled cRNA was generated using a modified procedure of the Superscript Choice System (Invitrogen) for double-strand (ds) cDNA synthesis, followed by in vitro transcription. Briefly, the 1st strand cDNA was synthesized from 4.0 µg total RNA by 1.0 unit SuperScript II reverse transcriptase (Invitrogen) in the presence of 100 pmoles T7 promoter Oligo dT primer. After 2nd strand synthesis, the DNA was purified with a DNA Clean and Concentrator-5 kit (Zymo Research, Orange, CA) and eluted with 8 to 16 µl of deionized (dd) H2O. The recovered ds cDNA was further concentrated down to 3 µl in a vacuum centrifuge. The cRNA was synthesized with a MEGAscript in vitro Transcription kit (Ambion). The in vitro transcription reaction was carried out in a total volume of 23.0 µl, consisting of 3.0 µl ds cDNA, 2.3 µl 10X Ambion reaction buffer, 2.3 µl 10X Ambion T7 enzyme mix, and 15.4 µl NTP labeling mix (7.5 mM ATP, 7.5 mM GTP, 5.625 mM UTP, 5.625 mM CTP, and 1.875 mM biotin-16-UTP and 1.875 mM biotin-11 CTP). The in vitro transcription reaction mixture was incubated at 37 °C for ∼16 hours in a thermocycler. The cRNA was purified with an RNeasy mini kit (Qiagen). In general, 40 to 60 µg of cRNA could be obtained from 4.0 µg of total input RNA. The size range of the cRNA, expected to be between 300 to 3000 bp with the maximum intensity centered at least at 1000 bp, was verified using a Bioanalyzer 1000. The biotinylated cRNA was fragmented from 50 to 200 bp by heating in a buffer consisting of 40 mM Tris-acetate, pH 8.0, 100 mM potassium acetate, and 30 mM magnesium acetate at 95 °C for 35 min.
Oligonucleotide Microarray, Hybridization, Image Acquisition, and Data analysis
The bovine microarray platform used in this study has been described previously. 4 Briefly, a total of 45,383 unique bovine sequences, including 40,808 tentative consensus sequences (TCs) from The Institute for Genomic Research (TIGR) Bos taurus Gene Index (BtGI; http://www.tigr.org), and 4,575 singleton expressed sequence tags were used to construct high-density bovine oligonucleotide DNA microarrays. Oligonucleotides (oligos) were synthesized in situ using photo deprotection chemistry with the Maskless Array Synthesizer system (NimbleGen, Madison, WI). Each oligo synthesized represented a feature on the hybridization surface of the microarray, with four features for every oligo. The feature size for the microarrays was ∼16 X 16 µm, and there were ∼345,000 features within a 17 X 13 mm array area. Overall, the features were populated with two different 60-mer oligos designed for each TC and one oligo for each singleton (86,191 distinct oligos in total). There were eight features for each TC (2 oligos with 4 features per oligo) and four features for each singleton (1 oligo with 4 features per oligo).
Hybridization, image acquisition, and data analysis have been described previously. 4 The microarrays were scanned using an Axon GenePix 4000B scanner (Molecular Devices Corp., Union City, CA) at 5 µM resolution and the data were extracted from the raw images using NimbleScan software (NimbleGen, Madison, WI).
Functional and Pathways analysis
Gene regulatory networks were generated using the MetaCore analytical suite (Version 4.7, GeneGo, St. Joseph, MI). MetaCore is a web-based suite for functional analysis of experimental data in the context of a manually curated database containing the probability of having the protein interactions, protein-DNA interactions, canonical pathways, signaling pathways, and knowledge base ontologies of cellular processes, diseases, and toxicology. The experimental data in MetaCore can be subjected to enrichment analysis 6 in 6 functional ontologies: GeneOntology processes (GO), GeneGo process networks, Diseases, GeneGo Diseases, Canonical pathway maps, and Metabolic processes. Enrichment analysis in GO processes was used in this study. Enrichment analysis consisted of matching gene IDs for the common, similar, and unique sets of uploaded files with gene IDs in functional ontologies in MetaCore. The ontologies included canonical pathway maps, GeneGo cellular processes, GO cellular processes, and disease categories. The degree of “relevance” to different categories for the uploaded datasets was defined by p-values, so that the lower p-value received higher priority. Both enrichment analysis and the calculation of the statistical significance of networks were based on p-values, defined as the probability of a given number of genes from the input list matching a certain number of genes in the ontology folder. The p-values can also be defined, as described in the supplementary files of Shipitsin et al 7 as the probability of the network's assembly from a random set of nodes (genes) that are the same size as the input list. The whole data set of 411 genes was used to build networks using the Analyze Networks (AN) (transcription regulation) algorithm and the AN (Receptor, Transcription regulation and Transcription factors) networks algorithm, which generate sub-networks centered on transcription factors and receptors, respectively. The sub-networks were scored and prioritized based on relative enrichment, using the data from the input list and saturation with “canonical pathways” while using p-values and z-scores as statistical metrics. 7 Networks of interest were also further built by merging different networks.
Results
Microarray
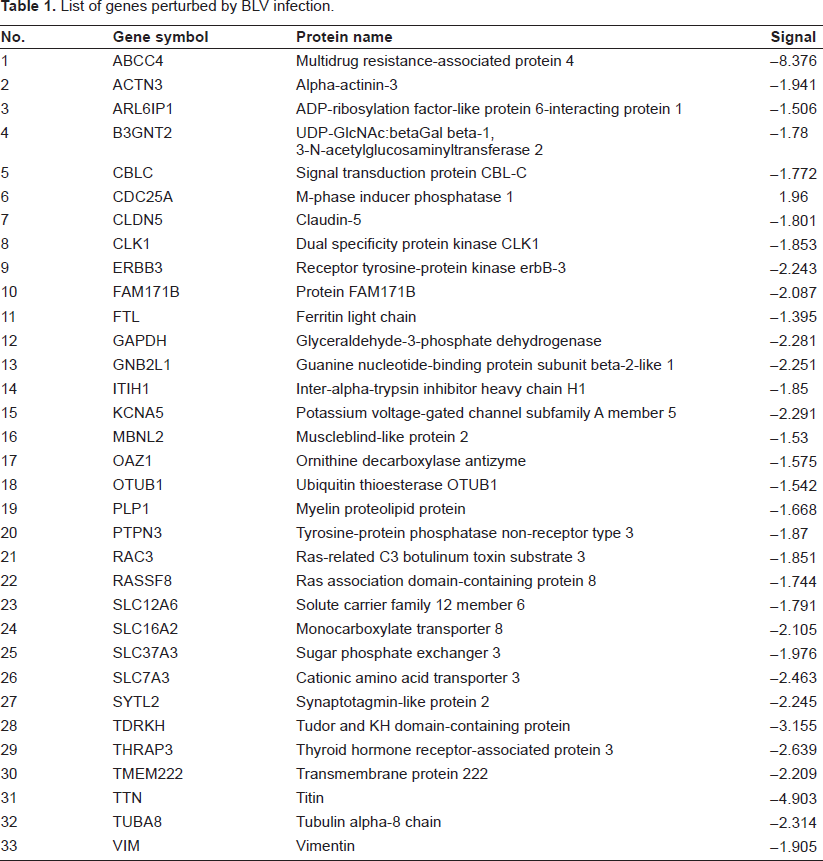
Gene expression profiling of PBMCs from five BLV negative and five BLV positive calves was analyzed by the bovine oligonucleotide microarray. 4 A total of 10 microarrays were used in the experiment. We identified 33 genes that were significantly altered by BLV at a very stringent false discovery rate = 0% (Table 1). In all 33 genes that were differentially expressed after LPS stimulation, 32 genes were down-regulated and only one gene was up-regulated. These data may reflect one of the characteristics of BLV infection, namely viral latency in the large majority of infected cells. Most of the genes in the PBMCs were not “altered” in their expression and were not affected by the BLV infection. Nonetheless, those genes play very important roles in biological functions and biological processes.
List of genes perturbed by BLV infection.
Analysis of Gene Regulatory networks
To further understand the molecular processes initiated following stimulation by LPS, the expression data were input into MetaCore and analyzed for transcription regulatory networks enriched with the expression data. The 464 genes altered with regard to expression were used as a list of input nodes and subjected to the Analyzed Networks (AN) Transcription regulation algorithm, AN Transcription factors algorithm, and AN Receptors algorithm.
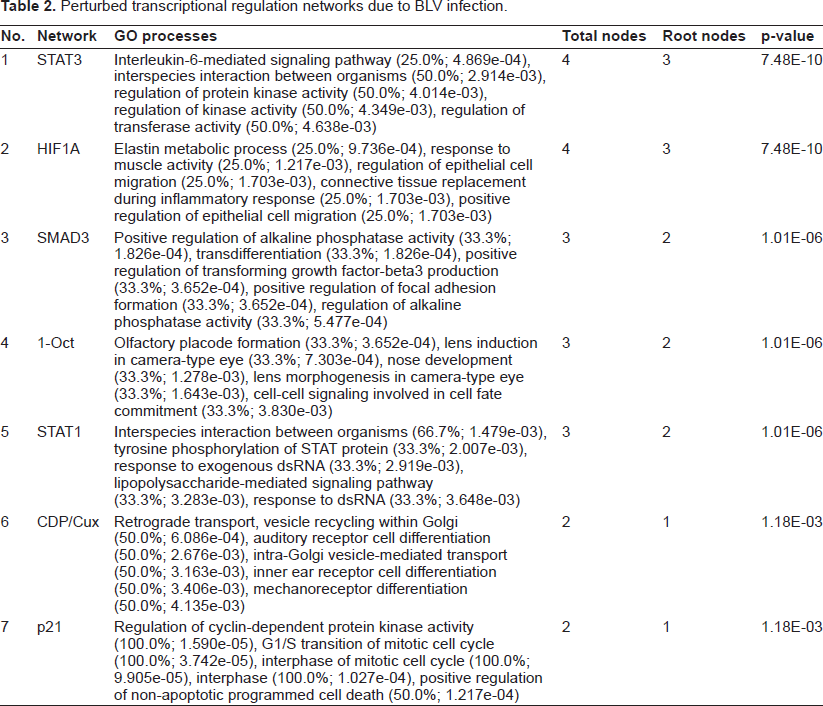
Analysis of the gene expression data in MetaCore using the transcription regulation algorithm results in 7 sub networks with a center of various transcription factors. These networks describe the functional relationships between gene products based on the known interaction reported in the literature. The 7 networks consisted of transcription factors that directly regulated the expression of downstream genes, with a total network size of 4 to 2 genes and p-values for network significance ranging from 7.46e−10 to 1.18e−3. Transcription factors STAT3, STAT1, H1F1A, SMAD3, and Oct-1 were centered as the hubs of the networks. All networks generated from AN transcription regulation algorithm are listed in Table 2.
Perturbed transcriptional regulation networks due to BLV infection.
The gene content of the perturbed genes detected by the microarray was used as the input list for generation of biological networks using Transcription regulation algorithm with default settings. These networks were built on the fly and were unique to our experimental data. To visualize the networks, three representative merged networks, in which transcription factors HIF1A, STAT3, and CDC25A functioned as the key object of the network, are shown in Figure 1, Figure 2, and Figure 3. Genes that were down-regulated due to BLV infection are marked with blue dots, while CDC25A, the only up-regulated gene in BLV positive cattle, is marked with a red dot. These networks appeared to function in some very important GO processes, such as regulation of transcription or cellular process. (See details in Table 2). The figure also shows the localization of the genes involved in the networks.

Merged biological networks generated using the Analyze etworks Transcription regulation Algorithm. Up-regulated genes are marked with red circles and down-regulated genes are marked with blue circles. cellular and subcellular localization of the gene products and network connections are shown in the left panel. The hub-centric layout of the networks is shown in the right panel. Three merged networks are centered with ESR1 (green), STAT3 (blue) and HIF1A (red).

Merged biological networks generated using the Analyze Networks Transcription regulation Algorithm. Up-regulated genes are marked with red circles and down-regulated genes are marked with blue circles. Cellular and subcellular localization of the gene products and network connections are shown in the left panel. The hub-centric layout of the networks is shown in the right panel. Three merged networks are centered with STAT1 (green), SMAD3 (red) and Oct1 (blue).

Biological networks generated using the Analyze networks Transcription regulation Algorithm. Up-regulated genes are marked with red circles and down-regulated genes are marked with blue circles. Cellular and subcellular localization of the gene products and network connections are shown in the upper panel. The hub-centric layout of the networks is shown in the lower panel. Two networks are shown in this figure: SMAD3 and p21.
Pathway analysis
Enrichment analysis consists of matching gene IDs for the common, similar, and unique sets of the uploaded files with gene IDs in functional ontologies in MetaCore. The ontologies include canonical pathway maps, GeneGo cellular processes, GO cellular processes, and diseases categories. The degree of “relevance” to different categories for the uploaded datasets is defined by p-values, so that the lower p-value gets higher priority.
Canonical pathway maps represent a set of about 500 signaling and metabolic maps covering human biology in a comprehensive way. The top 10 most significant pathways, based on the overrepresentation analysis (P < 0.05), are shown in Figure 4. The 5 most significant pathways were 1) cell adhesion; 2) Cytoskeleton remodeling-neurofilaments; 3) cytoskeleton remodeling-keratin filaments; 4) glycolysis and gluconeogenesis; and 5) G-protein signaling-Rac3 regulation pathway. Many of these pathways are involved in cell cycle progression, transcriptional regulation, apoptosis, and cell proliferation regulation (Fig. 4).

GeneGO Pathway Maps. The top scored maps (map with the lowest p-value) based on the enrichment distribution sorted by ‘Statistically significant Maps’ set with the lowest p-value and ordered by -log 10 of the p-value of the hypergeometric distribution.
Genego Process networks
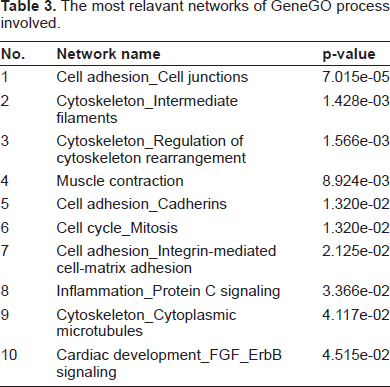
In order to explore the biological significance of BLV-induced gene expression in bovine PBMCs, the Gene Ontology (GO) classification was analyzed using MetaCore. There are about 117 cellular and molecular processes whose content is defined and annotated by GeneGo. Each process represents a pre-set network of protein interactions characteristic to the process. The most highly represented processes (Fig. 5), sorted by statistical significance, include 1) Focal adhesion formation; 2) cellular component assembly; 3) gluconeogenesis; 4) regulation of protein kinase activity; and 5) regulation of kinase activity. The gene content of the experimental data was used as the input list for generation of biological networks using the Analyze Networks (AN) algorithm with default settings. This is a variant of the shortest paths algorithm with main parameters of: 1) relative enrichment of the uploaded data, and 2) relative saturation of networks with canonical pathways. These networks are built on the fly and are unique to the uploaded data. The most relevant networks are listed in Table 3. One representative biological network generated using Analyze Networks (AN) algorithm with default settings is shown in Figure 6.

GeneGO Cellular Process Networks. Representation of the most significant biological process networks induced by BLV infection. sorted by Statistically significant Networks, ordered by -log 10 of the p-value of the hypergeometric distribution.

Representation of visualized relevant GeneGo networks, network of regulation of protein kinase activity. Up-regulated genes are marked with red circles and down-regulated genes are marked with blue circles.
The most relavant networks of GeneGO process involved.
Discussion
BLV infection is characterized by long latency and a low tumor incidence. The BLV genome encodes for a trans-regulatory protein, Tax, which induces viral transcription and transactivates cellular genes. 8 The transactivation activity of the Tax protein may be the fundamental cause of dysregulation of B-cells. In this preliminary study, the effects of BLV infection on cellular gene expression were investigated using microarray global genetic profiles of gene expression. Using integrated global gene expression information and knowledge of the regulatory events in cells, we also identified transcription regulation networks controlling peripheral blood mononuclear cell (PBMC) responses to BLV infection and identified the molecular and cellular pathways involved in the viral latency stage of BLV infection.
Few, if any, definitive studies in cattle have addressed the potential perturbations of gene expression induced in host cells by naturally occurred BLV infection. Two similar studies using microarray technology have studied BLV induced gene expression in host cells; however, because a bovine specific DNA microarray was not yet available, a human microarray or a cross-species ovine-to-human gene-profiling approach was used.9,10 Another significant difference is that B-cell clones transfected with retroviral vector-mediated delivery TaxBLV were used in one of the experiments. To the best of our knowledge, this is the first study that has used PBMCs from naturally BLV infected cattle, as well as microarray technology with a bovine microarray platform to identify potential deregulation of gene expression due to BLV infection.
DNA microarray technology has advanced the identification of a large number of genes involved in the complex cellular responses to viral infection as well as to tumors. In both situations, cell homeosta-sis is deregulated. Approximately 70% of cattle that become BLV positive are ‘nonprogressors’ in that they have a quiescent infection and remain asymptomatic for life. This phenomenon may be reflected in our microarray data, which only detected 33 genes that were deregulated. Nevertheless, the genes with altered expression in BLV positive PBMCs have important functions in cell division, signal transduction, and regulation of gene expression.
The gene for cell division cycle 25 A was the only up-regulated gene. Cell division cycle 25 (CDC25) phosphatases play key roles in eukaryotic cell cycle control. They are responsible for the activation of the cyclin-dependent kinases (CDK) at specific stages of the cell cycle. 11 CDC25 homologues are also the central targets and regulators of the G2/M checkpoint mechanisms activated in response to DNA damage. 12 The expression and activity of these enzymes is finely regulated by multiple mechanisms including post-translational modifications, interactions with regulatory partners, control of their intracellular localization, and cell cycle-regulated degradation. 13
Disrupted expression of CDC25A is associated with checkpoint bypass and genetic instability. Accordingly, increased expression of CDC25A and CDC25B is found in many high-grade tumors and is correlated with poor prognosis in human cancers. Several upstream regulatory genes or oncogenes, such as BrbB3, RACK1, SYTL2 and Otubain1, are down-regulated in BLV positive PBMCs. These genes are major components of the transcription networks that are perturbed in BLV positive PBMCs. This finding triggers interesting questions that we could not answer here, pertaining to the nature of these down-regulated genes and whether they were related toBLV infection or to the cell defense mechanisms. Nonetheless, these data provide direct evidence that BLV-infection induces altered expression of genes of importance. These genes provide a series of interesting candidates that may play pivotal roles in mediating the phenomenon of BLV-related latency and pathogenesis.
As an important part of this report, the global gene expression data (global expression profiling) generated with microarray technology were evaluated systemically using MetaCore (GeneGo, Version 4.7) in the context of Gene Ontology classification and gene regulatory networks. MetaCore is a very powerful tool with which we systematically interrogate, model, and iteratively refine our knowledge of the regulatory events inside the cells. These analyses revealed that various transcription factor genes are induced by BLV in bovine PBMCs. They also presented updated knowledge on signaling cascades that integrate activation of various transcription factors into functional gene networks. With MetaCore, we not only defined the specific sub-networks but also identified highly connected transcription factors (hubs of the network). Pathway analysis on the BLV-induced genes in bovine PBMCs using MetaCore successfully identified remarkable changes in the genetic networks related to the nucleotide and nucleic acid metabolic process, gene expression, transcription, regulation of transcription, and apoptosis. One of the important and novel findings of this study was the analysis results obtained from using the AN transcription regulation algorithm. The data and regulatory network analysis indicate that CDC25A and transcription factors such as STAT1 and STAT3 may serve as parts of an important signaling pathway for the BLV-induced cellular response. This signaling pathway may directly target the regulatory gene network centered on STAT1 and STAT3, which plays an important role as both the divergence and convergence hub. These two transcription factors are the active components of transcription regulation in the network. The interaction between CDC25A and p21, a potent cyclin-dependent kinase inhibitor that functions as a regulator of cell cycle progression at the S phase, may also play an important role in maintaining the viral latency in infected PBMCs. These important findings certainly are the leading direction for our future study, which will now aim to biologically confirm those findings and to understand the mechanism(s) of how these genes are regulated during the BLV infection at latent stage.
In conclusion, global gene expression profiling and computational pathway analysis provide detailed knowledge of changes in gene expression induced by BLV in PBMCs. This knowledge will provide a basis for understanding the molecular mechanisms of cellular response induced by BLV in bovine PBMCs.
Disclosures
Mention of trade names or commercial products in this publication is solely for providing specific information and does not imply recommendation or endorsement by the U.S. Department of Agriculture.
The authors report no conflicts of interest.