
Abstract
In this study, we report that immortal mouse embryonic fibroblasts (I-MEFs) have a baseline level of cells positive for alkaline phosphatase (AP+) staining. Environmental stresses, including long-lasting growth in the absence of expansion and treatment with drugs, enhance the frequency of AP+ I-MEFs. By adapting fast red AP staining to the sorting procedure, we separated AP+ and AP– I-MEFs and demonstrated that the differentially expressed genes are consistent with a reprogrammed phenotype. In particular, we found that sestrin 1 is upregulated in AP+ I-MEFs. We focused on this gene and demonstrated that increased sestrin 1 expression is accompanied by the growth of I-MEFs in the absence of expansion and occurs before the formation of AP+ I-MEFs. Together with sestrin 1 upregulation, we found that AP+ I-MEFs accumulated in the G1 phase of the cell cycle, suggesting that the two events are causally related. Accordingly, we found that silencing sestrin 1 expression reduced the frequency and G1 accumulation of AP+ I-MEFs. Taken together, our data suggested that I-MEFs stressed by environmental changes acquire the AP+ phenotype and achieve a quiescent state characterized by a new transcriptional network.
Introduction
Organisms and cells exhibit plasticity, the ability to alter their phenotypes in response to environmental changes. If the physiological cues are not removed, then a reprogrammed transcriptional network is activated. 1 Undifferentiated embryonic stem cells (ESCs), induced pluripotent stem cells, embryonic germ cells, and embryonic carcinoma cells display elevated alkaline phosphatase (AP) expression.2–5 The cell differentiation state can also be monitored by the detection of APs 6 along with stem cell markers, such as the transcription factors Oct-3/4, NANOG, and Sox-2, 7 and surface markers, such as SSEA-1, SSEA-3, SSEA-4, TRA-1-60, and TRA-1-81. 8 Thus, it seems that AP positivity is able to mark a state of reprogramming. Environmental changes can induce novel phenotypes that are characterized by reprogrammed transcriptional networks. 9 While senescence impairs reprogramming to pluripotent cells, 10 either a nonfunctional p53 or a disrupted p53/p19ARF signaling axis can convert cells to pluripotency. 11 We previously demonstrated that the p53 and p53/p19ARF signaling axes are inactive and disrupted, respectively, in immortal mouse embryonic fibroblasts (I-MEFs). 12 Therefore, we exploited this cell model to determine whether reprogramming occurs spontaneously and whether reprogramming can be induced in I-MEFs. Assuming that AP staining is specific for detecting reprogrammed cells, we report data indicating that AP+ I-MEFs are a subpopulation that can be expanded by environmental stresses. The hypothesis that this AP+ phenotype is induced to face environmental changes is discussed.
Materials and Methods
Reagents
The following reagents were used in this study: DMEM high glucose (DMEM-HG), DMEM low glucose (DMEM-LG), RPMI 1640, penicillin/streptomycin, fetal bovine serum (FBS) (EuroClone), phosphate-buffered saline (PBS) tablets (AMRESCO), paraformaldehyde (PFA), crystal violet (CV), fast red (FR), Tris-HCl, NaCl, MgCl2, methanol, propidium iodide (PI) solution, l-glutamine, PBS, sodium citrate, NP40, RNase (Sigma-Aldrich), INTERFERin (Polyplus Transfection), fludarabine (fu) (Teva Pharmaceutical Industries Ltd.), NBT (4-nitro blue tetrazolium chloride), NBT/BCIP stock solution, HNPP Fluorescent Detection Set (Roche Diagnostics), miRNeasy Mini Kit, QuantiTect Reverse Transcription Kit, QuantiFast SYBR Green PCR Kit (QIAGEN), and TrueSeq RNA Sample Preparation Kit (Illumina).
Cells and culture conditions
I-MEFs were previously described by Rizzo et al. 12 The melanoma A375 cell line identity was earlier demonstrated by Marranci et al. 13 Both cell types were grown in DMEM-HG with 10% FBS and incubated at 37°C in a humidified atmosphere containing 5% CO2. The experiments were performed by adopting the long-lasting propagation protocol (LLPP), a scheme specific for studying the biological effects of long-lasting growth of mammalian cells in the absence of expansion. Briefly, I-MEFs were seeded at a density of 8 × 10³ cells/cm2. Every three days (LLPP-3, LLPP-6, and LLPP-9 days), the cells were counted and used for biological and molecular assays.
AP assay
Both I-MEFs and A375 cells were seeded in culture dishes at a density of 8 × 10³ cells/cm2. The next day (LLPP-1 day), one dish was used to determine the cell number per dish, and another dish was used to detect AP+ cells as follows. The growth medium was removed and the cells were washed once with PBS, after which they were fixed in 2% PFA in PBS for 15 minutes. Thereafter, PFA was removed, and PBS was added for 10 minutes and then replaced with AP buffer for 15 minutes. The staining solution (AP buffer + NTB) was added, and the dish was incubated in the dark for at least 30 minutes. Then, the staining solution was removed. After washing the dishes with tap water, they were air-dried and used for AP+ cell detection.
FR/AP assay
I-MEFs were seeded at a density of 3 × 10⁵ cells in a 100 mm diameter culture dish. The cells were collected 48 hours later, centrifuged, and processed using HNNPP Fluorescent Detection Set (Roche Diagnostics) according to the manufacturer's instructions. Briefly, the pellet was suspended in 500 μL reaction buffer 4 and incubated for 10 minutes on ice. Ten, the cell suspension was centrifuged and suspended in 500 μL buffer 4 + HNPP/FR TR. For the control sample, FR TR was omitted from the reaction. After 40 minutes, the reaction was stopped by centrifugation, and the pellet was washed with and resuspended in PBS. The resulting cell suspension was analyzed within one hour using a FACSCalibur flow cytometer (BD Biosciences). The reaction product generated after dephosphorylation (HNPP/FR TR) is a highly fluorescent precipitate that accumulates during the reaction.
Cell sorting procedure
I-MEFs were seeded at a density of 3 × 10⁵ cells in a 100 mm diameter culture dish (20 dishes) and grown according to LLPP-6 days. The cell population was harvested, centrifuged at 1200 rpm for 15 minutes, and suspended in 10 mL buffer 4. Aliquots of 1 × 10⁶ cells were centrifuged and suspended in 500 μL buffer 4 + HNPP/ FR TR. After incubating the cells for 30 minutes at 4°C, the reaction was stopped by centrifugation. Then, the samples were washed once with PBS, unified, suspended at a density of 1 × 10⁷ cells/mL, and passed through a cell sorter apparatus (FACSAria III Cell Sorter; BD Biosciences).
Next-generation sequencing (NGS)
Global gene expression was obtained using NGS technology. Total RNA was extracted using a miRNeasy Mini Kit (QIAGEN). RNA samples with RIN (RNA integrity number) > 8 were used to construct cDNA libraries using a TrueSeq RNA Sample Preparation Kit (Illumina) according to the manufacturer's suggestions. cDNA libraries were loaded at the four-plex level of multiplexing (∼30 million reads per sample) into a flow cell, V3, and sequenced in single-read mode (50 bp) on a HiSeq 2000 (Illumina) by IGA Technology Services, Udine, Italy. The relative expression of each gene was estimated as the fraction of reads mapping to its exons after normalizing for a gene length of 20 nucleotides, known as reads per kilobase per million mapped reads (RPKM). To select the differentially expressed genes, we removed the genes with low expression values (RPKM <0.5) in at least one sample, and we calculated the fold change (FC) between AP– and AP+ I-MEFs. Then, to reduce variability, all ratio values were log2 transformed.
Functional enrichment analysis
To assess the biological significance of genes that are differentially expressed between FR-AP+ and FR-AP– cells, we used the overrepresentation tool available in ConsensusPathDB 21 mouse version MM9, a web-based interface, to browse and search functional categories, interactions, and pathways enriched among a list of genes. To test for similarities between FR-AP+ cells and ESCs, we used network and enrichment analyses available in the ESCAPE database, 14 which is a collection of human and mouse embryonic stem cell-related experimental
Cell proliferation
To measure cell proliferation, 2.5 × 10⁴ I-MEFs or A375 cells were seeded in a 12-well plate. At specified time points, the cells were fixed in 2% PFA in PBS, stained with 0.1% CV, and dissolved in 20% methanol for 15 minutes. Then, the cells were washed once with tap water and dried at room temperature. Next, the dye was extracted with 10% acetic acid, and the optical density (OD 590 nm) of the solution was detected using a plate reader apparatus (SpectraCount; Hewlett-Packard) to measure cell proliferation.
Cell cycle
At specific time points, samples of 5 × 10⁵ I-MEFs were fixed in 95% ethanol, stained with PI (50 μg/mL), and incubated overnight at 4°C. DNA content profiles were detected using a FACSCalibur flow cytometer.
Colony-forming ability (CFA)
Both I-MEFs and A375 cells were seeded at a density of 1 × 10³ cells in a 100 mm diameter culture dish and allowed to form colonies. Thereafter, the dishes were stained according to the AP assay, and the AP colonies were counted. Then, the dishes were restained with CV for one hour, and the colonies were again counted. The frequency of AP+ colonies was obtained by determining the ratio of the number of AP colonies/number of CV+ colonies.
Flu treatment
I-MEFs and A375 cells were seeded at cell densities of 8000/cm2. After 24 hours, the cells were exposed to increasing concentrations of flu for 48 hours. The concentration of 10 μg/mL flu was selected to inhibit cell proliferation.
qRT-PCR
Total RNA was extracted from 1 × 10⁶ I-MEFs using a miRNeasy Mini Kit (QIAGEN), following the manufacturer's recommendations. To quantify the expression of the different AP isoforms and sestrin 1, 1 μg of total RNA was reverse transcribed using a QuantiTect Reverse Transcription Kit (QIAGEN). Quantitative real-time PCR (qRT-PCR) was performed using a Rotor-Gene 2-Plex (QIAGEN) and a QuantiFast SYBR Green PCR Kit. All reactions were performed in triplicate following the amplification scheme: 95°C 5 minutes, 40 cycles 95°C 10 seconds, 58°C 20 seconds, and 72°C 10 seconds. Transcript values were normalized to those obtained from the amplification of the internal control (GAPDH). The following oligonucleotides were used: mouse liver/bone/kidney (L/B/K)-AP, forward (F) (5′-CGGATCCTGACCAAAAACC-3′) and reverse (R) (5′-TCATGATGTCCGTGGTCAAT3′); mouse sestrin 1, F (5′-TGTCCCAACGTTTCGTGTC-3′) and R (5′-TGGATAGAGACGATTCACCAGA-3′)
Transfection with siRNAs
I-MEFs were seeded at a density of 1.5 × 10⁵ cells in a 60 mm diameter culture dish. The next day, the I-MEFs were transfected with either a negative control (siNC, 5′-UUCUCCGAACGUGUCAC-GUTT-3′ and 5′-ACGUGACACGUUCGGAGAATT-3′) or anti-sestrin 1 (siSES, 5′-AGUGGCUCAAUGGUUUA-GAUU-3′ and 5′-UCUAAACCAUUGAGCCACUUU-3′) siRNAs using INTERFERin according to the manufacturer's recommendations or only INTERFERin (mock). After six hours, complete medium was added to the dishes, and the I-MEFs were grown according to the LLPP scheme. At the LLPP-3 and LLPP-6 time points, one portion of the I-MEFs was used to isolate RNA and quantify sestrin 1 mRNA. Another portion was stained with either FR to determine the fraction of FR+ I-MEFs or PI to detect the DNA expression profiles.
Statistical analysis
Data were analyzed using GraphPad Prism (GraphPad Software). Significant differences were determined by an unpaired
Results
Spontaneous and induced frequencies of I-MEFs with the AP phenotype
Because cells with either a nonfunctional p53 or a disrupted p53/p19ARF signaling axis can undergo reprogramming following environmental changes, 15 we maintained I-MEFs in the same dish for nine days according to the LLPP, a scheme specific for studying the biological effects of long-lasting growth in mammalian cells in the absence of expansion. 12 Then, the I-MEFs were stained with either CV (Fig. 1A) or AP (Fig. 1B), which showed that a fraction of the I-MEFs was positive for AP staining. To determine the spontaneous and induced frequencies of AP+ I-MEFs, I-MEFs were grown according to LLPP, and AP+ I-MEFs were counted every three days. For counting, we developed a FR-AP staining procedure that allows the cytofluorimetric detection of FR-AP+ I-MEFs. At LLPP-1, the percentage of FR-AP+ I-MEFs was ∼25%, which increased over time (Fig. 1C), reaching a plateau at LLPP-6 (Fig. 1D).

Identification and characterization of cells with the AP+ phenotype. I-MEF monolayers were expanded according to LLPP and stained with CV (A) or AP (B) to determine whether a fraction of I-MEFs acquired the AP+ phenotype. The frequencies of FR+/AP+ cells determined at LLPP-1, LLPP-3, and LLPP-6 (C) and quantified until LLPP-9 (D) indicate that the formation of AP+ cells is LLPP dependent. The fluorimetric detection of FR+/AP+ cells was performed with the FACScan apparatus. The sequential AP (E) and CV (F) staining of I-MEF colonies shows that 30% of CV+ I-MEF colonies are AP+ I-MEF colonies (G).
Sensitivity of AP+ I-MEFs to a DNA-damaging drug
Thus far, the biochemical function of AP+ I-MEFs and their role in normal physiology remain unclear. 5 To verify whether cells with the AP+ phenotype have a biological role, we tested their sensitivity to DNA-damaging agents. Because I-MEFs are no longer viable after staining with either AP or FR–AP, we could not directly test the drug sensitivity of AP+ I-MEFs. However, using the sequential AP and CV staining described above, we were able to distinguish AP+ (Fig. 1E) and CV+ (Fig. 1F) colonies and demonstrate that 15.8% of CV+ colonies are AP+ colonies (Fig. 1G). We exposed the I-MEFs to 10.0 μg/mL of flu for 48 hours, which is a drug that preferentially blocks the progression of cells toward S phase and then induces cell death. 16 As expected, cell proliferation was inhibited (Fig. 2A), and treated I-MEFs formed fewer CV+ colonies than untreated I-MEFs (Fig. 2B). Of note, the frequency of AP+ colonies was higher in treated I-MEFs than in untreated I-MEFs (Fig. 2C), suggesting that I-MEFs with the AP+ phenotype were less sensitive to DNA damage. To verify whether AP+ cells are present in other cell types, we tested several tumor cell lines and found that many were able to form AP+ colonies (Table 1). In particular, when the melanoma cell line A375 was exposed to flu, these cells showed reduced cell proliferation (Fig. 2D) and CFA (Fig. 2E), similar to I-MEFs exposed to flu. Additionally, the frequency of AP+ colonies was higher in treated cells than in untreated cells (Fig. 2F). Overall, these data indicate that cells with the AP+ phenotype have a reduced sensitivity to DNA damage. If so, detection of the gene expression profiles would clarify which genes and pathways are involved in modulating the drug sensitivity of cells with the AP+ phenotype.

Biological characterization of AP+ I-MEFs and A375 cells. The proliferation (A) and CFA (B) of I-MEFs are reduced by fludarabine, whereas the frequency of AP+ I-MEF colonies is higher in treated cells than in untreated cells (C). The proliferation (D) and CFA (E) of A375 cells are reduced by fludarabine, whereas the frequency of AP+ A375 colonies is higher in treated cells than in untreated cells (F).
Frequencies of AP+ colonies in human tumor cell lines.a

Most tumor cell lines were grown in DMEM-HG with 10% FBS. DU-145 cells were grown in RPMI 1640 with 10% FBS. HeLa and SW620 cells were grown in DMEM-LG with 10% FBS.
Received from D. Taverna, University of Turin, Italy.
Gene expression profiles of AP and AP I-MEFs
To discover the differences between AP– and AP+ I-MEFs, we harvested I-MEFs at LLPP-6. At that time point, the induction of cells with the AP phenotype reached the highest value (Fig. 1D). One fraction of the collected cells was unstained (Fig. 3A) to set up the sorting apparatus, and the rest was stained with FR-AP to determine the gates appropriate to separate AP– and AP+ I-MEFs (Fig. 3B). To control the quality of sorting, we quantified the expression of the AP isoforms and found that the L/B/K-AP isoform was differentially expressed in the AP+ I-MEF RNA sample (Fig. 3C). Next, we determined the mRNA profiles of these cells with NGS technology. In total, 315 upregulated genes and 259 down-regulated genes were identified. Genes were considered upregulated or down-regulated with FC > 2.0 or <2.0, respectively (Supplementary Table 1). Because we interpreted the positive AP staining as indicative of reprogramming, we investigated whether the differentially expressed genes have any relationship with the embryonic stem cell transcriptome. We used the enrichment and network analyses available in the ESCAPE database,
14
which collects data from different genome-wide studies of mouse and human embryonic cells. Interestingly, we found that both the down- and upregulated genes in AP+ I-MEFs are associated with key regulators of embryonic stem cell pluripotency (KLF4, POU5F1, NANOG, and SOX-9) (Fig. 3D and E and Supplementary Table 2), suggesting that AP+ I-MEFs resemble pluripotent cells to some extent. In addition, to highlight the functionally enriched pathways and gene ontology terms for biological process (GO BP) in which these genes are involved, we used the overrepresentation tool available in ConsensusPathDB. The complete list of overrepresented GO BP terms with

Sorting of AP+ I-MEFs. The appropriate gates for sorting were established using unstained (A) and FR-stained (B) I-MEF populations. L/B/K-AP relative expression shows that the mRNA is expressed more in sorted FR+/AP+ cells than in FR–/AP– cells (C). A graphical representation of the results of enrichment pathways using network analysis is available in the ESCAPE database for the upregulated (D) and down-regulated (E) genes in AP+ I-MEFs. Red nodes are for differentially expressed genes, and yellow nodes are for the key regulators of pluripotency of embryonic stem cells. A list of the biological processes enriched among differentially regulated genes (F). The ConsensusPathDB was used for this analysis.
Supplementary Tables 4 and 5 show the list of pathways enriched among the down- and upregulated genes, respectively. Among GO BP terms, we found that the regulation of cell communication and signal transduction was particularly well represented (Fig. 3F). The down-regulated genes were involved in the cytokine, TGF-beta, NOD1/2, and Notch signaling pathways, while the upregulated genes were associated with Wnt and p53 signaling pathways. In particular, sestrin 1 (NM_001013370), which is a p53 target 17 , 18 belonging to the p53 signaling pathway, was upregulated. This finding, which was surprising because p53 protein is nonfunctional in I-MEFs, 12 prompted us to focus on sestrin 1.
Functional analysis of the sestrin 1 gene
First, we detected the expression of sestrin 1 on the various LLPP days. Compared to LLPP-1, we observed that sestrin 1 was upregulated on LLPP-3 and LLPP-6 (Fig. 4A), whereas L/B/K-AP upregulation was clear only on LLPP-6 (Fig. 4B). In addition, cell cycle analysis of LLPP-1, LLPP-3, and LLPP-6 cells showed an accumulation of cells in G1 phase (Fig. 4C), suggesting a link between sestrin 1 upregulation and G1 accumulation. Second, we silenced sestrin 1 using an appropriate siRNA (siSES) and grew siSES cells according to the LLPP. We observed that the sestrin 1 level decreased in siSES-3 cells compared to both mock-3 and siNC-3 cells, indicating that the siSES worked (Fig. 5A). Moreover, we observed that sestrin 1 expression increased in both mock-6 and siNC-6 cells and to a lesser extent in siSES-6 cells, suggesting that the silencing of sestrin 1 had a long-lasting effect (Fig. 5A). At the LLPP-3 and LLPP-6 time points, the mock, siNC, and siSES cells were stained with FR for the cytofluorimetric detection of AP+ cells. While mock (Fig. 5B) and siNC (Fig. 5C) cells showed LLPP-dependent increases in AP+ cells, siSES cells showed a reduced frequency of AP+ cells at both LLPP-3 and LLPP-6 (Fig. 5D), suggesting that sestrin 1 knockdown inhibited the formation of AP+ cells. Finally, cells collected at LLPP-3 and LLPP-6 were stained with PI to detect the DNA content profiles. At LLPP-3, cells with aberrant DNA content (<2C) were observed in mock (Fig. 5E), siNC (Fig. 5F), and siSES (Fig. 5G) cells. Compared to LLPP-3, the percentage of aberrant cells decreased in mock-6 and siNC-6 cells at LLPP-6, whereas this percentage only slightly decreased in siSES-6 cells (Fig. 5H).
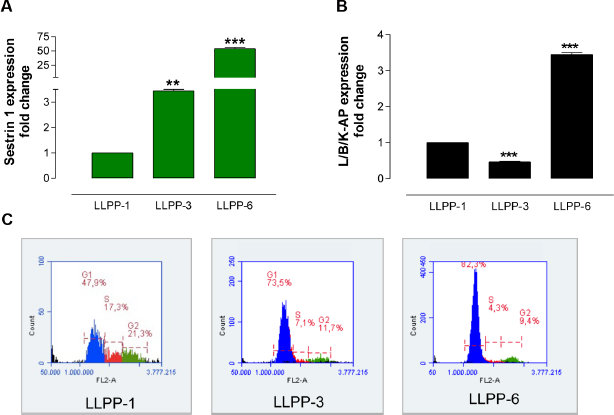
Molecular and cytological effects induced by LLPP. qRT-PCR of sestrin 1 (A) and L/K/B-AP (B) at LLPP-1, LLPP-3, and LLPP-6 shows that the expression of both genes is LLPP dependent. Cell cycle analysis of I-MEFs at LLPP-1, LLPP-3, and LLPP-6 (C) shows the accumulation of cells in the G1 phase.

Molecular and cellular effects of sestrin 1 silencing. The expression of sestrin 1 in mock, siNC, and siSES cells at LLPP-3 and LLPP-6 shows that sestrin 1 is efficiently and stably silenced (A). The data were normalized to mock cells at LLPP-3. The cytofluorimetric analysis and quantification of AP+ I-MEFs at LLPP-3 and LLPP-6 time points of mock (B), siNC (C), and siSES (D) cells indicate that sestrin 1 silencing reduced the frequency of FR+/ AP+ cells in siSES cells more than that in mock and siNC cells. The DNA content profiles of mock (E), siNC (F), and siSES (G) cells at LLPP-3 show the appearance of cells with DNA content <2C (G1 cells). The detection of cells with aberrant DNA content at LLPP-6 shows that the aberrant cells, while absent in mock and siNC cells, were persistent in siSES cells (H).
Discussion
In this study, we report that exponentially growing I-MEFs have a baseline level of AP+ cells and that the long-lasting growth of I-MEFs in the absence of expansion (LLPP scheme) enhances the frequency of AP+ cells above the baseline level. This finding suggests that the AP+ phenotype is induced by metabolic stress. Moreover, we report that selected samples of AP+ cells and AP– cells showed several differentially expressed genes (Supplementary Table 3), suggesting that the AP+ cells have a reprogrammed transcriptional network. In support of this view, we report that both the down- and upregulated genes are associated with either key regulators of embryonic stem cell pluripotency (Fig. 4A and B and Supplementary Table 2) or signaling pathways, such as TGF-beta, NOD1/2, Notch, Wnt, and p53. This pleiotropic transcriptional activity strongly suggests that the AP+ phenotype is a pluripotent phenotype.
An additional novelty of this study is that the AP+ phenotype that arose during LLPP was accompanied by sestrin 1 upregulation. During the propagation of primary MEFs in culture, the accumulation of reactive oxygen species (ROS), with the consequent induction of cellular (DNA and protein) damage, is responsible for senescence. 19 p53 has a central role in senescence induction. Sestrins are p53 targets 17 , 18 that are stress inducible and protect cells against various insults. 20 Sestrins have dual biochemical functions as antioxidants that control the activity of peroxiredoxins, which scavenge ROS, 21 and as inhibitors of targets of rapamycin complex 1 signaling. 18 , 22 Therefore, sestrins may provide critical feedback regulation that adjusts metabolic and stress responses to different environmental cues. 23 We show that upregulation of sestrin 1, induction of cells with the AP+ phenotype, and accumulation of noncycling cells are all LLPP-dependent effects. A possible model is that LLPP-induced damage upregulates sestrin 1, favoring the entry of cells into cell cycle arrest (quiescence state) and the acquisition of a transitional reprogramming state. This model is supported by the results obtained from knocking down sestrin 1. In fact, sestrin 1 silencing reduced the percentage of noncycling AP+ cells that was balanced by the formation of cells with aberrant DNA content (<2C). Presumably, these cells are damaged cells that, being sestrin 1 defective, escaped the quiescent state and the damage repair occurring at that state. Because I-MEFs are devoid of p53 activity, 12 we can argue that sestrin 1 exerts the functional role that p53 has in holding damaged cells in G1 phase to be repaired.
Conclusion
In conclusion, we show that I-MEFs acquire the AP phenotype to manage environmental changes. To this end, these cells may undergo a transient transcriptional reprogramming that allows AP+ cells to either survive or differentiate depending on which environmental changes are to be managed.
Author Contributions
Conceived and designed the experiments: ME, GR. Analyzed the data: MEB. Wrote the first draft of the manuscript: GR. Contributed to the writing of the manuscript: MR, LP, AT. Agree with manuscript results and conclusions: ME, MEB, MR, AT, LP, MP, GR. Jointly developed the structure and arguments for the paper: LP, MR, GR. Made critical revisions and approved final version: ME, MEB, MR, AT, LP, MP, GR. All authors reviewed and approved of the final manuscript.
Supplementary Materials
Supplementary table 1
Upregulated (log2(FC) ≥ 1) and down-regulated (log2(FC) ≤ –1) genes in AP/FR+ I-MEFs were identified by RNA-seq. B1, RPKM calculated in AP-I-MEFs; B2, RPKM calculated in AP+ I-MEFs. The FC was calculated by dividing B2 by B1.
Supplementary table 2
The results of the enrichment analysis available in the ESCAPE database using the list of genes differentially expressed in AP+ I-MEFs. Details regarding the terms in these tables have been described previously by Xu et al. 14
Supplementary table 3
The results of the overrepresentation analysis available in ConsensusPathDB (the list of overrepresented GO BP terms with
Supplementary table 4
The results of the overrepresentation analysis available in ConsensusPathDB (the list of pathways enriched among down-regulated genes in AP+ I-MEFs with
Supplementary table 5
The results of the overrepre-sentation analysis available in ConsensusPathDB (the list of pathways enriched among upregulated genes in AP+ I-MEFs with