
Abstract
Serially-sampled nucleotide sequences can be used to infer demographic history of evolving viral populations. The shape of a phylogenetic tree often reflects the interplay between evolutionary and ecological processes. Several approaches exist to analyze the topology and traits of a phylogenetic tree, by means of tree balance, branching patterns and comparative properties. The temporal clustering (TC) statistic is a new topological measure, based on ancestral character reconstruction, which characterizes the temporal structure of a phylogeny. Here, PhyloTempo is the first implementation of the TC in the R language, integrating several other topological measures in a user-friendly graphical framework. The comparison of the TC statistic with other measures provides multifaceted insights on the dynamic processes shaping the evolution of pathogenic viruses. The features and applicability of PhyloTempo were tested on serially-sampled intra-host human and simian immunodeficiency virus population data sets. PhyloTempo is distributed under the GNU general public license at https://sourceforge.net/projects/phylotempo/.
Keywords
Introduction
The evolutionary and demographic history of a measurable evolving viral population 1 can be inferred by phylodynamic analysis of longitudinally sampled sequences. 2 In particular, the shape of a phylogenetic tree often reflects the characteristics and the interactions among evolutionary and ecological processes. For example, phylogenies of viruses under continuous positive selection, such as inter-host influenza or intra-host human immunodeficiency virus (HIV), usually exhibit a marked staircase-like topology.3,4 Pathogens under weak or absent positive selection show a more balanced tree shape, as it happens within the measles serotypes. 5 Trees displaying a star-like topology or increasing root to tip distance with sampling time are typical of an exponentially growing population, whilst the opposite pattern can usually be associated to constant or decreasing population sizes, as for example in Dengue virus inter-host phylogenies. 6 Phylogenetic tree shapes can also be coupled with phenotypic traits (either numeric or categorical) or geographic correlates (such as geographic origin of sampled strains), which can be analyzed via comparative methods in terms of evolutionary or spatiotemporal dynamics. 7
Several statistical approaches exist for determining if and how serially sampled sequences evolve under a strict or relaxed molecular clock.8,9 However, such methods do not give indications about the phy-logenetic tree shape (eg, staircase- or star-like) and the related temporal structure (eg, if sequences sampled at the same time point tend to cluster together and to be direct ancestors of sequences sampled at later time points).
There are various functions for describing the topological features of a phylogenetic tree. Some of these measures consider both topology and branch lengths of a tree, as well as phenotypic tip traits,10–12 while others evaluate only the tree topology in relation to geographic or phenotypic characters associated with the sampled strains.13–15 Finally, there are purely topological measures based on tree symmetry/balance.16–19
The temporal clustering (TC) is a recently developed statistic, which takes into account phyloge-netic tree topology and sampling time of the tips. 20 The TC statistic assesses the temporal structure of a phylogenetic tree, by evaluating the order of time changes from internal nodes to tips. It is based on the maximum parsimony reconstruction of ancestral characters implemented in phylogeography, 13 but it has been modified to prevent the estimation of temporally impossible state changes in tip dated trees (ie, an earlier time point emerging from an ancestor assigned to a later time point). It also allows the comparison of phylogenies inferred from data sets including different number of times points and/or sampled sequences per time point. Currently, there is no available software implementation of the TC statistic, although it can be calculated with a series of manual steps using the MacClade program (http://macclade.org/).
In this work, we present PhyloTempo, the first software implementation of the TC statistic. PhyloTempo is written in R, a free software environment for statistical computing and graphics (http://www.r-project.org/). Along with the TC implementation, several other tree topological measures were integrated in PhyloTempo using pre-existing R libraries, in a user-friendly graphical framework. The program was tested on several longitudinally sampled intra-host HIV and simian immunodeficiency virus (SIV) population data sets. The results showed how the comparison of the TC statistic with other topological measures can provide multifaceted insights on the dynamic processes shaping the evolution of pathogenic viruses.
Methods
The original formulation of the TC statistic
20
requires a phylogenetic tree with n taxa sampled at t different discrete time points. A state (ie, time) transition matrix is then defined, where the cost of going from later to earlier time points is infinite (ie, time-irreversibility). The other costs are usually defined as integer linearly increasing with the time points ordering. Ancestral tree states are inferred using Fitch's parsimony algorithm.
21
A non-normalized TC score is then calculated by summing all the state changes across the tree branches according to the cost matrix weights. A tree with a perfect temporal structure, ie, a tree in which all tips sampled at time point t
i
are monophyletic and directly emerge from time point ti-1, would have a non-normalized TC equal to t-1. Conversely, a tree with the least temporal structure would have a maximal non-normalized TC, equal to the sum of the n number of taxa multiplied by the corresponding w weights of the cost matrix, ie, Max = Σ
t
j = 1 n
j
w1j. The normalized TC rescales the non-normalized TC value in the interval [0,1], by considering a background distribution of TC statistics obtained by shuffling the time points associated to the tree tips (keeping the topology fixed) and re-estimating the ancestral characters. Specifically, the normalized TC statistic is

Coupled with the TC statistic, PhyloTempo includes also the following tree topology measures and tests of hypothesis: Aldous’ graphical test and lilkelihood ratio test to decide if tree fit the Yule or the uniform models; 22 Colless’ and Sackin's shape statistics, both under the Yule or uniform hypotheses; 23 cherry count; 24 Pybus’ gamma. 25 In addition, a simple tree statistic called “staircase-ness” is introduced, counting the proportion of sub-trees that are imbal-anced (ie, sub-trees where the left child contains more leaves than the right child, or vice-versa) compared against the distribution of such proportions obtained from random trees. See the supplementary material for the properties of this measure.
Implementation
All the code has been written in the R language. Besides the standard core library set of R, the following R libraries have been used (including their dependencies): “ape”, “ade4”, “phybase”, “phylobase”, “phangorn”, “doBy”, “infotheo”, “apTreeshape”, “diversitree” (http://www.r-phylo.org).
The required input of PhyloTempo is a phylogenetic tree file in “newick” format and a two-column text file in which each tip name present in the phylo-genetic tree is associated with its corresponding time of sampling (a numeric value such as days or years).
The input phylogenetic tree is preliminarily checked for polytomies, which are resolved randomly. If present, negative branch lengths are set to zero and then all branch lengths are added a 10−5 value. The tree is rooted on the tip that gives the highest linear correlation between the root-to-tip distance and the sampling time of the tip, and finally it is ladderized. The vector of sampling times is then discretized into time intervals by using an equal-frequency binning, where the optimal number of bins is the square root of the vector size. The maximum allowed number of discrete time intervals is nine, and each time bin needs to contain at least two tips.
The TC statistic calculation is made upon the previous theoretical description. However, in this new implementation the ancestral characters are estimated using maximum likelihood 26 rather than parsimony. A major advantage of maximum likelihood is that it also allows for an optimized estimate of the weights of the transition cost matrix.
The number of tip randomizations is set to 300 by default, but the value can be modified by the user. All the other tree statistics are assembled by combining existing R functions.
Both graphical and text output are produced, where figures are plotted in multiple windows, text is printed in the R command-line window and results are saved in a tabulated file. The graphical plots include: the phylogenetic tree with ancestral character state probabilities drawn with pie charts at internal nodes; the TC statistic compared versus the randomized background distribution; a linear correlation plot between the sampling times of tips and root-to-tip distances; a Kruskal-Wallis test comparing distribution of root-to-tip distances with the discretized time points; the staircase-ness, Aldous’, Sackin's and Cherry count statistics with the corresponding background randomizations. The text output reports the aforementioned results as well as the P-values from the statistical tests. Also, a script that allows the analysis of multiple trees in “nexus” format, from an a posteriori, eg, trees as output from MrBayes, 27 or bootstrap analysis has been made available.
PhyloTempo is distributed under the GNU general public license and is available at https://sourceforge.net/projects/phylotempo/ for download.
Results
PhyloTempo has been tested on different viral data sets. The first data set included intra-host HIV-1 phylogenetic trees, inferred from serially sampled envelope (env) C2-V5 sequences, from nine untreated subjects with fast disease progression, 4 named as the “Shankarappa” data set after the first author of the paper. The second data set included intra-host SIV trees, inferred from env gp120 sequences sampled longitudinally from four experimentally infected Rhesus macaques that were CD8-depleted before infection and progressed to AIDS within 75-118 days post infection. 28 The third data set included intra-host HIV-1 gag p24 trees from six untreated subjects enrolled in the OPTIONS cohort 29 all carrying the HLA-B*5701 allele strongly associated with slower disease progression, that were followed longitudinally from early infection up to seven years. 30
Summary of PhyloTempo output from different proof-of-concept data sets.

, Pearson's linear correlation; SC, staircase-ness; dN/dS, ratio between non-synonymous and synonymous substitutions; TC, temporal clustering statistic.
The average TC statistic for the Shankarappa data set was 0.29 (st.dev 0.10), for the SIV data set was 0.11 (st.dev 0.09). The OPTIONS data set, based on the highly conserved HIV-1 gag p24 gene, allowed us to evaluate the effect of including or excluding identical sequences and resulted in a TC value of 0.27 (st.dev 0.11) and 0.36 (st.dev 0.19) when analyzing all sequences or only unique sequences, respectively.
Figures 1 and 2 illustrate the PhyloTempo graphical output. In detail, Figure 1 shows two of the trees analyzed (OPTIONS and the SIV data sets, respectively), and includes the maximum likelihood estimate of the ancestral time states, with state probabilities reported as pie charts at each internal node. Figure 2 reports the placement of the TC statistic, as well as all the other tests, with respect to background random distributions or null hypotheses. In addition, the correlation plot between the root-to-tip distances and the sampling time is shown, along with the box-plots of the root-to-tip distances stratified by the time intervals.
PhyloTempo graphical output showing the ancestral character estimation on an input phylogenetic tree. PhyloTempo graphical output summarizing phylogenetic tree shape statistics.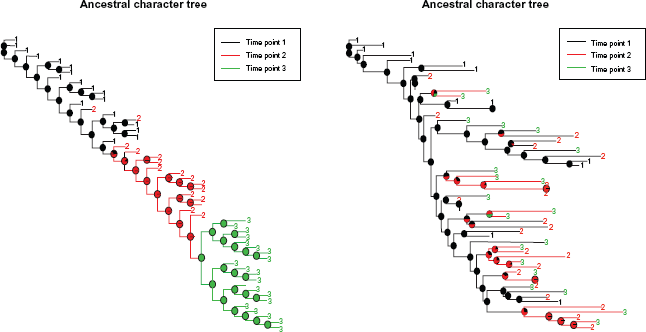

On average, the running time of PhyloTempo on an input phylogenetic tree with 100-150 leaves (3-4 time points and 300 randomizations) takes less than 5 minutes using a standard desktop computer. Running times for trees of 300 or 400 tips increase to half or one hour.
Discussion
In this paper we presented PhyloTempo, a set of scripts in the R language that calculates the TC clustering statistics and other measures of phylogenetic tree shape, with a comprehensive text and graphical output. The choice of the R software environment gives to the tool the advantage to be available for many platforms (Microsoft Windows, Mac, or Linux) and, since R features a plethora of libraries both for phylogenetic analysis and graphics, to be ready for the inclusion of other functions related to the analysis of phylogenetic tree shape and comparative statistics.
Although other programs that calculate tree shape statistics are available, such as the java application TreeStat (http://tree.bio.ed.ac.uk/software/treestat/), and Path-O-Gen (http://tree.bio.ed.ac.uk/software/pathogen/), as well as several command-line functions in R, this is the first that implements the TC statistic merging in a user-friendly interface both graphical and text outputs. In addition, PhyloTempo is capable of generating an a posteriori TC statistic, reading a tree ensemble in “nexus” format, such as the output by MrBayes (http://mrbayes.sourceforge.net/). As a future perspective in the context of Bayesian analysis, a theoretical approach to derive an analytical formula for the TC statistic is advisable, allowing the avoidance of the time-consuming tree randomization for each tree.
Two interesting biological insights are evident from the present analysis. First, TC does not correlate with any previously described topological tree measure implying that the new statistic evaluates aspects of the evolutionary process not captured by other methods. Second, TC does not correlate with estimated dN/dS ratios in different data sets. Several studies have interpreted temporally structured phylogenies as evidence of sequential viral population bottlenecks driven by continuous selection pressure.2,4,31,32 The trees inferred from the OPTIONS data sets include HIV-1 sequences from patients with the HLA-B*5701 allele that has been associated with slower disease progression, possibly due to strong positive or purifying selection driving viral escape from cytotoxic T lymphocyte recognition. 33
Interestingly, the TC calculated for the OPTIONS data sets are not significantly different (P = 0.21 from a t-test) from those calculated for the Shankarappa data sets. The finding suggests that temporally structured genealogies may reflect intra-host evolutionary processes that are similar in two groups of patients characterized by different rates of disease progression and that may not be related to selection pressure. However, it is important to point out that the subjects in the Shankarappa data set were followed for a shorter period of time than the OPTIONS subjects, and that the intervals between longitudinal samples were overall shorter in the first data set (data not shown). The low TC values for the Shankarappa data set may simply reflect an incomplete turnover of the viral quasispecies, which can require up to 22 months, 34 causing an intermix of sequences sampled at different time points. Moreover, archival viral strains expressed in cellular reservoirs would decrease the temporal structure of serially sampled genealogies, because sequences from later time points may share a most recent common ancestor with sequences collected much earlier in infection. 35 Therefore, the TC statistic could be a powerful tool to investigate the extent and impact of latent viral reservoirs in intra-host HIV-1 evolution. Finally, it is interesting to note that the SIV data sets show the lowest TC values. This may be the result of the relatively short time of infection in these animals, as well as a consequence of the depletion of CD8+ T cells right after infection. 28
In conclusion, the present work describes a practical and user-friendly implementation of a novel statistic to evaluate the shape of phylogenetic trees, inferred from longitudinal samples of measurably evolving viral populations, which can provide significant insights on underlying evolutionary processes linked to infection dynamics and pathogenesis.
Author Contributions
Conceived and designed the experiments: MMN, AK. Analysed the data: MCFP. Wrote the first draft of the manuscript: MMN, MCFP. Contributed to the writing of the manuscript: MS. Agree with manuscript results and conclusions: MS, RRG, AK. Jointly developed the structure and arguments for the paper: MCFP, MMN, MS. Made critical revisions and approved final version: MCFP, MMN, RRG, AK, MS. All authors reviewed and approved of the final manuscript.
Funding
MCFP and MS were supported by the University of Florida award UL1 RR02989 and the 2012 EPIG grant, and by the NIH/NINDS R01 grant NS063897-01A2. MMN and ACK were supported by grants from the Swedish Research Council (K2010-56X-20345-04-3), Karolinska Institutet, Åke Wibergs Foundation (40418186), and the Swedish Society of Medicine (SLS-101021).
Footnotes
Supplementary Material
The staircase-ness measure counts the (i) proportion of sub-trees that are imbalanced (ie, sub-trees where the left child contains more leaves than the right child, or vice-versa). An alternative formulation (ii) is to make the average of all the min(l, r)/max(l, r) values of each sub-tree, where l and r are the number of leaves in the left and right children of a subtree. In this work we compared the staircase-ness values against the distribution of such proportions obtained from random trees. However, there are also a few properties of this measure that are worth to be analyzed analytically. First of all, the staircase-ness of perfectly balanced binary trees is always zero, whichever formulation is used. On the other hand, the staircase-ness of perfectly imbalanced trees (ie, ladder-like trees) is always one when counting the proportions (ie, formulation i), whilst depends on the number of leaves when performing the average (ie, formulation ii). Specifically, the staircase-ness values for perfectly imbalanced trees using formulation (ii) is
The distribution of the staircase-ness values obtained by simulating random trees (function rtree(number_of_tips, branchlength = runif(1)) of the R library “ape”) does not pass the Shapiro-Wilk normality test (P<<0.0001, even by considering only trees with a number of tips >300), neither resembles a Gamma distribution, whose parameters had been fit on the actual data (P<<0.0001, using a Kruskal/Wallis test on simulations). However, the average values of both definitions values look stable across all the tree sizes (Fig. S1), while the standard deviation seems to decrease by increasing the tree size. The limits of the average staircase-ness values for formulation (i) and (ii) are close to 0.61 and 0.64, respectively.
Distribution of staircase-ness values from random trees (5,000 simulations), by varying tree size (from 3 to 2,000 leaves).
In regards to the OPTIONS cohort, the University of California, San Francisco (UCSF) Committee on Human Research and the Regional Ethical Council in Stockholm, Sweden (2008/1099-31), approved this study and all patients provided written informed consent.