
Abstract
The increasing availability of high throughput sequencing technologies poses several challenges concerning the analysis of genomic data. Within this context, duplication-aware sequence alignment taking into account complex mutation events is regarded as an important problem, particularly in light of recent evolutionary bioinformatics researches that highlighted the role of tandem duplications as one of the most important mutation events. Traditional sequence comparison algorithms do not take into account these events, resulting in poor alignments in terms of biological significance, mainly because of their assumption of statistical independence among contiguous residues. Several duplication-aware algorithms have been proposed in the last years which differ either for the type of duplications they consider or for the methods adopted to identify and compare them. However, there is no solution which clearly outperforms the others and no methods exist for assessing the reliability of the resulting alignments. This paper proposes a Monte Carlo method for assessing the quality of duplication-aware alignment algorithms and for driving the choice of the most appropriate alignment technique to be used in a specific context.
The applicability and usefulness of the proposed approach are demonstrated on a case study, namely, the comparison of alignments based on edit distance with or without repeat masking.
Introduction
The increasing availability of genomic data has recently boosted new lines of research towards accurate analysis at whole genome level of evolutionary mutation mechanisms. The common practice of sequence comparison relies on algorithms derived from the edit distance model, 1 which is based on the assumption of statistically independent elementary mutation events involving single nucleotides. The edit distance between two sequences represents the minimum effort required to transform a sequence into the other by means of elementary operations (insertion, deletion, and substitution of single nucleotides). Edit costs are assigned with each elementary operation according to the likelihood of the corresponding evolutionary event. The results of the comparison (in terms of edit distance and sequence alignment) are strongly affected by the edit costs provided to the algorithm. In order to obtain biologically sound results, edit costs should be characterized on a set of confirmed alignments between sequence pairs representative of the evolutionary process under study. In practice, however, standard settings are used because of the lack of confirmed experimental data which are truly representative of the target sequences. On the other hand, in most cases the results of sequence alignment cannot be cross-validated, so that the suitability of the edit cost settings cannot be assessed ex post. In absence of a method for either characterizing the edit costs or validating the results, a methodology should be applied to assess the accuracy and reliability of the sequence alignment algorithm (together with its configuration parameters) in the context of interest.
Recent findings highlighted the role of tandem duplications as main insertion mutation events: in particular (through a comparative analysis of human, chimpanzee and rhesus genomes) it has been shown that short (from 1 to 100 base pairs) tandem duplications account for the majority of insertion events in the human genome. 2 Since tandem duplication events involve more than one nucleotide at the time, the application of traditional alignment algorithms to sequences containing tandem repeats (TRs) might lead to misleading results because of the invalidity of the nucleotide independence assumption. 3 This observation has prompted for the development of new sequence alignment methods that take into account underlying biologically motivated mechanisms, such as, for instance, short tandem duplications.
Taking TRs into account during the comparison of biological sequences raises several challenges: i) the definition and detection of TRs, ii) the choice of a suitable representation, and iii) the development of repeat-aware alignment algorithms.
In general, a TR is the effect of a tandem duplication of a motif, which is the repeated unit. Since biological sequences are the result of random mutation events, the effects of tandem duplications can be masked by subsequent mutations affecting one or more repeat units that become different from the original motif. Mutated repeat units are called variants, while TRs containing more variants are called approximate TRs. Mutations of the repeat pattern are not the only source of variability of TRs. Indeed, the presence of repeated patterns facilitates DNA replication slippage, which in turn alters the number of repeats.4,5
The lack of a common agreed definition of TR (which is particularly controversial in case of approximate TR) is the main difficulty that has to be faced when dealing with tandem repeat detection. Needless to say, different definitions have led to the development of different algorithmic solutions to the detection problem.6–10 Recent works have shown that the different techniques are not equivalent, in that they lead to significantly different results.11,12
Repeat-aware sequence comparison can be performed at two levels of granularity: the coarse-grained problem consists of aligning two sequences that possibly contain TRs, while the fine-grained problem consists of aligning two TRs. The state of the art in scientific literature can be summarized as follows: solutions to coarse-grained problems 13 allow to align sequences that may contain TRs but they incur heavy computational burdens and make simplifying assumptions on the mutation type and order; solutions to fine-grained problems14,15 allow alignments according to more accurate evolutionary models but they rely on the availability of TRs defined a priori.
An alternative approach is provided by repeat masking techniques. 16 Instead of using repeat-aware alignment algorithms, a pre-processing step is used to filter out duplications that might impair the significance of edit distance. Traditional alignment algorithms are then applied to the filtered sequences.
The multi-faceted nature of the problem of sequence comparison and the abundance of different approaches available to tackle it motivate the development of tools and methods to drive the choice of the most appropriate approach to be adopted in a specific context.
This paper introduces a new methodology for assessing the significance and accuracy of alignment algorithms. A Monte Carlo approach is used to simulate evolutionary events which produce pairs of annotated sequences starting from a pseudo-random common ancestor. Sequences are properly annotated, during simulation, in order to trace back each sequence to its ancestor, and each nucleotide to its original position. This enables the definition of significance metrics which represent the evolutionary likelihood of the results provided by sequence comparison/alignment algorithms on the synthetic benchmarks.
We remark here that aim of the paper is the introduction of a method rather than the implementation of a comprehensive evolutionary simulator. In fact, our framework has been conceived as an open simulation tool which can be extended by modeling other evolutionary events and introducing the corresponding specific parameters. For instance, one could take into consideration the organization of nucleotides into higher order patterns, instead of assuming a basic random nucleotide model. It should be also straightforward to account for more subtle substitution models, where the type of mutated character depends on the residue to be replaced instead of being independent from it. The development of a thorough evolutionary simulator is beyond the scope of this work. Rather, we decided to keep the number of parameters to the minimum value required to validate the methodology and conduct a meaningful sensitivity analysis. In fact, any specific mutation event would add to the parameter space, making it harder to conduct a thorough exploration. Since the proposed approach is aimed at assessing the performance of alignment algorithms, it is worth adding specific phenomena to the evolutionary simulator only if they are targeted by the alignment algorithms under study.
The contribution of the work is three-fold. First, in the Quality Metrics section, we define three quality metrics (namely, significance ratio, selectivity, and ranking error) for evaluating the quality of the results produced by pair-wise alignment algorithms. Metrics provide a measure of the capability of the algorithm under study to correctly align homologous nucleotides and to properly identify in a database the entry which is the most biologically related to the query. Second, in the Metric Estimation section, we introduce a Monte Carlo simulation approach for generating annotated synthetic benchmarks to be used for computing quality metrics. A new pseudo-random sequence-evolution simulator has been developed to this purpose, since existing tools17,18 do not provide a suitable support to duplication events and they are focused on testing complex evolutionary hypothesis, rather than on validating pairwise alignments. Third, in the Results and Discussion section, we demonstrate the applicability of the proposed methodology by conducting a comparative analysis between traditional edit-distance and repeat-masking algorithms under different evolutionary conditions and parameter settings. The results highlight the usefulness of repeat-masking techniques and demonstrate the capability of the proposed approach to capture the dependence of significance metrics on the probabilities of the mutation events (including duplications and TR extensions), thus providing a tool for driving the choice of the most appropriate alignment algorithm and parameter settings to be used under specific evolutionary hypotheses.
Quality Metrics
Pairwise alignment aims at arranging two sequences in such a way that homologous bases/residues take the same position in the alignment. According to the evolutionary interpretation, two bases/residues are homologous if they derive from the same base/residue of a common ancestor.
The scoring functions used to drive sequence alignment are usually characterized on a sample of verified alignments in order to reward biologically-significant alignments against random alignments. Since ancestral sequences are usually unknown, the actual significance of the alignments between biological sequences cannot be assessed in practice. Such an assessment can be performed, however, on synthetic benchmarks obtained as the result of a simulated evolutionary process starting from a given ancestor. The assessment procedure will be outlined in the next subsection. Here we assume that such a procedure exists and we introduce the metrics to be used for assessing the significance of the alignment algorithms under test.
Definition 1
Given two sequences which share a common ancestor, the
Definition 2
Given a query sequence s 1 and a database of M sequences containing only one sequence (namely, s2) homologous to s1, all the entries of the database are ranked according to the score of their pairwise alignment with s1. The
All the metrics defined above take values in the [0, 1] interval. While S is a statistical parameter (namely, a probability), R and E are defined as the outcomes of a single experiment, so that their expected values have to be estimated in order to evaluate the quality of a given alignment algorithm. The Monte Carlo approach outlined in the next section will be used to this purpose.
It is worth mentioning that ranking error resembles the Z-score introduced to assess the statistical significance of pairwise global alignments. 19 However, while the Z-score is used to evaluate the likelihood of a biological relation between two aligned unknown sequences, the ranking error introduced in this paper makes use of known (pseudo-random) sequences to assess the performance of the algorithm used for comparison.
Metric Estimation
Quality metrics are estimated on a set of synthetic benchmarks generated by means of the Monte Carlo simulation approach detailed hereafter. Each benchmark is constructed as follows. First, a set of M random DNA sequences of N nucleotides are generated in order to be used as known ancestors, denoted by s0, s1, …, SM–1. Two descendants are then derived from each ancestor by simulating a random evolution process characterized by the following parameters: the insertion (pins), deletion (pdel and mutation (pm) probabilities, the duplication probability (pd), the probability of extending an existent TR (pe), the maximum size of a repeat unit (L), and the evolution time (T). Point mutations include single nucleotide mutations and indels, duplications represent generations of tandem repeats of size l, randomly chosen from 1 to L, while TR extensions are duplications of the repeat unit of an existent TR.
Each evolution step (of one time unit) is simulated by parsing the input string and by tossing a coin at each position to decide which transformation to apply (if any), according to the given probabilities. The process is repeated T times to obtain a time-T descendant of the original string.
The two descendants of the i-th ancestor will be hereafter called left and right descendants, and denoted by
Figure 1 reports the pseudo-code of procedure descendant () which takes in input the ancestral sequence sa and the evolution time T and returns the descendant (sd) computed according to the pseudo-random simulation process outlined above. Any sequence (say, s) is represented by means of a data structure (namely, SEQ), which contains the number of elements (s->N), the array of characters (s->el []), and an array of integer numbers (s->pos []) representing the position of the elements in the original (ancestral) sequence. Annotated positions will be used to compute significance ratios.
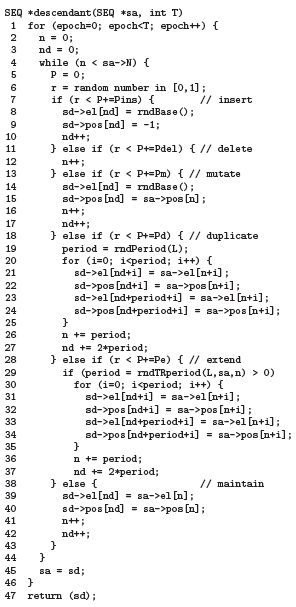
Pseudo-code of descendant().
The inner loop of descendant () is nothing but a roulette-wheel mechanism used to select the mutation to apply at each position and at each epoch to obtain sequence sd from sequence sa according to the given mutation probabilities. In case of duplications or extensions, the new copy of the repeat unit retains not only the symbols, but also the annotated positions of the template. Duplication/extension periods are selected by two specific functions (namely, rndPeriod () and rndTRperiod ()) which take into account the maximum size of a repeat unit specified when launching the simulator (L) and the actual TRs found in sa at current position. While duplications occur whenever the corresponding case is selected by the roulette-wheel (so that function rndPeriod () simply returns an integer number randomly selected between 1 and L), extensions also require an existing TR to be found in sa (so that the period returned by function rndTRperiod (), the pseudo-code of which is reported in Figure 2, is chosen among those of the TRs existing at current position n). Hence, extension probability pe has to be regarded as a conditional probability.

Pseudo-code of rndTRperiod().
In case of a mutation, the current element of sd is assigned with a random base returned by rndBase () (which implements a simple roulette-wheel to choose one of the 4 DNA bases, given their relative frequencies), while its ancestral position is taken from sa. Finally, in case of an insertion, a random element is added to sd with no ancestral position (ie, sd->pos [n1] = –1). Since the mutation possibly injected by the roulette-wheel mechanism at each iteration (ie, at each epoch, at each position) are mutually exclusive events, we must guarantee that the sum of their occurrence probabilities is less than 1 to keep the process consistent. In symbols: pins + pdel + pm + pe + pd < 1. Needless to say, this is a realistic assumption.
The process is repeated for T epochs. The new sequence produced at a given epoch becomes the template for the subsequent one.
Once a benchmark has been built, consisting of M sequences with left and right descendants, quality metrics are computed for a given alignment algorithm. The significance ratio (R) is computed for every pair of left (
Selectivity (S) and ranking error (E) are computed on a database containing all the right descendants and queried by each left descendant. The alignment algorithm under test is used to assign a score with each entry compared with the query. Entries are then sorted according to their scores. By construction, the database contains only one sequence related to the query. Hence, the algorithm is said to be selective if it succeeds in singling out the sequence related to the query. The relative frequency of success computed over the results of the M queries provides an estimate of the selectivity (Ѕ). As for the ranking error, according to Definition 2, it is computed as on the results obtained for query

The expected values of the quality metrics (E[R], E[S], and E[E]) are estimated by averaging the values of Ṝ, Ѕ, and Ē computed over a set of NB benchmarks.
Results and Discussion
This section reports the results of the experiments conducted to demonstrate the usability and usefulness of the proposed approach. Although the results provide a comparative evaluation of the alignment methods used as case studies, a thorough comparison among the available alignment techniques is beyond the scope of this work. Rather, case studies are used to show the sensitivity of the proposed quality metrics both to the features of the algorithms under test and to the parameters of the target sequences.
Benchmarks
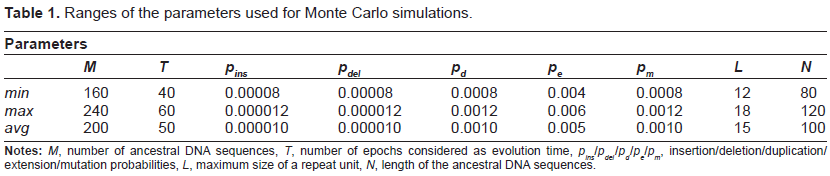
According to the process described in the Metric Estimation section, a set of NB = 200 synthetic benchmarks were generated in a neighborhood of a representative point of the parameter space (which we call baseline). For each benchmark, the actual values of the parameters were randomly chosen in the ranges reported in Table 1 together with the corresponding baseline values (row labeled avg). On average, each benchmark was composed of 200 ancestral sequences of 100 nucleotides each, giving rise to 400 descendants reaching an average length of about 200 nucleotides in T = 50 evolution epochs.
Ranges of the parameters used for Monte Carlo simulations.
Case study
We applied as a case study a repeat-masking technique8,16 to filter out TRs from the sequences under comparison before applying a standard edit distance algorithm with unit edit costs. 8 In particular, we chose mreps 8 (a widely known TR-finder) as a masking tool to pre-process the synthetic sequences generated according to the above detailed procedure. mreps allows us to specify a given number of input parameters, two of which are of particular interest for our study, namely, an integer value called resolution (res) and a boolean flag named allowsmall. The resolution parameter controls the degree of fuzziness of repeats to be found. The higher the resolution, the more degenerate (ie, approximate) are the repeats extracted by mreps. The allowsmall option is a filter that controls the inclusion/exclusion of short TRs (which can be in principle not statistically significant) from the results. The TRs found by mreps (for different values of the two discussed input parameters) were masked from the input sequences resulting into shorter masked versions of the same. Masking was performed in two different ways selected depending on a boolean flag called all: the first one (all = true) entails the identification and filtering of all the occurrences of a given repeat, included the original motif. The second one (all = false) refers to masking only the repeated expansion of the original motif which is not therefore filtered out from the original sequence. These sequences were finally pairwise-aligned with each other in order to compute their edit distance and extract the statistics for quality metrics evaluation. Notice that all the repeated motifs of the same TR are annotated with the same ancestral position, so that, when masking N-1 occurrences, the remaining one is homologous to its ancestor.
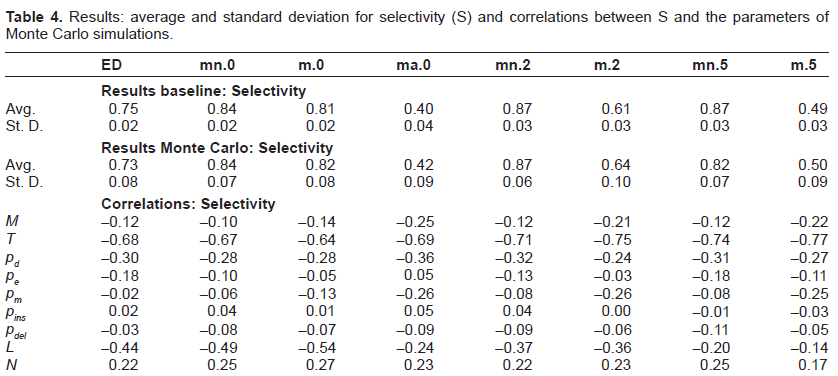
The results are summarized in Tables 2– 4 where we reported, respectively, ranking error (E), significance ratio (R) and selectivity (S). We computed the results (for each of the three metrics) in terms of average and standard deviation when the sequences are aligned according to the various analyzed techniques. More in detail, we explored the performance of Edit Distance alignment on the original sequences and on the sequences where TRs had been filtered out. Different parameter settings of mreps (summarized in Table 5) were tried corresponding to as many columns in the result tables:
Column 1, identified by header
Column 2, identified by header
Column 3, identified by header m.0, represents the case of Edit Distance applied to masked sequences from which all exact TRs (res = 0, allowsmall = true) have been filtered out, leaving only the original motif (all = false).
Column 4, identified by header ma.0, represents the case of Edit Distance applied to masked sequences from which all exact TRs but the small ones (res = 0, allowsmall = false) have been filtered out, together with their original motif (all = true).
Column 5 identified by header
Column 6 identified by header
Column 7 identified by header
Column 8 identified by header
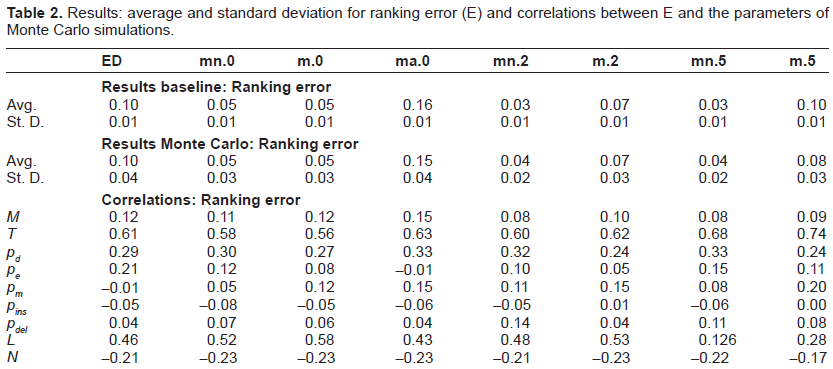
Results: average and standard deviation for ranking error (E) and correlations between E and the parameters of Monte Carlo simulations.
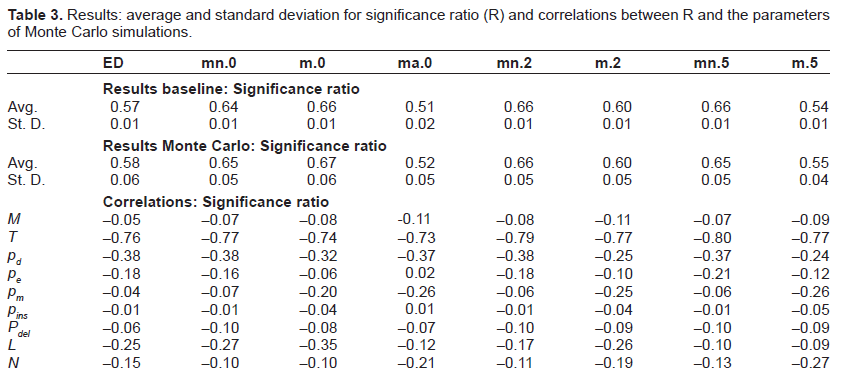
Results: average and standard deviation for significance ratio (R) and correlations between R and the parameters of Monte Carlo simulations.
Results: average and standard deviation for selectivity (S) and correlations between S and the parameters of Monte Carlo simulations.
Parameter settings: values taken by mreps options res and allowsmall (used to control resolution and statistical significance of TRs) and by flag all (used for masking all TRs together with their original motif).

Results are reported both for the baseline and for the benchmark generated with a Monte Carlo strategy in the neighborhood of this point.
For each of the three quality metrics we also computed the Pearson correlation with every parameter of the generated benchmark. In particular we evaluated the correlation of E, R, and S with M, T, pd, pe, pm, pins, pdel, L and N as defined in the Metric Estimation section. Repeating this analysis for standard ED-based alignment and for its mask-based counterparts, allows one to make inferences on the duplication-aware alignment algorithms under study, possibly paving the way for fine tuning of parameter settings.
For what concerns the analysis of results, we can observe in general that the use of masking appears to be beneficial in terms of E, R and S with respect to the simulation set up. In particular, the average ranking error achieved by mn.2 and mn.5 is 0.03, against a ranking error of 0.10 for ED. As for significance ratio, the best performance was achieved by m.0, with 0.66 and 0.67 on baseline and Monte Carlo, to be compared with 0.57 and 0.58 of ED, respectively. The best performance in terms of selectivity was achieved by mn.2, which reached 0.87 on both baseline and Monte Carlo, against 0.75 and 0.73 of ED. There are however two exceptions: the first one is the case where also the original motif is cut away from the sequences (all = true), which always turns into worse performances (we reported only the case of exact TRs (ma.0), but we verified that this type of masking always gives the worst performances also when approximate TRs are considered). The second one relates to column m.5 that gives slightly worse results in terms of ranking error and significance ratio, while it clearly obtains lower values of selectivity.
The last nine rows of each table report the results of the sensitivity analysis expressed in term of correlations. A strong correlation can be observed between each of the three quality metrics and the number of epochs T, which was somehow expected. In fact, the higher the number of evolutionary epochs, the higher the number of mutations that accumulate, making it more difficult for any algorithm to find significant alignments. Another salient feature that emerges from the correlation analysis is the dependence of E, R and S on the mutation probabilities. Interestingly, the masking techniques allow (up to different degrees) to reduce the effect of extension probabilities. For instance, the correlation of E with pe is 0.21 for ED standard alignment while it becomes 0.05 in the case of masked sequences (case m.2). On the contrary, the correlation analysis shows that masking techniques are less robust than standard alignment methods w.r.t. pm, as it was somehow expected since higher mutation rates tend to obfuscate duplication effects making it a more difficult task to obtain meaningful filtering. Similar considerations hold for R and S when they are correlated to the mutation probabilities of the generated benchmarks.
These results provide independent confirmation of the improved quality of repeat-aware alignment algorithms and demonstrate the validity of the proposed approach as a framework for the evaluation of different alignment methods.
We also report, in Figure 3 the average compression ratio obtained by each of the masking methods under comparison. The impact of short TRs is apparent.

Average compression ratios of different masking techniques applied to synthetic benchmarks.
Conclusions
In this paper we have presented a new method for assessing the quality of duplication-aware sequence alignment algorithms. In order to achieve this goal we developed a Monte Carlo simulator for generating suitable benchmarks consisting of sets of properly annotated sequences. The parameters of the Monte Carlo framework allow us to have precise control over the evolutionary history of the generated sequences, and to model different scenarios. Moreover, the annotation process is crucial for an ex-post evaluation of the alignment algorithms under study, made by means of three metrics (ranking error, significance ratio and selectivity) introduced with the aim of measuring the quality of the given alignments.
The proposed approach has been tested on a case study by generating synthetic benchmarks according to the Monte Carlo simulation approach and by applying standard Edit Distance alignment algorithms both to original sequences and to masked versions from which TRs were removed. Experimental results demonstrate the usefulness of repeat masking, provide evidence of the dependence of quality metrics on the parameters of the simulated evolutionary process and confirm the capability of the methodology to capture basic features of the compared algorithms.
Disclosure
This manuscript has been read and approved by all authors. This paper is unique and is not under consideration by any other publication and has not been published elsewhere. The authors and peer reviewers of this paper report no conflicts of interest. The authors confirm that they have permission to reproduce any copyrighted material.