
Abstract
We propose a simple, sensitive measure of synonymous codon usage bias, the Relative Codon Adaptation Index (rCAI), as a way to discriminate better between highly biased and unbiased regions, compared with the widely used Codon Adaptation Index (CAI). CAI is a geometric mean of the relative usage of codons in a gene, and is calculated using the codon usage table trained with a set of highly expressed genes. In contrast, rCAI is computed by subtracting the background codon usage trained with two noncoding frames of highly expressed genes from the codon usage in the coding frame. rCAI has higher signal-to-noise ratio than CAI, considering that noncoding frames would not show codon bias. Translation efficiency and protein abundance correlates comparably or better with rCAI than CAI or other measures such as ‘effective number of codons’ and ‘SCUMBLE offsets’. Within overlapping coding regions, one of the two coding frames dominates in codon usage bias according to rCAI. Presumably, rCAI could substitute CAI in diverse applications.
Introduction
It has long been known that synonymous codons are used with unequal frequencies in many organisms. 1 Such bias can be explained by several possible causes: heterogeneity of nucleotide base composition, 2 asymmetric mutation rates in the leading and lagging strands of DNA replication,3,4 transcription effectiveness,5,6 protein hydropathy, 7 and selection pressure for optimizing translational efficiency. 8 Although the major source of bias differs from species to species, the phenomenon of codon usage bias is universal across diverse taxa.9–13 Codon usage bias is considered important in the study of molecular evolution 14 and expression of exogenous protein.15,16
Since Ikemura proposed a measure of codon usage bias, ‘frequency of optimal codons’ (fop), associated with tRNA abundance, 17 a vast number of different codon bias measures18–25 have been developed, indicating the biological relevance of codon bias. Among them, ‘codon adaptation index’ (CAI) 18 is one of the most widely used. CAI was originally proposed to provide a normalized estimate that can be used across genes and species, ranging from 0 to 1. The boundary values refer to the cases in which only the most frequent codons (CAI = 1) or only the least frequent codons (CAI = 0) are used within a gene.
CAI has been used as a simple and effective measure of the overall synonymous codon usage bias of a gene. Highly expressed genes, including ribosomal proteins and transcription and translation factors, tend to have high CAI.26,27 CAI has been used extensively in diverse biological research: for measuring translation efficiency and predicting cellular protein levels,28,29 for verifying high-throughput expression quantification techniques30,31 and for optimizing DNA vaccines. 32
CAI of a gene is computed as the geometric mean of the relative adaptiveness (

Intragenic variation of synonymous codon usage bias has been documented. 33 Some software programs provide an option of displaying local CAI values along a gene.34,35 However, we observe that local CAI values are relatively noisy and that CAI still has a room for improvement in close examination of short regions. Motivated by this limitation, we propose a modified version of CAI that can apparently capture local signals more sensitively and produce less noise when applied to regions expecting little or no codon bias.
Algorithms and Datasets
Relative CAI
The ‘relative codon adaptation index’ (rCAI) is calculated from the LNWD table, which is defined as below:

rCAI is computed as below:


Compiling protein coding sequences
In this study, we restricted our scope within prokaryotes. Genomic sequences (.fna) and gene locations (.gff) obtained from the NCBI ftp site were used to extract protein coding sequences for
Translation efficiency and protein abundance
Dressaire et al quantified absolute protein abundance based on the APEX method
30
along with mRNA abundance in
For
Correlation analysis
For testing correlation between rCAI and CAI, all genes annotated in the NCBI files were used (4379 for
Comparison of rCAI and CAI on a genomic region
For comparison of individual genomic locations, we particularly selected 9 highly expressed
According to the original paper,
18
the number (
Gene-wise signal-to-noise ratio (SNR)
We measured SNR for rCAI and CAI for each gene in
Effective number of codons (ENC)
rCAI was compared with ENC,
19
another widely used measure of codon usage bias, in terms of correlations with translation efficiency and protein abundance. Proteins of less than 100 amino acids were excluded from analysis, because their ENC was known to be inaccurate.
19
ENC was computable only for 170
Scumble
The degree of codon bias affected by translation efficiency or gene expression level was estimated using the SCUMBLE (synonymous codon usage bias maximum likelihood estimation) method developed by Kloster and Tang.
25
A four-trend model was used, as suggested by the developers, for correlation analysis using 165
Application of rCAI on overlapping genes
Overlapping gene pairs of histidine kinase and response regulator have been compiled for over 200 bacteria and studied extensively by Cock and Whitworth.
36
They observed that the property of an overlapping region was more similar to the upstream gene than its downstream counterpart, and proposed a scenario where an overlapping downstream gene has evolved by extending its 5' end into its upstream neighbor. From their collection, we chose a
Results and Discussion
Correlation of rCAI with translation efficiency and protein abundance
In order to assess the qualification of rCAI as a measure of codon usage bias, we looked at the correlation between rCAI and translation efficiency, a direct effect of tRNA abundance.
37
For 171
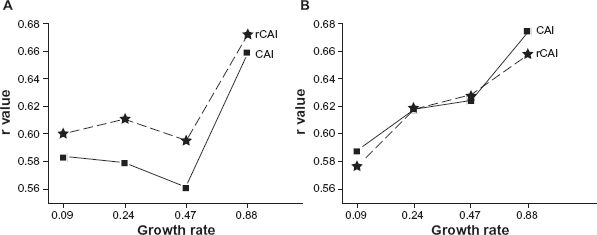
Comparison between rCAI and CAI with respect to correlation with translation efficiency. Pearson correlation coefficients (r) of gene-wise rCAI (asterisk) or CAI (square) were calculated with log10 of translation efficiency
It has been known that gene expressivity, or protein abundance is also correlated with codon usage bias.
27
We observed that the correlation of rCAI with protein abundance was at a comparable level with that of CAI in
For
Whereas CAI is set to range from 0 to 1, rCAI ranges from 0 to an upper limit, which corresponds to an imaginary gene consisting only of the maximum-LNWD codons (Fig. 2). Nevertheless, rCAI and CAI were highly correlated with each other (r = 0.96) in both

Genome-wide correlation between rCAI and CAI. Gene-wise rCAI and CAI values were calculated for all 2321
Distribution of rCAI and CAI on a genomic region
Figures 3A and 3B show local rCAI and CAI distributions, respectively drawn on the three sense phases of
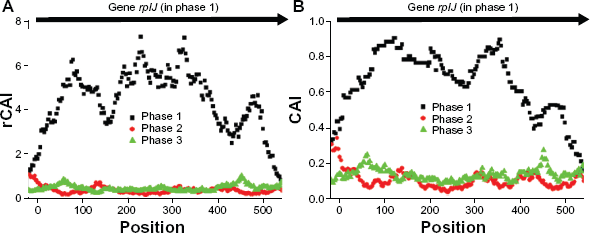
Signal-to-noise ratio of rCAI and CAI on coding regions. Distribution of local rCAI

Genome-wide comparison between rCAI and CAI with respect to signal-to-noise ratio (SNR). SNR values of gene-wise rCAI (red circle) and CAI (black rectangle) were calculated for all 2321
Application of rCAI on overlapping genes
It would be interesting to see the codon usage bias pattern on the regions where two or more genes overlap in different frames. Cock and Whitworth
36
studied mutability and codon frequencies within the two overlapping genes for sensor kinase and response regulator constituting the two-component systems in over 200 bacteria and documented that an overlapping region tends to be more similar to the upstream gene than downstream gene. We selected one of sufficiently long overlapping regions from their compilation to examine rCAI pattern. The region was overlapped by two

rCAI distribution across the overlapping region of two
We applied rCAI on another overlapping gene pair,
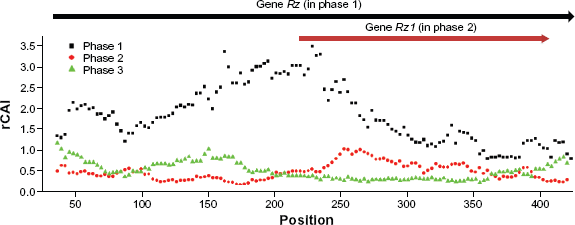
rCAI distribution across the overlapping region of two λ phage genes,
Resistance to frameshift
It has been suggested that one of the selective constraints that affect formation of codon usage bias is resistance to frameshift caused by either mutation or mistranslation. 40 In other words, codon usage is adapted in a way that minimizes optimal codon usage in frame-shifted products. This is consistent with our observation that subtracting the background of shifted frames makes codon bias signals become clearer having higher SNR.
Simplicity
Although rCAI uses a background term, which is not used for CAI, rCAI does not require an additional training set, such as genes of low expression levels or randomly shuffled sequences. Given the reference set of genes used to calculate CAI, rCAI can be computed simply by using two additional phases. The procedure of computing LNWD involves computing lnw, as in the calculation of CAI, except that it is done on three different phases of the reference set.
Comparison of rCAI with other codon usage bias estimates
‘Effective number of codons’ (ENC) was proposed by Wright to describe codon bias without the reference of highly expressed genes.
19
ENC ranges from 20 (maximum bias) to 61 (no bias). In this study, ENC was computed for the
As modified versions of ENC, Nc* and Nc** were sequentially introduced by Fuglsang.20,22 The more recent Nc** was computed in this study. For the highest growth rate dataset of
‘Frequency of optimal codons’ (Fop) suggested by Ikemura is the fraction of optimal codons (the most preferred by tRNA) to synonymous codons in a gene. 17 Fop may serve as the most direct measure of translation-related codon usage bias. Unfortunately, the use of Fop is limited due to lack of information on tRNA abundance in some organisms. According to the analysis by Goetz and Fuglsang, Fop is less correlated with expressivity than CAI, 24 and hence presumably than rCAI.
Discernment of codon bias sources
‘Correspondence analysis’ (CA) powerfully discerns the major source of codon usage bias in a particular genome, and several versions of CA such as CA-AF, CA-RF, CA-RSCU and within-group CA (WCA) have been proposed.
23
CA extracts the most influential ‘axes,’ or directions from a multi-dimensional vector space, i.e. a contingency matrix of genes (in rows) and codons (in columns). By inspecting what CA axis separates genes, one can identify the major source of codon bias in the species. For example, highly expressed
Recently, a probabilistic model-based method, called SCUMBLE, was proposed to estimate the degrees of contribution by different sources (‘trends’) and their effects on a gene (‘offsets’ or βi).
25
Where translational selection is the major source of bias, for example in
When SCUMBLE was applied on the
Although CA and SCUMBLE are useful in discerning the sources of codon usage bias, it is not the most ideal for quantifying an individual kind(s) of codon bias. Firstly, which CA axis or trend represents a specific source is generally unknown and differs from species to species. Secondly, an axis or trend may possibly represent a mixed or partial effect. For example, in both
Conclusions
CAI measures absolute codon usage bias by quantifying the similarity in the synonymous codon frequency between a given gene and a set of the most frequently translated genes. In contrast, the relative CAI, or rCAI, uses not only the most optimal frames but also potentially the least optimal frames, which are likely to occur in the noncoding frames of the maximally translated genes. Computationally, rCAI is nearly as easy to calculate as CAI, but shows higher discriminating power. As we demonstrated a usage of rCAI in codon bias analysis of overlapping genes, rCAI may provide a substitute for CAI in various applications.
Disclosures
This manuscript has been read and approved by all authors. This paper is unique and is not under consideration by any other publication and has not been published elsewhere. The authors and peer reviewers of this paper report no conflicts of interest. The authors confirm that they have permission to reproduce any copyrighted material.
Footnotes
Acknowledgements
We sincerely thank Drs. Tang and Kloster for kindly providing the code for SCUMBLE, and the anonymous reviewers of this manuscript for offering valuable suggestions. This work was supported by the Korea Healthcare Technology R&D Project [A080587].