
Abstract
Synonymous codon usage bias (SCUB) is the nonuniform usage of codons, occurring often in nearly all organisms. Our previous study found that SCUB is correlated with intron number, is unequal among exons in the plant nuclear genome, and mirrors evolutionary specialization. However, whether this rule exists in the plastid genome has not been addressed. Here, we present an analysis of SCUB in the plastid genomes of 25 species from lower to higher plants (algae, bryophytes, pteridophytes, gymnosperms, and spermatophytes). We found NNA and NNT (A- and T-ending codons) are preferential in the plastid genomes of all plants. Interestingly, this preference is heterogeneous among taxonomies of plants, with the strongest preference in bryophytes and the weakest in pteridophytes, suggesting an association between SCUB and plant evolution. In addition, SCUB frequencies are consistent among genes with varied introns and among exons, indicating that the bias of NNA and NNT is unrelated to either intron number or exon position. Further, SCUB is associated with DNA methylation–induced conversion of cytosine to thymine in the vascular plants but not in algae or bryophytes. These data demonstrate that these SCUB profiles in the plastid genome are distinctly different compared with the nuclear genome.
Introduction
The plastid is a major double-membrane organelle in the cells of plants and algae. It is the manufacturing and storage site of important chemical compounds used by the cell. In plants, plastids differentiate into several forms, including chloroplasts for photosynthesis for energy absorption and carbon assimilation, chromoplasts for pigment synthesis and storage, amyloplasts for starch storage and detecting gravity, and so on. Unlike a single nuclear genome in one cell, there are many plastids in one cell, each creates multiple copies of a circular genome. 1 The plastid genome is only 75–250 kb in size, much smaller than the nuclear genome, and contains 50–200 genes, most of which function in photosynthesis and encode ribosomal proteins. 1
Plastids originated from the endosymbiosis of cyanophytes. Most genes and other genetic content in the plastid genome have been eliminated or transferred into the nuclear genome.2,3 The elimination and transfer of DNA sequences lead to sequence insertion and deletion (indel), and during the process DNA breakage, refusion, and recombination occur. These genetic events cause genomic shock4,5 and consequently induce local single-nucleotide substitution. 6 For protein-coding genes, the single-nucleotide substitution can result in the production of either a synonymous codon (SC) or nonsynonymous codon.
Codon degeneracy occurs when an amino acid is encoded by two or more SCs. Apart from the nuclear genome, SCUB has been identified in the organellar genome, as well. SC frequency varies among genomes, and even from one gene to another within a single genome. 7 The resulting variation is termed “synonymous codon usage bias” (SCUB). The evolution of SCs reflects a balance among mutation, genetic drift, and natural selection.8–10 The evolution of plants follows the evolution of their nuclear genomes, and DNA duplication and recombination induce significant genomic shock and are therefore the major drivers of genome evolution in plants. 11 Our previous work found SCUB frequency was heterogeneous among different evolutionarily taxonomic plants from algae to land plants, highlighting a close relationship between SCUB and plant evolution. 12 In comparison with the nuclear genome, the large-scale loss and transfer of plastid genes into the nuclear genome likely induces much stronger genomic shock and its attendant consequences, implying the difference in SCUB between the plastid and nuclear genomes. The characteristics of SCUB have been widely analyzed in the plastid genomes of different plants.13–18 However, the difference among SCUB in plastid genomes from lower to higher plants has not been well examined.
DNA recombination and indels often lead to intron gain and loss, 11 a key component of genome evolution.11,19 The propensity for intron gain/loss is related to both intron frequency and position in the gene.20,21 In the nuclear genome, a close relationship is embedded between intron and SCUB. 7 Our previous study showed that SCUB is correlated with intron number and shows disequilibrium among exons in plants. 12 However, the correlation between SCUB and intron number/exon position in the plastid genome has not been reported.
In this study, we analyzed SCUB in the plastid genome sequences of 25 species of archaeplastida (rhodophytas) and plants sensu lato (chlorophytas, charophytas, bryophytes, pteridophytes, gymnosperms, monocotyledons, and dicotyledons). We found that SCUB exhibits heterogeneity among different taxonomies of plants. Our results indicate no correlation with gene structure, highlighting a distinct difference compared with the SCUB pattern in the nuclear genome.
Materials and Methods
Plastid genome sequences and gene structure
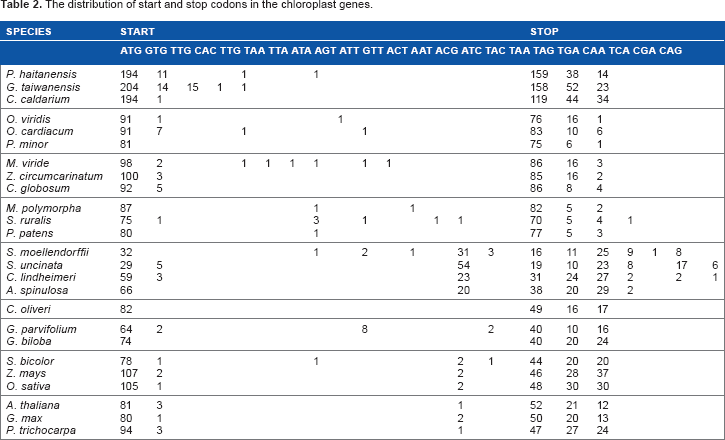
The plastid genome sequences of 25 species were downloaded from National Center for Biotechnology Information (NCBI) (http://www.ncbi.nlm.nih.gov/genomes/GenomesGroup.cgi?taxid=2759&opt=plastid). These species included three archaeplastida and 22 plants sensu lato that occupy different evolutionary positions during plant evolution history (Table 1). The intron/exon structure of protein-coding genes was obtained from the online coding sequence (CDS) annotation at NCBI (http://www.ncbi.nlm.nih.gov/genomes/Genomes-Group.cgi? taxid=2759&opt=plastid). Coding sequences with a length of a multiple of three were deemed to be canonical genes for analysis. In addition to ATG, other forms of the first three nucleotides were also considered as start codons; in addition to TAA, TAG, and TGA, other forms of the last three nucleotides also served as stop codons (Table 2). The triplets TAA, TAG, and TGA in front of the last three nucleotides were deemed to be internal stop codons. Codons separated by an intron between the first and the second nucleotides were treated as belonging to the subsequent exon, while those interrupted between the second and the third nucleotides were deemed to belong to the current exon.
The intron numbers of genes in the chloroplast genomes.

The distribution of start and stop codons in the chloroplast genes.
Calculation of SCUB frequency
We calculated the SCUB frequency according to our previous study 12 to intuitively compare the difference among species instead of using indicators such as relative SC usage and codon adaptation index. The calculations of SCUB frequency were based on 59 SCs encoding 18 amino acids; the five codons not considered were the three stop codons, ATG (Met), and TGG (Trp). To avoid the effect of gene length, the frequency of a given codon of 59 SCs was normalized by dividing the number of this codon to the codon number of coding DNA sequences. 22 The codon number of CDS was calculated by the number of all codons except for the start and stop codons; atypical start codons (the first three nucleotides are not ATG) and atypical stop codons (the last three nucleotides are not TAA, TAG and TGA) that are rarely present in a few plastid genes of some species23–25 were also excluded. The total SCUB frequency based on the third position nucleotide was normalized as the ratio of the number of all SCs having A, T, C, or G at the third position (abbreviated as NNA, NNT, NNC, or NNG) to the codon number of coding DNA sequences.
The SCUB frequency of a given amino acid in a species was defined as the ratio of the number of its C- and G-ending SCs (NNCs/Gs) to the number of its A- and T-ending SCs (NNAs/Ts) from all CDS sequences in the plastid genome. The effect of the second nucleotide or first nucleotide of the following codon on SCUB frequency based on the third nucleotide of codons was defined as the ratio of the number of a certain combination to the number of the other combination. For example, the effect of A at the second position on the SCUB frequency of G- and C-ending codons was calculated as the ratio of the number of all SCs with AG as the second-third nucleotides (NAG) to the number of all SCs with AC as the second-third nucleotides (NAC); the effect of A at the first nucleotide of the following codon on the frequency of C- and G-ending codons was calculated as the ratio of the number of all SCs with CA as the third-next first nucleotides (NC|A) to the number of all SCs with GA as the third-next first nucleotides (NG|A). The SCUB frequency of C- and G-ending codos in a given amino acid that has C- and G-ending SCs was defined as the ratio of the number of G-ending codon (eg, GCG of alanine) to the number of C-ending codon (eg, GCC of alanine). These indices were calculated based on the ratios between the numbers of two codon sets, so the effect of gene length was automatically normalized.
Note that plastid transcripts undergo a type of posttranscriptional processing called RNA editing, which converts specific cytidines to uridines (C-to-U) or uridines to cytidines (U-to-C) through undefined mechanisms (reviewed in Chateigner-Boutin and Small, 26 Finster et al. 27 , and Takenaka et al. 28 ). The numbers of codons occurring C-to-U and U-to-C were both drastically smaller than the total number of codons. The codons undergoing C-to-U or U-to-C conversion include start codons, stop codons, nonencoding sequence (intron and untranslated region), and encoding codons; the conversion in encoding codons can occur at the first, second, or third nucleotide. Thus, the RNA editing leads to rare conversion to SCs or nonsynonymous codons, which has negligible effect when calculating SCUB frequency. Moreover, the C-to-U and U-to-C RNA editing is not annotated in the plastid genome database of most species (http://www.ncbi.nlm.nih.gov/genomes/GenomesGroup.cgi?taxid=2759 &opt=plastid). Thus, following previous studies concerning SCUB of plastid genome, the RNA editing is not considered when calculating SCUB frequency in this work.
Phylogenic tree construction and principal component analysis
We constructed a phylogenic tree with the normalized SC frequencies of 59 SCs encoding 18 amino acids based on the unweighted pair-group average method (euclidean distances) in the STATISTICA software package (V6.0, StatSoft). The normalized SC frequencies of 59 SCs were subject to perform principal component analysis (PCA) based on the varimax method in the SAS software package (V9.0, SAS Institute Inc.), and scatter plot diagrams were generated from the coefficients given by the first three principal components (PCs).
Statistical analysis
The comparison between the SCUB frequencies of 18 amino acids and 1 was performed with one-sample t-test. The difference in the SCUB frequencies of NNA/T from NNC/G in the plastid genome of a given plant was calculated using the numbers of NNA/T and NNC/G with the chi-square (χ 2 ) test. The difference in the SCUB frequencies of NNA/T and NNC/G among genes using responding SC numbers with various introns or among exons was calculated with the chi-square (χ 2 ) test of the cross-table analysis. The difference in the SCUB frequencies among algae, bryophytes, pteridophytes, gymnosperms, monocotyledons, and dicotyledons was calculated using the ratios of responding SCs with the Kruskal–Wallis test. The difference between the SCUB frequencies of nucleotide pairs based on the third nucleotide concerning DNA methylation was analyzed with the chi-square (χ 2 ) test, and the difference of the ratios of NCG/NCC of Ala, Pro, Ser, and Thr from those of NXG/NXC (X is G or C) of Arg, Gly, Leu, and Val was analyzed with the Mann-Whitney test. The difference in the frequencies of C and G from those of A and T in the gene body, intron, and whole-genome sequences was evaluated with the chi-square (χ 2 ) test, and the difference in the ratios of NNC/G to NNA/T from those of the ratios C and G to A and T in the gene body, intron, and whole-genome sequences was calculated with the chi-square (χ 2 ) test of the cross-table analysis.
Results
Gene amount and intron distribution in the plastid genome
We found that the plastid genomes of three archaeplastida species possessed 197–233 protein-coding genes (abbreviated as genes hereafter), significantly more than those in the plants sensu lato (chlorophytas, charophytas, bryophytes, pteridophytes, gymnosperms, monocotyledons, and dicotyledons) (Table 1). In the plants sensu lato, gene amounts ranged from 66 to 111, and the amounts in the bryophytes and gymnosperms were less than 89. All genes in the archaeplastidas contained no introns. In the chlorophytas and charophytas, genes with no intron were predominant, while a few genes showed various amounts of introns. Of them, all genes in both P. minor and Mesostigma viride had no introns, 29 genes in the other four species had 1 intron, two genes in Z. circumcarinatum had 2 introns, and two genes in Oltmannsiellopsis viridis had 10 introns. In the land plants, the intron distribution was similar; most genes had no introns, nearly 10% of genes had one intron, and much fewer (one to four) genes had two introns.
Start codons, stop codons, and internal stop codons in the plastid genome
Unlike the nuclear genes, atypical start (not ATG) and stop (not TAA, TGA, and TAG) codons are present in some plastid genes.23–25 Here, besides ATG as the predominant start codon in the plastid genome, GTG was a common start codon in most species (Table 2). Other start codons were present in the plastid genomes of one or several classes of plants. Of them, TTG, CAC, and TTG with C and G at the third position were found primarily in the archaeplastidas, as well as some species of the chlorophytas and charophytas; ACG, ATC, and TAC were present in the vascular plants. The start codons with A and T at the third position were present in a few genes of the chlorophytas, charophytas, bryophytes, and Selaginella moellendorffii. Ginkgo biloba, in particular, had eight genes with ATT as the start codon. In the vascular plants, ACG was a common start codon in the pteridophytes, with amounts similar to or higher than those of ATG in the lycopodiophytas (S. moellendorffii and Selaginella uncinata), but were slightly lower in the polypodiopsidas (Cheilanthes lindheimeri and A. spinulosa). ACG was also a common start codon in the angiosperms, with much lower numbers (one to two), but it was not a start codon in the gymnosperms.
TAA, TAG, and TGA were three typical stop codons in the plastid genomes of all species (Table 2). In our study, we found algae and bryophytes contained amounts of TAA (approximately 60.4%–75.4% in the archaeplastidas, and more than 81.7% in the other species) markedly more than those of TAG and TGA; TGA had the lowest. In the spermatophytes, the amounts of TAA (41.4%–61.2%) were significantly more than those of TAG and TGA. In comparison to TGA, the amounts of TAG were significantly lower in the gymnosperms, comparable or slightly lower in the monocotyledons, but much higher in the dicotyledons. In the pteridophytes, the amounts of TAA were slightly more than TGA in the polypodiopsidas, but lower than those in the algae, bryophytes, and spermatophytes. However, the amounts of TAA were much lower in the lycopodiophytas (22.9%), and less than that of TGA (27.7% and 35.7%). CAA, TCA, CGA, and CAG were used as stop codons in the plastid genomes of the pteridophytes. Of them, CAA and CGA had significantly higher usage frequency compared with CAG and TCA.
Internal stop codons rarely exist in the gene body of some plastid genomes.24,29 Unlike nuclear genes, some plant species contain plastids that use uridine-to-cytidine (U-to-C) as an RNA-processing mechanism.30,31 Because U-to-C editing often acts to eliminate internal stop codons in transcripts of essential genes, it is possible to predict the activity and relative abundance of U-to-C RNA editing in a species based on the presence and abundance of internal stop codons in otherwise intact and presumably functional genes. 29 Internal stop codons are present in the available plastid genomes of most leptosporangiate ferns, but not in either of most early diverging fern lineages or seed plants. 32 This suggests that U-to-C editing originated in the common ancestor of vascular plants and hornworts, with independent losses from the lycophyte Selaginella and most (or all) seed plants. 29 Consistently, internal stop codons were found only embedded in the gene body in the plastid genome of pteridophytes (Supplementary Table S1). Few internal stop codons existed in the lycopodiophytas (none in S. moellendorffii and 5 in S. uncinata), but many in polypodiopsidas (38 in C. lindheimeri and 73 in A. spinulosa). Moreover, among the internal stop codons, the number of either TAA or TGA with A at the third position was much higher compared with TAG.
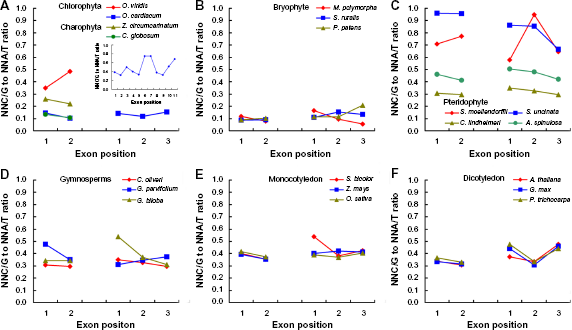
SCUB patterns are heterogeneous among plants at different evolutionary positions
Our findings show among 61 codons, the codons with A or T at the third position (NNAs or NNTs) generally had higher frequencies compared with those with C or G at the third position (NNCs and NNGs) (Supplementary Fig. S1). The exception is lycopodiophytas (S. moellendorffii, S. uncinata), where the percentage of NNAs or NNTs was similar to that of NNCs or NNGs. Here, to gain a direct view of SCUB, the SCUB frequency of a given amino acid with SCs is defined as the ratio of NNCs and NNGs (NNCs/Gs) number to NNAs and NNTs (NNAs/Ts) number (Fig. 1A). In the archaeplastidas, SCUB frequencies ranged from 0.127 to 0.468. In the chlorophytas, the lowest frequencies were similar (0.066–0.094), but the highest was 0.346 in Oedogonium cardiacum, up to 1.335 in Pedinomonas minor and 1.771 in O. viridis; their coefficients of variation (CVs) ranged from 0.350 to 1.021 (Supplementary Table S2). Unlike chlorophytas, SCUB frequencies were 0.055–0.403 in charophytas, and the frequency ranges of 18 amino acids were similar (CV: 0.319–0.435). In the bryophytes, SCUB frequencies were similar among three species (0.044–0.228; CV: 0.397–0.417), and they were significantly lower than those of the algae and other land plants (Supplementary Fig. S2A).

The SCUB frequency based on total plastid genes. (
SCUB frequencies in the vascular plants were higher, and pteridophytes had the highest (Fig. 1A; Supplementary Fig. S2A). In the pteridophytes, SCUB frequencies were significantly different between the lycopodiophytas and the polypodiopsidas (P = 1.697E-6), the frequencies ranged from 0.362 to 1.429 in the lycopodiophytas and from 0.271 to 0.828 in the polypodiopsidas. The SCUB frequencies of the spermatophytes were similar, and significantly lower than those of the pteridophytes (Supplementary Fig. S2A). In total, the SCs of 18 amino acids showed preferential A- and T-ending codons, their SCUB frequencies were significantly lower than 1 (P values were less than 0.001 in all detected species except for S. uncinata whose P value was 0.263) (Supplementary Table S2). Moreover, SCUB frequency of a given amino acid was distinct among species. In the rhodophytas, Cys had the largest ratio of NNCs/Gs to NNAs/Ts, while Ile had the lowest. In the chlorophytas, His and Asn were preferential to NNCs/Gs, and they had modest ratios in other plants. In the bryophytes and spermatophytes, Ser had the highest ratio, while Ile had the lowest.
SCUB in the plastid genome was directly determined by the total SCUB frequencies of NNA, NNT, NNC, and NNG, which are, respectively, defined as the ratios of the numbers of all NNAs, NNTs, NNCs, and NNGs to the codon number of all CDS in a plastid genome. In our study, we found NNA and NNT were more common than NNC and NNG (Fig. 1B). The frequency of NNA and NNT was significantly higher than that of NNC and NNG (P values of S. moellendorffii and S. uncinata were 4.10E-103 and 4.89E-16, respectively, and those of other species were 0) (Supplementary Table S2). Among them, NNA frequency was the highest, and NNG frequency the lowest (Fig. 1B). In the archaeplastidas and chlorophytas, both NNA and NNT frequencies were approximately 0.4, and NNC and NNG were approximately 0.1. In the charophytas and bryophytes, both NNA and NNT frequencies were more than 0.4, NNC and NNG were less than 0.1. SCUB was comparable in the spermatophytes, where NNA and NNT frequencies ranged from 0.3 to 0.4, NNC and NNG were within the scope of 0.1–0.2. Unlike the bryophytes, the vascular plants had higher frequencies of NNC/G to NNA/T (Supplementary Fig. S2B), showing their preference to NNA and NNT was weakened. Except for S. moellendorffii and S. uncinata, the ratios of C and G to A and T in the gene body, intron, and whole genome were lower than 1 (Supplementary Table S3). However, these ratios were significantly higher than the ratio of NNC/G to NNA/T in each of the 25 detected species (Supplementary Table S3). These results indicate that SCUB is preferential to NNA and NNT with differential extent in different taxonomies of plants.
SCUB frequency is not associated with intron number
SCUB frequency is differential in genes possessing various introns in nuclear genomes. 12 To analyze whether the rule is present in the plastid genome, we compared SCUB frequencies among genes with various introns. In the plastid genomes, we found that SCUB frequencies of 18 amino acids were most similar among genes with various numbers of introns in either the algae or the land plants (data now shown). In the land plants, the SCUB frequencies, defined as the ratio of NNC and NNG (NNC/G) to NNA and NNT (NNA/T), among genes with 0, 1, and 2 introns were similar with each other (P > 0.05) (Fig. 2; Supplementary Table S4). In the spermatophytes (gymnosperms, monocotyledons, and dicotyledons), the SCUB frequencies of genes with 0, 1, or 2 introns were approximately 0.40 (Figs. 2D–F), and there was no difference among species (Supplementary Fig. S3A). The SCUB frequencies among genes with 0, 1, and 2 introns were higher than those of spermatophytes (Fig. 2C; Supplementary Fig. S3A). Unlike spermatophytes, the SCUB frequencies were different among species (from 0.4–0.5 in A. spinulosa to ~0.9 in S. uncinata) (P = 0.016), of which two lycopodiophytas (S. moellendorffii and S. uncinata) had higher frequencies than two polypodiopsidas (C. lindheimeri and A. spinulosa) (Supplementary Fig. S3B). In the bryophytes, the SCUB frequencies of genes harboring 0, 1, and 2 introns were similar in the three species (Fig. 2B; Supplementary Table S4); frequencies were approximately 0.1, significantly lower than vascular plants (Supplementary Fig. S3 A). In the algae, the SCUB frequencies based on intron number were similar in Z. circumcarinatum, but exhibited differences in other three species (Fig. 2A; Supplementary Table S4). These findings indicate that the bias to NNA and NNT has no association with intron number in the plastid genome.

The SCUB frequency based on the third nucleotide in genes with various introns. NNA/T and NNC/G are defined as the number of total SCs with A/T and C/G at the third position, respectively.
SCUB frequency is consistent among exons
SCUB frequency is heterogeneous among exons in nuclear genes, 12 so we further analyzed this characteristic in the plastid genome. In the spermatophytes, for genes with either two or three exons, the SCUB frequencies from the first to the last exons were approximately 0.4 (Figs. 3D–F). And we found no difference compared with one another (P values in two-exon genes >0.16 in all species except for Gnetum parvifolium; the values in three-exon genes are all greater than 0.11) (Supplementary Table S4). In the pteridophytes, the SCUB frequencies of different exons were also similar among species (Fig. 3C; Supplementary Table S4). Moreover, the frequencies showed heterogeneity among species, ranging from ~0.3 in A. spinulosa to nearly 1.0 in S. uncinata (Supplementary Fig. S4A). Among pteridophytes, the lycopodiophytas (S. moellendorffii and S. uncinata) were more preferential to C/G-ending exons compared with polypodiopsidas (C. lindheimeri and A. spinulosa) (Supplementary Fig. S4B). The SCUB frequencies in different exons were comparable (~0.1) in the bryophytes (Fig. 3B; Supplementary Table S4), significantly lower compared with vascular plants (Supplementary Fig. S4A). We found no significant SCUB frequencies in algae exons (P > 0.05), except for genes with two exons in O. viridis (P = 0.0177) and O. cardiacum (P = 0.0474) (Supplementary Table S4). These data demonstrate that a bias toward NNA and NNT is not associated with exon position in the plastid genome.
The SCUB frequency based on the third nucleotide among exons. NNA/T and NNC/G are defined as the number of total SCs with A/T and C/G at the third position, respectively.
The association between DNA methylation and SCUB
DNA methylation is a major source of DNA variation, given that methylated cytosine (mC) is readily converted into T. 33 Our previous study showed that CpG methylation is a driver of codon bias in the nuclear genome. 12
Plastid genomes rarely experience CpG methylation in chloroplast.34,35 However, they are heavily modified in amyloplast 36 and chromoplast,37,38 suggesting an association between plastid SCUB and DNA methylation. The conversion of mC in CpG, or its complement strand, produces TpG or CpA, and the conversion of two mCs produces TpA. Given the lower selection pressure on the third position of codons, the conversion of NCG to NCA (the second-third position) as well as NC|G to NT|G (the third-next codon's first position) would be dominant.
To investigate the association between DNA methylation and SCUB, we compared the influence of the second-position nucleotides as well as the first nucleotides of the next codons on the frequencies of SCs with C and G at the third position. Our results show that the influence of the adjacent nucleotides on the third nucleotide is diverse. In the vascular plants, the ratios of NCG/NCC were significantly lower compared with those of NGG/NGC, NAG/NAC, and NTG/NTC (Fig. 4A). In each of the vascular plants, the ratio of NCG/NCC was significantly lower compared with the penultimate (P < 0.05) (Supplementary Table S5). However, in the algae and bryophytes, the ratios of NCG/NCC were higher than or similar to those of other NNG/NNC forms, except for G. taiwanensis and C. caldarium (P = 0.0099 and 0.0004, respectively) (Fig. 4A; Supplementary Table S5). Similarly, in the vascular plants, the ratios of NC|G/NG|G were lower compared with those of other NC|N/NG|N forms (Fig. 4B). And their difference from the penultimate (NC|A/NG|A) was statistically significant (P < 0.05, the exception is 0.32 in G. parvifolium) (Supplementary Table S5). We did not find the rule in the algae or bryophytes (Fig. 4B; Supplementary Table S5).

The association between the DNA methylation–induced conversion of C to T and SCUB frequency. (
We selected C- and G-ending SC pairs with the same nucleotides at the first and second positions within Ala, Arg, Gly, Leu, Pro, Ser, Thr, and Val to further analyze the effect of the second-position nucleotide on the frequencies of C- and G-ending SCs (Fig. 4C). In the vascular plants, the ratios of NCG/NCC in Ala, Pro, Ser, and Thr were all less than 1. Those of NXG/NXC (X is G or C) of Arg, Gly, Leu, and Val were greater than or near 1. In the algae and bryophytes, the ratios of NGC/NGG were not all lower compared with NXG/NXC. The ratios of CGG/CGC within Arg were the lowest. Our results from the Kruskal–Wallis test show that the ratios of NCG/NCC were significantly higher compared with NXG/NXC (X is G or C) in the vascular plants (P < 0.05). The exception was G. parvifolium (P = 0.136) and Oryza sativa (P = 0.091). NCG/NCC ratios were not different in the algae and bryophytes (P = 0.286~0.991) (Supplementary Table S6). These results indicate that DNA methylation is possibly a partial cause for SCUB formation in the plastid genome of vascular plants.
Plants are clustered according to SCUB
To highlight the difference of SCUB frequency based on evolutionary taxonomy, we created a phylogenic tree based on the normalized SCUB frequencies of 59 codons encoding 18 amino acids. It clearly distinguished the algae and bryophytes from the vascular plants (Fig. 5A). In the clade of algae and bryophytes, the species of archaeplastida and bryophytes were subdivided into two groups, one with three charophytas and the other with one chlorophyta. Note that two chlorophytas, O. viridis and P. minor, formed a separate group, highlighting the diverse SCUB patterns in algae. In the clade of the vascular plants, monocotyledons and dicotyledons were clustered into two clades, and gymnosperms are grouped into these two clades. In pteridophytes, polypodiopsidas (C. lindheimeri and A. spinulosa) and lycopodiophytas (S. moellendorffii and S. uncinata) exhibited different phylogenic relationships; the lycopodiophytas were close to monocotyledons, whereas the polypodiopsidas clustered into an independent group.

Phylogenic tree and PCA of SCUB frequencies. (
Consistently, our findings from PCA also differentiated the vascular plants from algae and bryophytes (Figs. 5B–D). Three PCs explained 78.0% variance among species, of which PC1, PC2, and PC3 accounted for 47.5%, 17.3%, and 13.2%, respectively. On the PC1 axis, the algae and bryophytes are located on the left side, bryophytes are at the topmost left, and the vascular plants are on the right (Fig. 5B). In the vascular plants, the lycopodiophytas are near gymnosperms, monocotyledons, and dicotyledons; polypodiopsidas are separate (Figs. 5B, C). This coincides with the independent group of the polypodiopsidas in the phylogenic tree (Fig. 5A). On the PC2 axis, O. viridis and P. minor are remote from O. cardiacum and other species (Figs. 5B, C), consistent with the independent group of these two chlorophytas in the phylogenic tree (Fig. 5 A). In the PC1–PC3 scatter plots, the plants clustered into three groups reflecting the evolutionary difference among these plants: the algae and bryophytes, the lycopodiophytas, the polypodiopsida, and spermatophytes (Fig. 5D). Further, our phylogeny and PCA using both codon frequencies of genes based on either intron number or exon position showed similar results (data not shown). Together, these results show that the relationship between SCUB and plant evolution is not associated with gene structure.
Discussion
SCUB is preferential to A- and T-ending codons in the plastid genome
The presumed ancestors of land-based plants, from mosses to angiosperms, are the single-celled algae. The algae arose long before the appearance of land plants and had already been exposed to a long period of selection which would have tended to favor GC enrichment in the nuclear genome. 39 In the land plants, the preference of SCs appears diverse in the nuclear genome. For example, codons ending in A or T were more optimal in the nuclear genes of dicotyledons, while the preference for C or G has been observed in the monocotyledon genes.12,40,41 Counter to the nuclear genome, SCs are preferential to NNA and NNT rather than NNC and NNG in the plastid genomes of both algae and land plants (Fig. 1; Supplementary Table S2). Other than amino acid–coding SCs, stop codons and the internal stop codons prefer TAA and TGA rather than TAG (Table 2; Supplementary Tables S1 and S7). The ratios of NNC/G to NNA/T are significantly lower than the ratios of C and G to A and T in the gene body, intron, and whole-genome sequences (Supplementary Table S3). This indicates that a bias toward A and T of SCs is not absolutely under a neutral or mutational model. DNA recombination and indels induce a range of genomic shock–associated events such as single-nucleotide change. 42 Single-nucleotide change is heavily biased toward A and T. 7 We suggest, as an ongoing evolution event, that the loss and transfer into the nuclear genome of the plastid genes are followed by DNA recombination and indel, resulting in the preference of A- and T-ending SCs.
SCUB offers new insights into the evolutionary heterogeneity of the plastid genomes
Our previous study showed that SCUB of the nuclear genome reflects the evolution of plants. 12 Here, we find that although SCs are biased to A- and T-ending codons in the plastid genomes of all plants, the extent of preference is heterogeneous from the algae to the spermatophytes (Fig. 1; Supplementary Fig. S2; Supplementary Table S2). This heterogeneity differentiates the evolutionary taxonomy of plants; the evolutionarily low plants (algae and bryophytes) are separate from the evolutionary high plants (vascular plants) (Fig. 5). Interestingly, PCA shows that the bryophytes and pteridophytes are separated by the spermatophytes at the PC1 axis (Fig. 5B). This does not coincide with the evolutionary levels of these taxonomic clades of plants, suggesting asynchronous evolutionary behaviors between the plastid genomes and plants. The speculation is that plastid genomes of these plants are under varied selection pressures, because SCUB is an indicator for reflecting balance between mutation, genetic drift, and natural selection.8,9 Among the pteridophytes, the lycopodiophytas (S. moellendorffii and S. uncinata) are removed from the polypodiopsidas (C. lindheimeri and A. spinulosa); in the chlorophytas, O. cardiacum is farthest from O. viridis and P. minor (Fig. 5). A morphological difference may be associated with these diverse preferences of SCUB. Lycopodiophytas belong to small-leaf ferns, polypodiopsidas are large-leaf ferns, O. cardiacum is a multi-cell algae, but O. viridis and P. minor are single-cell algae. The cause of the embedded morphology and SCUB of the plastid genome is worthy of investigation.
Whole-genome duplication (WGD) and polyploidization are major drivers of genome evolution.43–46 The evolution of spermatophytes from ferns, as well as the evolution of angio-sperms from gymnosperms, was influenced by WGD events. 42 Our previous work revealed that these two WGD events have no effect on SCUB preference of the nuclear genome. However, polyploidization events occurring after the divergence of the monocotyledonous and dicotyledonous species influenced the SCUB patterns between classes of plants. 12 Indeed, the spermatophytes and polypodiopsidas are clustered together in the scatter plots (Figs. 5B–D), and the gymnosperms are clustered into the clades of monocotyledonous and dicotyledonous species (Fig. 5A). This shows that these evolutionary events have not contributed to SCUB in plastid genomes.
Intron evolution is not a strong driver of SCUB
Intron gain/loss is a major evolutionary feature of eukaryotic genomes.20,21,47 Change to intron structure induces mutations in the adjacent exons, forming either SCs or nonsynonymous codons that lead to a bias toward lower GC content. 48 Our previous work showed that A- and T-ending SCs are optimal in genes with more introns in the nuclear genomes of plants. 12 However, SCUB is not associated with intron number in the plastid genome (Fig. 2; Supplementary Table S4). Genes with fewer introns are thought to be favored by selection, evolving more slowly, 49 causing a tendency for GC content of the exonic fraction of the genome to rise over time. 50 SCUB is preferential to NNC and NNG in genes with 10 introns in O. cardiacum and in genes with 2 introns in the polypodiopsida (Fig. 2). Thus, it is possible that in the plastid genome, SCUB is not directed to GC preference in genes with fewer introns given a lower frequency of single-nucleotide substitution induced by intron evolution.
Gain or loss of an intron induces a single-nucleotide change in the flanking exons. Indel-induced single-nucleotide change can occur over a distance of several hundred bases from the indel site. 6 The substitution level is negatively correlated with distance to the indel. 51 Our previous work showed in the nuclear genome, interstitial exons are more optimal to NNA and NNT compared with terminal exons (especially 5′-exons). 12 Here, we found that all exons were comparably optimal to NNA and NNT (Fig. 3; Supplementary Table S4). This is inconsistent with the fact that the first exon experiences the most intense selection pressure and remains most highly conserved. Thus, unlike the nuclear genome, there is no close association between SCUB and exon position in the plastid genomes.
DNA methylation possibly contributes to SCUB formation in plastid genomes
Formation of indels contributes to DNA methylation. 6 The DNA methylation–induced conversion of C to T is a potent agent of naturally occurring mutagenesis. 52 Our previous study showed that the bias toward NNA and NNT in the nuclear genome is positively correlated with DNA methylation–mediated conversion of C to T. 12 Consistently, DNA methylation–mediated conversion strongly contributes to SCUB in the vascular plants but not in the algae or bryophytes (Fig. 4; Supplementary Tables S5 and S6). This shows that DNA methylation also accounts for SCUB in the plastid genome of vascular plants. In addition, DNA methylation is a major driver of SCUB during intron evolution of the land plants. 12 Thus, unlike the nuclear genome, the contribution of DNA methylation in SCUB appeared during the evolution from bryophytes to vascular plants. In the nuclear genome, DNA methylation is an ancient property of nuclear genomes from algae to land plants, 53 but DNA methylation-induced SCUB is present in land plants, 12 showing the DNA methylation-induced nucleotide substitution is possibly an evolutionary event independent of DNA-methylation. Note that DNA methylation is rare in chloroplasts34,35 but common in amyloplast and chromoplast.36–38 Amyloplast and chromoplast are plant-specific and do not occur in algae, suggesting DNA methylation–induced SCUB in the plastid genome appears after the biogenesis of amyloplast and chromoplast. Moreover, the rarity of DNA methylation in chloroplasts34,35 implies DNA methylation-induced SCUB is possibly a consequence and trace of a previous evolution event (DNA methylation) that had lost during the following plant evolution. Together, DNA methylation–induced SCUB in the evolution and divergence of plastid is an important topic that needs to be addressed. These data also provide an evidence for further understanding why dinucleotide frequency can act as a signature of genomic heterogeneity.54–56 Moreover, mutational patterns, translational selection, translational accuracy, mRNA stability, protein stability, and interference selection 7 may be also drivers of SCUB of the plastid genes. The association between these forces and DNA methylation in SCUB needs to be investigated further.
Conclusions
Unlike the nuclear genome, SCUB is preferential to A- and T-ending codons in the plastid genome. The preference differs among taxonomic clades. SCUB, in the plastid genome, has no close association with intron number or exon position. Similar to the nuclear genome, DNA methylation is a driver of SCUB in the plastid genomes of vascular plants.
Author Contributions
Conceived and designed the experiments: YQ, MW. Analyzed the data: YQ, WX, TX, MZ, NL, LY. Wrote the first draft of the manuscript: MW. Contributed to the writing of the manuscript: GX, MW. Agree with manuscript results and conclusions: YQ, WX, TX, MZ, NL, LY, GX, MW. Made critical revisions and approved final version: YQ, MW. All authors reviewed and approved of the final manuscript.
Supplementary Data
Supplementary Table S1
The distribution of internal stop codons.
Supplementary Table S2
The statistical analysis of SCUB frequencies. SCUB frequencies based on amino acids defined as the difference in the SCUB frequencies [the ratios of C/G-ending SCs (NNCs/Gs) to NNAs/Ts] of 18 amino acids from 1 using the one-sample t-test. SCUB based on NNA/T and NNC/G defined as the difference between the frequency of all C/G-ending codons (NNC/G) to NNA/T using the numbers of NNC/G and NNA/T with the chi-square (χ 2 ) test.
Supplementary Table S3
The comparison of the ratios of NNC/NNG to NNA/NNT with the ratios of C and G to A and T in the gene body, intron, and whole-genome sequences. (a) The difference in C and G from A and T in the gene body, intron, and whole-genome sequences is calculated with the chi-square (χ 2 ) test. (b) The difference in the ratio of NNC/G to NNA/T from the ratios of C and G to A and T in the gene body, intron, and whole-genome sequences is calculated by the chi-square (χ 2 ) test of the cross-table analysis.
Supplementary Table S4
The statistical analysis of SCUB frequency based on intron number and exon position. Intron number: the comparison of SCUB frequencies among genes bearing various amounts of introns using the numbers of NNC/G and NNA/T. Exon position: the comparison of SCUB frequencies among exons in genes using the numbers of NNC/G and NNA/T. The difference significance is calculated by the chi-square (χ 2 ) test of the cross-table analysis.
Supplementary Table S5
The statistical analysis of the association between the DNA methylation–induced conversion of C to T and SCUB frequency. The numbers of NCG, NCC, and other NNN combinations are used for analysis with the chi-square (χ 2 ) test of the cross-table analysis.
Supplementary Table S6
The statistical analysis of the association between the DNA methylation–induced conversion of C to T and SCUB frequency based on special amino acids. The ratios of NCG/NCC of Ala, Pro, Ser, and Thr as well as the ratios of NXG/NXC (X is G or C) of Arg, Gly, Leu, and Val are used for the Mann–Whitney test.
Supplementary Table S7
The statistical analysis of usage bias of stop codons and internal stop codons. The bias to A-ending stop codons and internal stop codons was analyzed using the numbers of TAA+TGA and TAG with the chi-square (χ 2 ) test.
Supplementary Figure S1
The frequency of 61 amino acid–encoding codons in chloroplast genomes. The index is defined as the number of each codon to the number of total 61 codons.
Supplementary Figure S2
The statistical analysis of SCUB frequencies among the algae, bryophytes, pteridophytes, gymnosperms, monocotyledons, and dicotyledons. The ratios of NNCs/Gs to NNAs/Ts of 18 amino acids (A) and the ratios of NNC/G to NNA/T (B) are used for analysis with the stepwise comparison of Kruskal–Wallis test. The data are presented as the box plot of the ratios of different species. The boxes without the same lowercase letter mean significantly different from each other.
Supplementary Figure S3
The statistical analysis of SCUB frequencies based on the intron number. (A) The ratios of NNC/G to NNA/T in genes with various introns from the algae, bryophytes, pteridophytes, gymnosperms, monocotyledons, and dicotyledons. (B) The ratios of NNC/G to NNA/T in genes with various introns from four species of pteridophytes. The difference significance is evaluated with the stepwise comparison of Kruskal–Wallis test. The data are presented as the box plot of the ratios of NNC/G to NNA/T. The boxes without the same lowercase letter mean significantly different from each other.
Supplementary Figure S4
The statistical analysis of SCUB frequencies based on the exon position. (A) The ratios of NNC/G to NNA/T among exons in genes with two and more exons from the algae, bryophytes, pteridophytes, gymnosperms, monocotyledons, and dicotyledons. (B) The ratios of NNC/G to NNA/T among exons in genes with two and three exons from four species of pteridophytes. The difference significance is evaluated with the stepwise comparison of Kruskal-Wallis test. The data are presented as the box plot of the ratios of NNC/G to NNA/T. The boxes without the same lowercase letter mean significantly different from each other.
Footnotes
Acknowledgment
We thank Dr Austin Cape for careful reading and feedback.