
Abstract
RAC proteins are small GTPases involved in important cellular processes in eukaryotes, and their deregulation may contribute to cancer. Activation of RAC proteins is regulated by DOCK and DBL protein families of guanine nucleotide exchange factors (GEFs). Although DOCK and DBL proteins act as GEFs on RAC proteins, DOCK and DBL family members are evolutionarily unrelated. To understand how DBL and DOCK families perform the same function on RAC proteins despite their unrelated primary structure, phylogenetic analyses of the RAC, DBL, and DOCK families were implemented, and interaction patterns that may suggest a coevolutionary process were searched. Interestingly, while RAC and DOCK proteins are very well conserved in humans and among eukaryotes, DBL proteins are highly divergent. Moreover, correlation analyses of the phylogenetic distances of RAC and GEF proteins and covariation analyses between residues in the interacting domains showed significant coevolution rates for both RAC–DOCK and RAC–DBL interactions.
Introduction
Deregulation of RAS homologous (RHO) small GTPases has central roles in different diseases, such as virus,1–3 bacteria,3–5 and parasite infections,3,6 as well as cancer development.7–9 Particularly in cancer, the importance of small GTPases is well known since RAS genes have activating mutations in around 30% of human cancers, 10 but besides RAS, the RHO family of small GTPases and their regulators have been found to be implicated in many different cancer types.7–9,11 Therefore, understanding how these small GTPases have coevolved with their regulators may shed light on how their interactions evolve during the cancer microevolutionary process. RAC subfamily is a group of small GTPases consisting of RAC1, RAC2, RAC3, and RHOG, which belongs to the RHO family of the RAS superfamily of small GTPases. 12 Most of the effector proteins of RAC proteins are serine/threonine kinases (such as Mlk3, Pak1-3, and PKCα) as well as scaffold proteins (such as p53IRS, Par6α, γ, and SH2/SH3 domains), which are directly involved in the cytoskeleton organization. 13 Consequently, alterations in RAC proteins can provoke aberrant cell signaling.
Small GTPases function as an on/off amplifying switch in signaling pathways initiated by the stimulation of cell surface receptors. When GTPases are in complex with a GTP molecule, GTPases undergo a conformational change that allows them to interact with downstream effectors, so that GTPases are in an active conformation. Once GTPases hydrolyze the GTP, they remain in complex with the GDP molecule, and this prevents their interaction with effector molecules; therefore, the GTPase-GDP complex is considered to be the inactive state of GTPases. 14 GTPases are involved in signaling pathways that lead to growth, differentiation, adhesion, and migration of cells; thus, the precise control of their active and inactive states is tightly regulated.9,10 The precise time that small GTPases remain bound to the GTP or the GDP is controlled by guanine nucleotide exchange factors (GEFs), GTPase-activating proteins (GAPs), and guanine nucleotide dissociation inhibitors. 11 GEFs catalyze the exchange of bound GDP for GTP, 15 GAPs enhance the GTPase activity of small GTPases, 16 and guanine nucleotide dissociation inhibitors recognize inactive GTPases and remove them from the membrane. 17
Although all GTPases are regulated by proteins that perform the same type of biochemical processes, these regulatory proteins are evolutionarily unrelated. 18 An example of this is the GEFs that regulate RACs. GEFs are classified into two groups according to their sequence similarity and structure of their catalytic domains: DBL and DOCK families. 19 The DBL family consists of at least 71 members, which are characterized by the presence of one DBL homology (DH) domain, and membrane-binding domains, which in most cases are one or two pleckstrin homology (PH) domains. 19 DH domains catalyze the exchange of GDP for GTP, while PH domains perform different functions in different GEFs. Some PH domains localize the GEF protein to the plasma membrane through interactions with phospholipids, others interact with cytoskeleton proteins, and some others regulate the DH catalytic activity.15,19 The DOCK family consists of 11 members that are characterized by the presence of two distinct domains, the DOCK-homology regions 1 (DHR1) and 2 (DHR2).20–22 The DHR1 domain is involved in membrane localization, 23 while the DHR2 domain promotes the guanine nucleotide exchange. 24 DBL and DOCK GEF families are unrelated in their amino acid sequence; nevertheless, they perform the GDP/GTP exchange on the well-conserved GTP-binding site of RAC proteins. 19
The interaction between proteins is considered to be a source of protein coevolution, 25 particularly for interactions that are important for a biological function; therefore, interacting proteins generally coevolve. 26 Evidence of molecular coevolution can be searched at the protein level by analyzing the similarities between corresponding protein orthologous phylogenetic trees.27,28 This approach has already been used successfully to estimate the level of coevolution of various different interacting proteins, including (1) the ligand SLIT and its receptor ROBO involved in axon guidance, 29 (2) peroxiredoxins and their coevolution across bacteria, archea, and eukaryotes, 30 and (3) the coevolution of insulin signaling pathway proteins, 31 among other examples.27,28 Also, mutual information and global statistical models of multiple sequence alignments have been developed to estimate the covariation between different proteins.27,28 Global statistical methods, in particular the direct coupling analysis (DCA), have shown a higher predictive power for recognizing the interacting residues between proteins.27,32 Covariation at the residue level during the course of evolution of interacting proteins suggests that compensatory changes have occurred to maintain their function, thus implying coevolution.26–28
Therefore, to understand how DBL and DOCK GEF families are able to perform the GTP/GDP exchange function upon RAC protein despite their unrelated protein primary structure, phylogenetic analyses of the RAC subfamily, as well as of the DBL and DOCK families, were implemented. Correlation coefficients of RAC–DOCK and RAC–DBL phylogenetic trees were estimated, and covariation of residues between GEF domains and RAC proteins was calculated. Together, the results of these analyses suggest that RAC and GEF proteins have coevolved in eukaryotes at different ratios and mainly through their interacting domains.
Results and Discussion
Evolution of RAC small GTPases
To investigate the evolutionary relationship of the human RHO GTPases, a rooted phylogenetic tree of the members of the human RHO family was performed (Fig. 1). The resulting phylogenetic tree confirms the presence of eight well-defined subfamilies of RHO proteins. The topology of the RAC subfamily observed here confirms the previous RAC topologies in RHO family phylogenetic analyses.13,33 RHOG is the most distant member of the RAC subfamily, which suggests that RHOG diverged first from the common ancestor of RAC proteins. Moreover, the present phylogenetic analysis shows that RAC1 and RAC3 are the most similar between them compared to RAC2, which has not been noted in previous studies.13,33
Phylogenetic tree of the human RHO family of GTPases. Protein members of the human RHO family were aligned, and RHOBTB3 was chosen as out-group. The eight subfamilies of the RHO family are labeled on the right side of the relevant clade. Bootstrap values >500 are shown. Subfamily labels were taken according to Bustelo et al, 2007.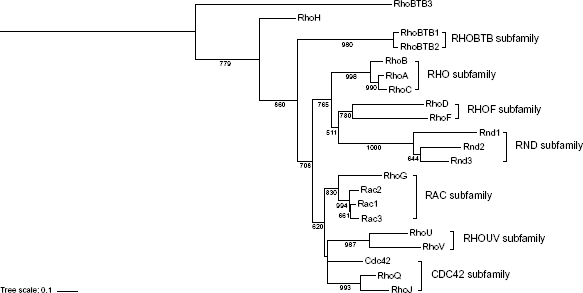
Previous studies have shown that the presence of small GTPases, including the RHO family, is almost ubiquitous among eukaryotes12,34,35 and that small GTPases have preserved the structural core features.33,36 To study the evolution of RAC proteins in eukaryotes, a phylogenetic analysis with all the known RAC protein homologs in eukaryotes was performed (Fig. 2A and Supplementary Table 1). The similarity between the RAC protein homologs in eukaryotes is very high. Furthermore, the relationship between RAC homologs is the same as in the tree of human RAC proteins (Fig. 2). This supports the hypothesis that RAC1 and RAC3 are more closely related, followed by RAC2, and RHOG being the most divergent member of RAC proteins.
Phylogenetic tree of the RAC subfamily homologs in the Eukarya taxon. (A) RAC protein homologs were aligned, and the phylogenetic tree was rooted using the RAC protein homologs found in the plants 
Coevolution of RAC and DOCK protein families
Human DOCK family of GEFs has 11 members, which have been grouped into four groups based on sequence similarity.
19
The phylogenetic tree confirms this similarity among DOCK members with bootstrap values of 100% (Fig. 3A). Also, DOCK1-5 and DOCK6-11 are more distant between each other than any other DOCK proteins. This result may be explained if DOCK1-5 and DOCK6-11 came from two different genes duplicated from a common ancestor. Besides, the interactions between RAC and DOCK proteins in humans appear to be promiscuous, since published data from experimental studies show that RAC1 interacts with all the members of the DOCK1-5 group19,37 and also with most of the members of DOCK6-11 group.19,37 To estimate the coevolution at the protein level between DOCK and RAC proteins, DOCK7 and DOCK1 were selected as the representatives of the DOCK6-11 and DOCK1-5 subgroups, respectively (see the “Methods” section). Correlation coefficients of RAC and DOCK orthologous phylogenetic tree distances were calculated using the MirrorTree method38,39 and compared with the negative control GAPDH correlation coefficients (Fig. 3B). The correlation between RAC1, -2, and -3 proteins and DOCK7 was significantly higher than the negative control, but none was significantly higher for DOCK1. Moreover, DOCK1 and RHOG have a very low correlation, but this could be an artifact due to the low number of DOCK and RAC orthologs in eukaryotes, which hampers the predictive power of the MirrorTree method.
40
As an orthogonal and phylogeny-independent method, the covariances of the DOCK domains and RAC proteins were estimated using a mean-field DCA.41,42 Covariance with GAPDH was used as a negative control and the covariance between the interacting domains of SLIT2 and its receptor ROBO1 was used as a positive control, since SLIT and ROBO proteins have coevolved significantly in vertebrates.
29
The top 1% covariation scores were compared because those residues are the most likely interacting ones.
41
As shown in Figure 3C, the covariation between RAC and DOCK domains was significantly higher than the negative control in all cases, which suggests that these domains have coevolved at a higher rate than the background protein coevolution in eukaryotes, and implies that the interaction specificity between RAC and DOCK proteins may be given by the GTPase and GEF DHR2 catalytic domains.
Coevolution of RAC and DOCK protein families. (A) Phylogenetic tree of the human DOCK protein members showing interactions with RAC proteins according to Rossman et al and the STRING database of protein interactions.
37
Transparency of represented interactions is based on the type of information that supports it. Bootstrap values >500 are shown. Arrows indicate DOCK members selected for coevolution analyses. (B) Pearson's correlation coefficient of evolutionary distances between RAC and DOCK proteins in eukaryotes (Supplementary Table 7). ***Correlation values significantly different from the negative control GAPDH, 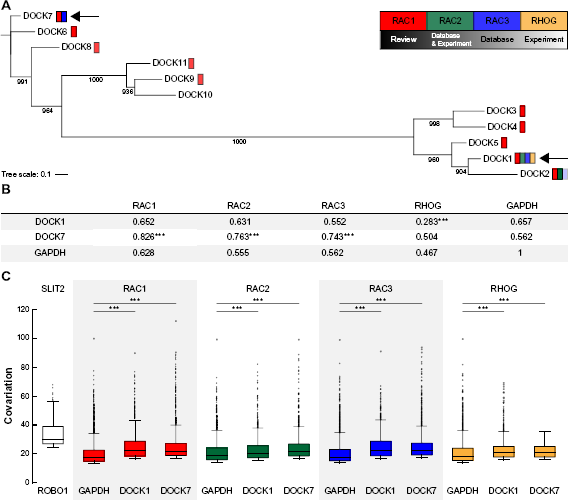
Duplication of the DOCK family common ancestor before eukaryotes
According to the HomoloGene data-base,
43
51 protein homologs of the DOCK family have been reported and 62 homologs have been predicted, which give a total of 113 sequences (Supplementary Table 2). To have a more readable phylogenetic tree, only DOCK homolog sequences of Phylogenetic tree of the DOCK family homologs in eukaryotes. (A) Phylogenetic tree of the DOCK family protein sequence homologs of different eukaryotes and the DHR2 homologs of the plants 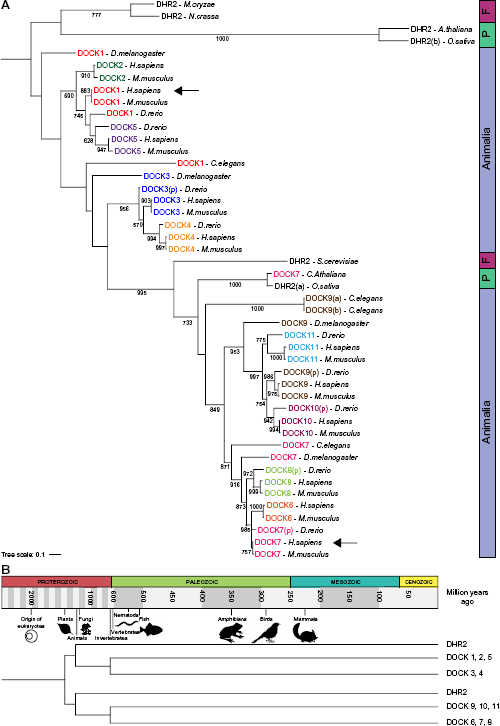
Coevolution of RAC and DBL protein families
Previous studies have analyzed the phylogeny of 59 and 69 DBL GEF proteins.15,19 Here, the human phylogenetic analysis includes 71 known human DBL members (Fig. 5 and Supplementary Table 3).
44
The phylogenetic tree shows that a few of the DBL clades are supported by bootstrap values above 70%, which confirms that the members of the human DBL family of GEFs are highly divergent. Furthermore, the pattern of interactions among RAC proteins and DBL GEFs is promiscuous as the interactions are not specific for any clade (Fig. 5A). ARH-GEF27, SOS1, and TRIO were selected as DBL representatives for each subgroup found in the phylogenetic tree among eukaryotes (Fig. 6A; see the “Methods” section), and their coevolution with RAC proteins was estimated. At the protein level, the most significant correlation between RAC and DBL was observed with TRIO, followed by SOS1, while no significant correlation compared to the negative control was detected with ARHGEF27 (Fig. 5B). However, when the covariation of DBL GEF domains with RAC proteins was analyzed, all comparisons were significantly higher than the negative control GAPDH (Fig. 5C). Together, these results suggest that RAC and DBL proteins have coevolved and that different rates of coevolution occurred in different clades of the DBL family. Moreover, the coevolutionary analyses suggest that the main point of interaction specificity between RAC and DBL proteins is the DH domain, which may help to explain the promiscuity of interactions between RAC and DBL proteins.
Coevolution of RAC and DBL protein families. (A) Phylogenetic tree of the human DBL family showing interactions with RAC proteins according to Rossman et al and the STRING database of protein interactions.
37
Transparency of represented interactions is based on the type of information that supports it. Bootstrap values >500 are shown. Arrows indicate DBL members selected for coevolution analyses. (B) Pearson's correlation coefficient of evolutionary distances between RAC and DBL proteins in eukaryotes (Supplementary Table 7). ***Correlation values significantly different from the negative control GAPDH, Phylogenetic tree of the DBL family homologs in eukaryotes. (A) Phylogenetic tree of the DBL family protein sequence homologs of different eukaryotes and the DH domain homologs of the fungi 
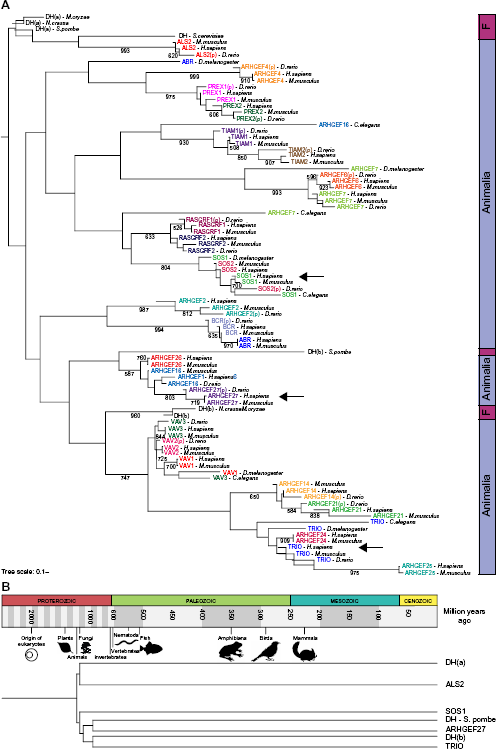
Finally, the divergence of DBL protein members in eukaryotes was assessed by construction of the phylogeny of DBL proteins that interact with RAC proteins according to Rossman et al. Due to the number of DBL homologs, only sequences from
Conclusions
The data presented in this study show that RAC proteins are well conserved among eukaryotes and raise the hypothesis that before the emergence of plants the RAC common ancestor gene was duplicated, followed by speciation of one gene in plants and the other gene in the other eukaryotes’ branch. Furthermore, RHOG, the common ancestor of the fungi RAC proteins, and the RAC1-3 of animals might have diverged first by gene duplication. Later, the common ancestor of RAC1-3 may have undergone gene duplication followed by speciation, one going into the fungi kingdom and the other going into the animal kingdom. Finally, it may be possible that one duplication event followed by speciation happened before arthropods and one last gene duplication event happened before the emergence of chordates, following by the appearance of RAC2, RAC3, and RAC1. Furthermore, these results suggest that RAC1 is the member that shares most sequence similarity with the RAC common ancestor.
Regarding GEFs, the human DOCK family members are very similar between each other; however, DOCK1-5 and DOCK6-11 may have evolved from two different genes duplicated before the emergence of the Eukarya taxon. The DBL family is much more divergent, and the interactions with RAC proteins are promiscuous. Nevertheless, the coevolution analyses suggest that RAC–DOCK and RAC–DBL proteins have coevolved at a higher rate than the background coevolution rate. At the protein level, the analyses of the correlation of tree distances show that within DOCK and DBL families, different subgroups have different correlation coefficients, and only some of them are significantly higher than the negative control, which may be related to the fact that different RAC and GEF proteins have different affinities. For instance, RHOG did not have a significantly higher correlation for any of the DOCK or DBL proteins, which might be a consequence of the fact that RHOG has acquired more changes in the course of evolution than the other RAC members, as shown by their branch lengths in the human and interspecies phylogenetic trees. At the residue level, both DOCK and DBL families show a higher covariation of their GEF domains with RAC proteins compared to the control, which suggests that a higher rate of coevolution has occurred between RAC and GEF proteins. The consistency between the covariation analyses compared to the mixed results of the phylogenetic correlations implies that, since the interaction between RAC and GEF proteins happened at the domain level, compensatory changes in the domains occurred during evolution, while other domains of GEF proteins changed and evolved independently of RACs. Therefore, the independent change of different domains within a protein would be a confounding factor that affect more protein-level coevolutionary approaches than residue-level ones. For instance, studies looking for mutations in cancer have shown that by analyzing protein domains, further statistical power can be obtained in the detection of common mutations. 45 Furthermore, the idea of restricting the coevolution phylogenetic analysis to the protein domain sequences has been already proposed. 46
Although these results suggest coevolution between RAC and GEF proteins, the analyses performed and the sequences used have limitations and potential biases. Namely, the interspecies phylogenetic analyses do not include all identified and predicted homologs. Moreover, the interspecies protein sequences were retrieved from the HomoloGene database, which is an automated system for gene homology detection in eukaryotic genomes. 43 Therefore, potential false-positive homologs could have been introduced in the interspecies analyses. However, to minimise this issue, sequences of model organism were preferentially selected, because model organisms have been more carefully annotated, more high-quality genomic information has been released and more experimental validated sequences are available. 43 Also, more sophisticated coevolutionary methods, such as pMT and ContextMirror,47,48 could be used to evaluate more precisely and corroborate the coevolution of RAC and GEFs at the protein level suggested in this study.
Overall, this study shows that RAC–DOCK and RAC–DBL proteins have coevolved in eukaryotes, particularly at the RAC–GEF-interacting domains, and that different ratios of coevolution may have occurred in different subgroups within DOCK and DBL families. These findings may help to explain the promiscuity of interactions between RAC and GEFs and provide a theoretical framework for further experimental validation. 28 Finally, potential implications in cancers driven by mutations in RAC, DOCK, or DBL proteins could be searched in future studies.
Methods
Amino acid sequence selection
The amino acid sequences used for the human phylogenetic analyses were downloaded from the “Reviewed (Swiss-Prot) – Manually Annotated” section of the Protein Knowledgebase (Uniprot) (Last modification August 28, 2015). 44 Uniprot accession numbers for the sequences used for the human phylogenetic analyses were compiled in Supplementary Tables 3, 4, and 5. The amino acid sequences used for the phylogenetic analysis among eukaryotes were downloaded from the HomoloGene database of the NCBI website. 43 HomoloGene accession numbers and species were compiled in Supplementary Tables 1, 2, and 6. The criteria for species selection were based on (A) evolutionary distance, (B) number of homologs, (C) number of validated homologs, and (D) preference was given to model organisms.
Phylogenetic analyses
The sequences selected were first aligned using the ClustalX software version 2.1 for each phylogenetic analysis. 49 The tree analyses were performed using the neighbor joining clustering algorithm. 50 Positions with gaps were excluded, and the analyses were corrected for multiple substitutions. A total of 1000 bootstrap runs were performed with 111 random number generator seed. All phylogenetic trees were visualized using the online tool Interactive Tree Of Life. 51
Selection of representative proteins for coevolutionary analyses
Per each subgroup identified in the interspecies phylogenetic analyses of DOCK and DBL families, one representative protein was selected. The representative GEF proteins were selected based on the following criteria: (A) number of species having an ortholog (Supplementary Tables 1, 2, and 6), (B) number of RAC proteins they interact with, and (C) information supporting interactions with RAC proteins. The reported interactions were retrieved from Rossman et al and the STRING 10 database for protein interactions. 37 Only physical interactions reported in databases and experimental data were considered.
Coevolution analyses at the protein level
The MirrorTree server was used to calculate the protein family tree similarities of RAC and GEF proteins.
39
The MirrorTree method calculates the correlation coefficients of the tree distances between orthologous members of the protein families.
38
Default parameters and the complete MirrorTree workflow were used. Correlation coefficients with GAPDH protein family tree in eukaryotes were used as negative controls. Statistical significance of the differences of Pearson's correlation coefficients between RAG–GEF values and controls was calculated using Fisher's
Coevolution analyses at the residue level
The covariation between the residues of RAC and GEF domains was estimated using the interprotein-correlated mutations server.
41
The mean-field DCA (EVfold-mfDCA) coevolutionary algorithm was used because it is independent of the phylogenetic history and has a higher predictive power than other methods.
27
The top 1% of covariation scores were compared between pairs, since these residues are the most likely interacting partners.
41
The covariation between the interacting domains of the receptor ROBO1 and its ligand SLIT2 was used as positive control, since it has been reported that these proteins have significantly coevolved in vertebrates.
29
The covariation between RAC proteins and GAPDH was used as negative control. Statistical significance was calculated using a Kruskal–Wallis rank sum test and a multiple comparison test after Kruskal–Wallis with the Bonferroni
Author Contributions
Conceived and designed the article: AJ-S. Analyzed the data: AJ-S. Wrote the article: AJ-S. The author reviewed and approved of the final manuscript.
Supplementary Material
The file Supplementary_tables.xls contains eight supplementary tables, six for the phylogenetic trees and two for the coevolution analyses.
Supplementary Table 1
RAC HomoloGene IDs used in Figure 2A.
Supplementary Table 2
DOCK and DHR2 HomoloGene IDs used in Figure 4A.
Supplementary Table 3
Gene names and Uniprot IDs for the human DBL family members used in Figure 5.
Supplementary Table 4
Gene names and Uniprot IDs for the human RHO family members used in Figure 1.
Supplementary Table 5
Gene names and Uniprot IDs for the human DOCK family members used in Figure 3.
Supplementary Table 6
DBL and DH HomoloGene IDs used in Figure 6A.
Supplementary Table 7
MirrorTree analyses.
Supplementary Table 8
Mean-field direct coupling analyses.
Footnotes
Acknowledgments
The author gratefully acknowledges Professor J. Peter W. Young for his insightful suggestions on the phylogenetic analyses and Dr. Michael Gill for his useful comments on the article.