
Abstract
The amount of phylogenetically informative sequence data in GenBank is growing at an exponential rate, and large phylogenetic trees are increasingly used in research. Tools are needed to construct phylogenetic sequence matrices from GenBank data and evaluate the effect of missing data. Supermatrix Constructor (SUMAC) is a tool to data-mine GenBank, construct phylogenetic supermatrices, and assess the phylogenetic decisiveness of a matrix given the pattern of missing sequence data. SUMAC calculates a novel metric, Missing Sequence Decisiveness Scores (MSDS), which measures how much each individual missing sequence contributes to the decisiveness of the matrix. MSDS can be used to compare supermatrices and prioritize the acquisition of new sequence data. SUMAC constructs supermatrices either through an exploratory clustering of all GenBank sequences within a taxonomic group or by using guide sequences to build homologous clusters in a more targeted manner. SUMAC assembles supermatrices for any taxonomic group recognized in GenBank and is optimized to run on multicore computer systems by parallelizing multiple stages of operation. SUMAC is implemented as a Python package that can run as a stand-alone command-line program, or its modules and objects can be incorporated within other programs. SUMAC is released under the open source GPLv3 license and is available at https://github.com/wf8/sumac.
Introduction
In pursuit of large-scale evolutionary questions, biologists are increasingly using massive phylogenetic datasets to reconstruct evergrowing portions of the tree of life. These large phylogenetic trees are commonly inferred using a supermatrix approach, in which multiple datasets are combined and analyzed simultaneously. 1 However, assembling and utilizing supermatrices is challenging due to difficulties such as determining homology of molecular sequences, assembling chimeric operational taxonomic units, and managing the amount of missing data. Despite these challenges, considerable bioinformatic advances have made large supermatrix-based phylogenetic analyses more common.
Multiple software tools for building supermatrices are already available to evolutionary biologists. The PhyLoTA Browser 2 provides a web interface to view all GenBank sequences within ta xonomic groups clustered into homologs. A different approach is implemented in the programs, such as PHLAWD 3 and NCBIminer, 4 which mine GenBank for sequence clusters homologous to guide sequences provided by the user. The method implemented in Supermatrix Constructor (SUMAC) combines elements of both approaches; the user can perform an exploratory clustering of all GenBank sequences within a ta xonomic group or provide guide sequences to build homologous sequence clusters in a more targeted manner. Furthermore, by calculating supermatrix assessment metrics derived from the concept of phylogenetic decisiveness, 5 SUMAC provides a unique toolkit with which GenBank can be repeatedly mined using different settings and the resulting data matrices can be compared. In this article, my objectives are to (1) introduce the SUMAC software, (2) describe a novel metric that assesses the effect of missing data in phylogenetic supermatrices, and (3) illustrate the use of SUMAC with a case study.
Implementation
SUMAC is a Python package designed to run as a standalone command-line program, though the modules can also be imported and used in other Python scripts. When run from the command line, SUMAC will perform a number of steps to construct a supermatrix. First, SUMAC creates a local SQLite3 6 database of the specified GenBank division (eg, PLN or MAM), automatically downloading sequences from NCBI if necessary. Using NCBI taxonomy, SUMAC searches the local database for all sequences in the user-specified ingroup and outgroup. Found sequences are then clustered as putative homologs in one of the two ways: (1) performing exhaustive all-by-all BLASTn 7 comparisons of each ingroup and outgroup sequence and using a single-linkage hierarchical clustering algorithm or (2) user-provided guide sequences that typify each cluster are BLASTed against all ingroup and outgroup sequences.
By default, SUMAC clusters sequences using the SLINK
8
single-linkage hierarchical clustering algorithm. This achieves O(n
2
) time complexity by representing the dendrogram of hierarchical sequence clusters in pointer representation. Given n sequences and the dendrogram c, pointer representation consists of two functions:

The function Π(i) is the last sequence that sequence i clusters with, and Λ(i) is the distance h (the BLAST e-value) between sequence Π(i) and sequence i. SUMAC's default clustering depth is an e-value threshold of 1.0e–10 and a sequence length percent similarity threshold of 0.5, although both thresholds can be modified by the user with optional command-line arguments. If run with the command-line flag –hac, SUMAC will instead cluster sequences using a naive hierarchical agglomerative clustering (HAC) algorithm. Proposed by Sneath, 9 this single-linkage clustering algorithm uses an agglomerative scheme that merges the closest sequence clusters into consecutively larger clusters. However, with O(n3) time complexity, the HAC algorithm is considerably less efficient than the SLINK algorithm.
Once clustering is complete, SUMAC discards clusters that are not phylogenetically informative (<4 taxa), and aligns each cluster of sequences using MAFFT 10 with the –adjustdirection flag to ensure correct sequence polarity. The individual locus alignments are saved to enable gene tree inference, and then the alignments are concatenated by species binomial (based on the NCBI taxonomy) to create the final supermatrix. Finally, a number of metrics are reported, a graph indicating taxon coverage density is generated, and spreadsheets (in comma-separated values [CSV] format) are produced with the information about each DNA region and GenBank accession used in the supermatrix.
SUMAC utilizes Python's multiprocessing module 11 to parallelize BLAST comparisons and MAFFT alignments on multicore computer systems. SUMAC also depends on the Biopython 12 library for sequence manipulation.
Missing Sequence Decisiveness Scores
When run with the –decisiveness command-line flag, SUMAC will calculate the fraction of triples, a metric of the partial decisiveness (PD) of the sequence matrix. 13 PD measures how the arrangement of missing data in a multilocus sequence matrix limits the number of trees out of all possible trees that can be inferred. The fraction of triples is the easiest PD metric to compute and applies to the set of all rooted trees; it is the percentage of each possible set of three taxa, which all have sequence data for at least one of the same gene regions. Here, I extend the fraction of triples to calculate Missing Sequence Decisiveness Scores (MSDS), which measures the contribution of each individual missing sequence to the overall PD of the matrix. MSDS values are in the range [0, 1] and are only assigned to missing sequences. When the MSDS of a missing sequence is close to 1, the addition of new data will increase the PD of the matrix more than where MSDS is low. In this way, MSDS prioritizes which sequences to add to the matrix and identifies taxa or loci that contribute disproportionately to the lack of decisiveness in the matrix. SUMAC produces a graph that portrays the distribution of MSDS across the supermatrix (Fig. 1). PD metrics and MSDS can be applied to any multilocus phylogenetic matrix, thus SUMAC can calculate these metrics for user-provided sequence alignments as well as those mined by SUMAC from GenBank.

MSDS for a sequence matrix with 10 genes, 384 operational taxonomic units (OTUs), taxon coverage density of 0.26, and PD of 0.31.
Given a set X of n taxa and a collection S = {Y1,…, Y
k
} of subsets of X with an overall fraction of triples ε, the MSDS M
ij
of taxon i and locus j is

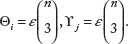
The calculations above are performed after substituting values for ε, εi for all i ∊ X and εj for all j ∊ S, which are computed using a modified version of Fischer's phylogenetic decisiveness decision problem algorithm for rooted trees. 14 This algorithm has an O(k · n3) time complexity.
Case Study
To demonstrate the utility of SUMAC for discovering phylogenetically informative sequences within GenBank, I compared the construction of a phylogenetic supermatrix using both the PhyLoTA Browser 2 and SUMAC. I did not use PHLAWD 3 or NCBIminer 4 since they only target genes already known to be of interest. The goal of this example was to build a supermatrix of the plant families Onagraceae (as an ingroup) and Lythraceae (as an outgroup) with as many informative loci as possible.
I searched the PhyLoTa database for the taxon names Onagraceae and Lythraceae, retrieving 5504 and2547sequences, respectively. PhyLoTa constructed supermatrics for each of the two groups separately, resulting in an Onagraceae supermatrix with 325 species and 43 phylogenetically informative sequence clusters. The Lythraceae supermatrix had 172 species and 77 phylogenetically informative clusters. Upon inspection, many of the sequence clusters should have been combined; for example, 8 of the 43 Onagraceae clusters were fragments of the 18S ribosomal gene. To use these data for a phylogenetic analysis, the 120 Onagraceae and Lythraceae clusters would need to be reviewed and manually combined.
I ran SUMAC with the command python -m sumac -d pln -i Onagraceae -o Lythraceae. SUMAC retrieved 5764 Onagraceae sequences and 3133 Lythraceae sequences. SUMAC found 846 more sequences than PhyLoTa because SUMAC always uses the latest available release of GenBank (release 205 in this case), whereas PhyLoTa was developed using GenBank release 194. SUMAC constructed an initial supermatrix of 599 Onagraceae and Lythraceae species consisting of 108 phylogenetically informative sequence clusters.
Similar to the results from PhyLoTa, some of the 108 sequence clusters should have been combined (again eight of the clusters were fragments of 18S ribosomal DNA). With SUMAC, however, the user has options to produce a more satisfactory data matrix. One option is to repeat the data-mining process using less stringent thresholds for clustering. These can be configured by the user with the –e-value and –length flags. Another option, and the one demonstrated here, is to select sequences from the recovered clusters to act as guide sequences and build homologous clusters in a targeted manner similar to the approach used in PHLAWD. This option combines the strengths of both the PhyLoTa and PHLAWD methods.
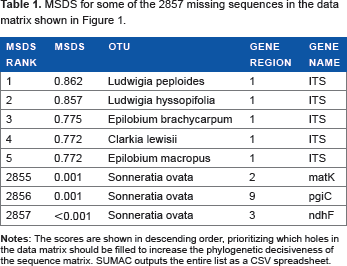
Of the 108 sequence clusters, I selected guide sequences from the 10 clusters with the highest taxon coverage. SUMAC was then run a second time using the –guide flag to produce a final supermatrix of 10 gene regions and 384 species (Fig. 1). The final taxon coverage density was 0.26 and the PD was 0.31. If necessary, this last step could be repeated using different gene regions to try to increase the decisiveness of the sequence matrix. Furthermore, SUMAC prioritized the acquisition of new sequence data by calculating MSDS for each missing sequence (Table 1).
MSDS for some of the 2857 missing sequences in the data matrix shown in Figure 1
Discussion
The advantage of the supermatrix approach to phylogenetic estimation is that it combines data from diverse sources into one large analysis. Using guide sequences makes supermatrix construction much faster; however, it requires a priori knowledge of which DNA regions will be used in the supermatrix. Performing all-by-all BLAST comparisons is computationally more expensive, but it effectively data-mines GenBank in an exploratory fashion, so that sequence data not necessarily used in previous systematic studies can also be incorporated into the supermatrix. SUMAC enables both options to be pursued and provides metrics to compare the resulting supermatrices. Additionally, GenBank can be repeatedly mined using different clustering threshold values to optimize the resulting sequence matrix for the taxonomic group being analyzed and the sequence data available.
MSDS quantifies the distribution of phylogenetic PD over a given multilocus sequence matrix (Fig. 1). Multiple properties of MSDS are worth exploring in an expanded simulation study. For example, sequences could be selectively removed from a complete dataset to examine how MSDS is related to phylogenetic uncertainty during tree inference. MSDS could be mapped onto the branches of phylogenies to determine the impact missing data have on the posterior probabilities and/or bootstrap values of clades.
With methodological refinements such as those presented here, supermatrix methods will continue to be widely used for large-scale phylogenetic studies. However, alternative approaches such as supertrees 15 and coalescent-based gene tree/species tree methods 16 are increasingly used. SUMAC outputs both a concatenated supermatrix and individual gene alignments, enabling the application of multiple phylogenetic inference methods. Many of the methodological advances developed for supermatrix approaches apply equally well to gene tree/species tree approaches, thus utilities such as SUMAC will continue to be indispensable as researchers aggregate increasingly large phylogenetic datasets and assess the effect of missing data.
Author Contributions
Designed and developed SUMAC and wrote the manuscript: WAF. The author reviewed and approved of the final manuscript.
Footnotes
Acknowledgments
I thank Bruce Baldwin, Andrew Thornhill, and Brent Mishler for advice and feedback. Helpful comments were also given by three anonymous reviewers. Publication made possible in part by support from the Berkeley Research Impact Initative (BRII) sponsored by the UC Berkeley Library.