
Abstract
The duck is one of the most economically important waterfowl as a source of meat, eggs, and feathers. Characterizing the genetic variation in duck species is an important step toward linking genes or genomic regions with phenotypes. Human-driven selection during duck domestication and subsequent breed formation has likely left detectable signatures in duck genome. In this study, we employed a panel of >1.4 million single-nucleotide polymorphisms (SNPs) identified from the RNA sequencing (RNA-seq) data of 15 duck individuals. The density of the resulting SNPs is significantly positively correlated with the density of genes across the duck genome, which demonstrates that the usage of the RNA-seq data allowed us to enrich variant functional categories, such as coding exons, untranslated regions (UTRs), introns, and downstream/upstream. We performed a complete scan of selection signatures in the ducks using the composite likelihood ratio (CLR) and found 76 candidate regions of selection, many of which harbor genes related to phenotypes relevant to the function of the digestive system and fat metabolism, including TCF7L2, EIF2AK3, ELOVL2, and fatty acid-binding protein family. This study illustrates the potential of population genetic approaches for identifying genomic regions affecting domestication-related phenotypes and further helps to increase the known genetic information about this economically important animal.
Keywords
Introduction
One of the goals of livestock genomics research is to identify the genetic variation responsible for variation in phenotypic traits, particularly those of economic importance. Characterizing the genetic variation is an important step toward linking genes or genomic regions with phenotypes. The duck is one of the most economically important waterfowl as a source of meat, eggs, and feathers. 1 The duck is very important in some regions of the world, mainly in eastern and southern Asia. The total number of slaughtered ducks has increased significantly for several years in the commercially slaughtered poultry.
The completion of the duck genome sequence and recent advances in DNA sequencing (DNA-seq) technology allow for in-depth characterization of the genetic variations present in duck. Duck genome assembly is based on a domesticated individual from the Beijing breed, containing 78,487 scaffolds with an N50 value of 1.2 Mb and a set of 19,144 genes. The size of the duck genome assembly is 1.1 billion bases, and the heterozygosity rate was estimated to be 0.26%. 1 The single-nucleotide polymorphisms (SNPs) identified in the duck represent an essential step for future improvement of economically important traits through genetic association studies. Certain SNP markers associated with reproductive traits in ducks, especially hatchability, were identified, such as lysozyme, 2 ovomucoid gene, 3 and COLX gene. 4 However, to date, very limited SNPs have been identified within the whole duck genome assembly.
Transcriptome analysis has rapidly been shaped by next-generation sequencing technologies, as the benefits of RNA sequencing (RNA-seq) were acknowledged. The direct sequencing of cDNA libraries in RNA-seq allows for the discovery of new genes, transcripts, alternative splice junctions, fused sequences, and novel RNAs. RNA-seq has extensively been used to study the profile of gene expression, allelic difference in expression, transcriptome characterization, RNA-protein interactions, and alternative splicing. 5 However, very few studies have reported on the viability of SNP detection using RNA-seq.6–10 Accurate mapping of junction reads to their genomic origins is crucial for avoiding mismatches that are interpreted as false SNPs. However, to date, very few computational pipelines for SNP calling have the ability to map reads in a splice-aware manner, 11 which poses a challenge to accurate SNP detection in RNA-seq data rather than that in DNA-seq data (whole-genome resequencing or exome data).
The complete intraspecific genome can be applied to inspect variants that have been subject to positive selection in the recent past. In theory, a beneficial variant that has been under the pressure of selection will generate distinct patterns in the respective region of the genome, such as reduction in variability and increase in linkage disequilibrium. Accordingly, the beneficial loci can be detected by examining the SNP patterns in intraspecific genome alignments. A number of statistical methods based on different demographic models have been proposed in the recent decades, such as Tajima's D, 12 Hudson–Kreitman–Aguadé test, 13 Fay and Wu's H test, 14 fixation index, 15 composite likelihood ratio (CLR), 16 extended haplotype homozygosity, 17 and integrated haplotype score. 18 Recently, the technical development of sequencing and SNP chips has provided us with high-density markers, enabling the identification of genome-wide selection signatures. Nielsen et al. 19 introduced two major modifications to the CLR method 16 for detecting selective sweeps in whole-genome data, which were based on the site frequency spectrum (SFS) method and implemented in the software, SweepFinder. Based on the code of SweepFinder, Pavlidis et al. 20 developed a faster and more accurate selective sweep detector, termed SweeD. A neutral SFS can be obtained in SweeD without the need to compute the empirical average SFS for the genome. If successful, the detection of selection signatures can provide a straightforward insight into the mechanisms of artificial selection and further uncover the causal genes related to the phenotypic variation.
Here, we describe the transcriptome sequencing of 15 ducks from distinct breeds for the purpose of identifying and annotating the novel forms of genetic variation in ducks using highly accurate SNP calling methods. By analyzing the nucleotide diversity using sequencing data, we aim to identify genomic regions exhibiting the signatures of selection and positional candidate genes reported in proximity to the genomic positions, showing the most significant indications of selection, and to gain a further insight into the genome-wide footprints of duck selection. In addition, the functions associated with the genes putative under selection regions were investigated by gene set enrichment analysis on gene ontology (GO) annotations.
Materials and Methods
Experimental animals
In this experiment, four individuals from the Baigai breed, two from the Ma breed, one from Liancheng White, and one from Longsheng Green were sampled. The RNA-seq data of seven HBK–SPF individuals from Peking duck breed were retrieved from NCBI SRA database. Three feather bulbs from the same individual were pooled as one sample. All research involving animals were conducted according to the regulation (No. 5 proclaim of the Standing Committee of Hubei People's Congress) approved by the Standing Committee of Hubei People's Congress, and the ethics committee of Huazhong Agricultural University, P. R. China.
Preparation of Illumina libraries and sequence analysis
Feather bulbs were put into 2-mL tubes containing 1-mL TRIzol reagent (Invitrogen). A magnetic bead homogenizer was used to homogenize the tissue and TRIzol. The quality and quantity of RNA samples were detected by Spectrophotometer ND-1000 (NanoDrop) and denaturing agarose gel electrophoresis. All RNA samples were treated with DNAse I for later use. RNA-seq libraries were constructed using the mRNA-Seq Prep Kit (Illumina) and then sequenced using the paired-end sequencing module of the Illumina HiSeq 2000 platform (100 bp at each end). Low-quality reads were trimmed by trimmomatic toolkit with default options. 21
SNP calling
The scaffold sequences and transcriptome sequences of the duck genome were retrieved from the Ensembl database. We used two approaches to identify SNP: (1) GATK–DNA-seq 22 combined SNPiR pipeline 11 and (2) the recently developed GATK–RNA-seq.
In the first approach, we used the Burrows-Wheeler Aligner 23 to map RNA-seq reads against both the reference genome and the transcriptome. We mapped each of the paired-end reads separately to the reference genome using the commands “bwa aln fastqfile” and “bwa samse -n4.” We use BWA to map the data to transcriptome with commands “bwa aln fastq-file1,” “bwa aln fastqfile2,” and “bwa sampe.” For the mapped reads, we used IndelRealigner (default), Table Recalibration (default), and Unified Genotyper (“stand_call_conf = 0,” “stand_emit_conf = 0,” and “output mode = EMIT_ALL_CONFI-DENT_SITES”), successively, from GATK for DNA-seq 22 to local realignment, base score recalibration, and candidate SNP calling nearly as suggested by “Best Practices Workflows” in the manual of GenomeAnalysisTK–2.8–1. We called variants with these loose criteria in GATK, which allowed a high sensitivity of SNPiR pipeline 11 to filter the candidate SNPs. We required candidate SNP call with the quality of Q > 20. These filters in the SNPiR pipeline included the removal of false calls in duplicated regions, mismatch sites at 5’ read ends, sites in repetitive regions according to RepeatMasker annotation, intronic sites within 4 bp of splice junctions, and sites in homopolymer runs of >5 bp. Then, BLAT 24 was used to map all reads against the duck genome to support unique mapping of the SNPs. In the second approach, we applied a method recently developed in GTAK 3.0 specifically for calling variants in RNA-seq (GATK–RNA-seq). In brief, the key modifications made to GATK–RNA-seq focus on handling splice junctions correctly, which involves specific mapping by STAR aligner 25 and the procedures, including SplitNCigarReads (with parameters: -RMQF 255 -RMQT 60 -U ALLOW_N_CIGAR_READS), Recalibration (default parameters), HaplotypeCaller (with parameters: -dontUseSoftClippedBases -stand_call_conf 20.0 -stand_emit_conf 20.0), and HaplotypeCaller (with parameters: -window 35 -cluster 3 -filterName FS -filter “FS > 30.0” -filterName QD -filter “QD < 2.0”). We merged the resulting variants in VCF4.0 format from the two SNP calling approaches. The consensus variants, with the SNP quality of Q < 20, with minor allele frequency of <0.05, or with >50% missing genotypes within the sampled individuals, were filtered.
The gene-based analysis of SnpEff software 26 with standard settings was used to functionally annotate the putative SNPs. For each SNP, the location (exonic, intronic, intergenic, 5'UTR, 3'UTR, splice acceptor or donor site, downstream or upstream) and the functional annotation (nonsynonymous, synonymous) were determined based on the duck reference genome. 1 Gene annotations used in this analysis were taken from the Ensembl database (BGI_duck_1.0.75). For genome-wide detection of positive selection signatures, we converted the genome coordinates of SNPs from scaffold level to duck chromosomes using information from duck Radiation Hybrid (RH) genome maps (unpublished), which was built from the duck RH panel. 27
Detecting positive selection
We first conducted the admixture analysis using NGSadmix 28 to roughly estimate the introgression among different populations. Then, we performed the CLR test using the information from allele frequencies to identify completed sweeps, and the statistic was calculated for a non-overlapping sliding window of 100 kb across each chromosome respectively. In this process, the SFS of the entire chromosome was considered as the background SFS to calculate the composite likelihood of a recently completed selective sweep in each window. To obtain the empirical distributions of CLR, a neutral sequence equal to each chromosome in length was simulated 10,000 times using ms 29 with the given epoch demography of the instantaneous size change followed by exponential growth (with parameters: ms 30 10000 -t 80 -G 6.93 -eG 0.2 0.0 -eN 0.3 0.5). To convert from the ms parameter, we assumed a mutation rate of 10-8 per site per generation and considered a segment 100 kb pairs long. Then, a threshold value of significant CLR for each chromosome is determined at P ≤ 10E-4.
The GO terms were performed using the Database for Annotation, Visualization and Integrated Discovery (DAVID). 30 First, we retrieved the Ensembl IDs of the genes, which were considered to be overlapping if their positions were contained inside the candidate regions of selection. The DAVID was used to analyze enrichment in the GO terms using 257 human orthologs from the 329 duck genes. The GO terms with P-values < 0.05 and with a false discovery rate of <25% were used for further analysis in our study.
Results and Discussions
We identified SNPs in the transcriptome of 15 samples using the GATK–DNA-seq
22
combined with the SNPiR pipeline.
11
In total, we were able to detect 916,407 variants by mapping to the reference genome, and 175,998 variants were called by mapping to the transcriptome, yielding 974,251 unique variants in total (Fig. 1). Utilizing the transcriptome for mapping short reads only provides an additional 57,844 variants, mainly because the splice junctions from gene models annotated in the reference duck genome are currently limited. Thus, we applied an approach recently developed in GATK–RNA-seq. Then, 1,196,422 variants were detected in the RNA-seq of 15 samples according to the Best Practices Workflows of GATK–RNA-seq (Fig. 1). We merged the resulting variants from the two SNP calling approaches to obtain 1,468,452 unique SNPs in the duck genome (Fig. 1). The resulting SNPs were deposited into the Database of Short Genetic Variation build 145 (http://www.ncbi.nlm.nih.gov/snp/) with NCBI Submitted SNP (ss) number (1939971667–1947221053). Our result exhibited a transition-to-transversion (ts/tv) ratio of 2.06 for the entire duck genome, which is similar to the overall ts/tv ratio of 2.0–2.1 for the entire human genome.
31
Previous studies have established an expected higher ts/tv ratio (3–4) for human coding regions.
32
We found an estimated ts/tv ratio of 3.51 for duck exonic regions in our study, a good reflection of the genomic variation in transcribed regions.
Comparison of SNPs identified by the two approaches. We detected 916,407 SNPs by mapping to the reference genome (green) and 175,998 SNPS were called by mapping to the transcriptome (purple), which composed 974,251 unique variants using GATK–DNA-seq combined with the SNPiR pipeline. Besides, we applied the approach of GATK–RNA-seq and then detected 1,196,422 variants (red).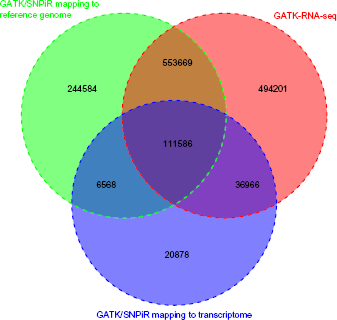
To date, a specific challenge to call a variant in RNA-seq data is to quantify accurately a different number of mapped reads to the reference genome and then to determine whether a variant exists. Accurate variant calling could be hampered by (1) highly similar regions in the genome, (2) the library construction for mRNA-seq and the inability to map reads in a splice-aware manner, and (3) the RNA-editing and allele-specific expression, which could mimic SNPs or bias allele frequencies. 33 These hindrances, especially the last one, may have resulted in false positive SNP calling in our study. However, there are not yet any other sources of duck SNP data (like resequencing or exome data) to validate our result variants.
The admixture proportions were estimated from genotype likelihoods using NGSadmix.
28
A graphic representation of cluster structure analysis is depicted in Figure 2. There had already been a significant differentiation between Baigai White, Ma–Liancheng White, and Peking duck populations, while Longsheng Green had shown admixture with all three of those populations.
Admixture plot presenting genetic structure for 15 duck individuals. The length of each colored segment represents the proportion of the individual's genome from K = 3 ancestral populations. The single color bar in Baigai White, Ma–Liancheng White, and Peking duck means that there is no admixture.
Enrichment of variants in functional categories
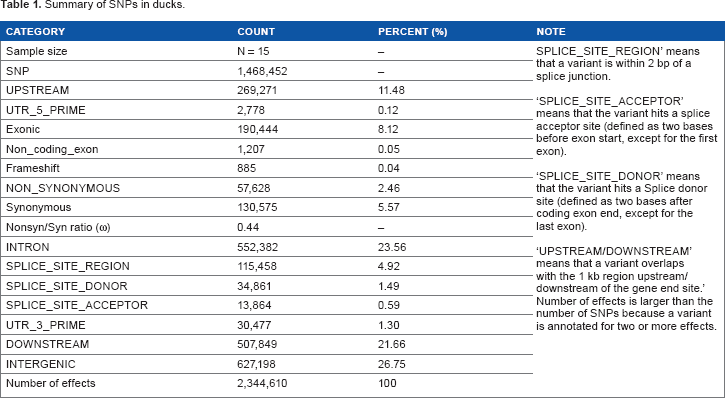
Summary of SNPs in ducks.
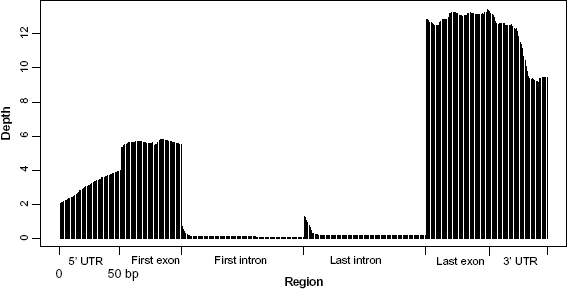
Average read depths on different elements (UTR, exon, intron) of 165 genes randomly selected from the duck transcriptome. The ~10 × coverage at the 3’ end (far right) trailing off to ~3 × by the time you get to the 5’ end (far left) indicated that in some cases, a portion of the 5’ end of a transcript has already been lost in the preparation of RNA-seq. The lower coverage at the 5’ end of transcript resulted in less SNPs calling at the 5’ end than that in the 3’ end. The much lower density of SNP calls in intronic regions and the lower quality of these SNPs are mainly because of very low coverage of short reads in RNA-seq data.
RNA degrades quickly, so poly(A)+ selection may catch the 3’ end of an mRNA that is already breaking down, which means that some portion of the 5’ end has already been lost. As a result, mRNA-seq coverage when polyA selection protocols have been used in our study is deeper at the 3’ end of genes and comparatively sparse at the 5’ end. For example, of 165 genes, as shown in Figure 3, there is ~10 × coverage at the 3’ end (3'UTR and last intron on the far right), trailing off to ~3 × by the time you get to the 5’ end (5'UTR and first intron on the far left).
Genome-wide scanning for selection signatures
We applied the CLR test to scan for genomic regions showing the signals of recent selection in the duck genome. 20 The regional SFS was compared with the background SFS to calculate CLR, which indicates the likelihood of a signal at each window of 100 kb in length across the whole genome. Significance was determined by the threshold value deriving from the empirical distribution of neutral scenarios simulated in the software ms. 29 A total of 126 windows had a P-value of <10E-4, indicating that the CLR of these windows surpassed every CLR obtained from the distribution of 10,000 neutral simulations. As some of the 126 windows were adjacent to each other, these correspond to 76 distinct core regions (CRs) where the observed CLR value significantly exceeded neutral simulations. The results are presented in Table 1, which also includes the number of candidate regions and SNPs putative under selection for each chromosome. As shown in Figure 3, the transcriptome sequencing has significantly lower sequence coverage in non-coding regions, which certainly affects accurate variant calls in these regions compared with coding regions, and may bias the quality of CLR scan. We found that the DAF (absolute allele frequency) of coding SNPs is significantly larger than that of noncoding SNPs (one-tailed t-test, P < 2.2E-16), indicating that the SFS in coding and noncoding regions differs strongly. However, if regions with less callable reads were excluded, power to detect a selective sweep through the CLR could be lowered. We extracted all the 227,948 SNPs in UTR/exon regions and performed a CLR scan. The sweep result from the data of UTR/exon SNPs was comparable to the sweep result from that of whole SNPs.
Summary of significant CRs (P ≤ 0.01) and distribution of SNPs in five duck populations.
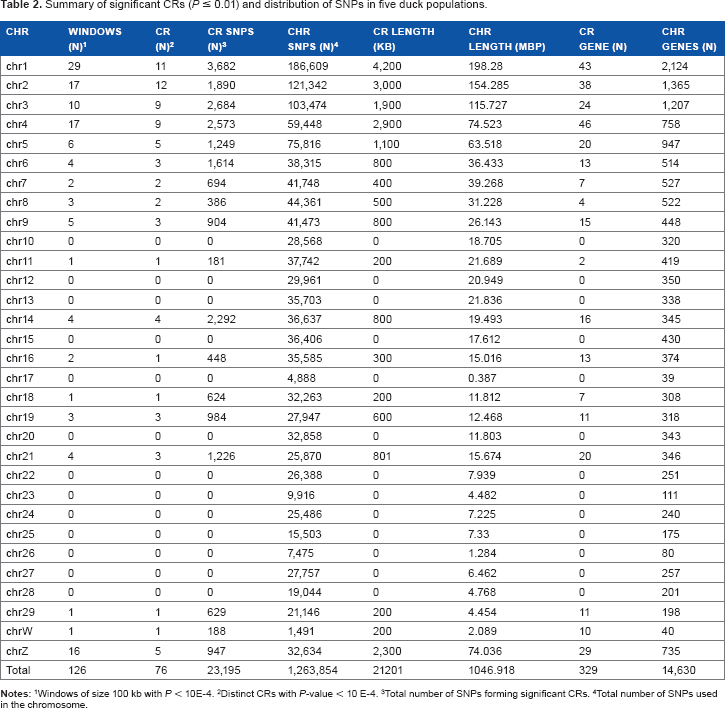
Windows of size 100 kb with P < 10E-4.
Distinct CRs with P-value < 10 E-4.
Total number of SNPs forming significant CRs.
Total number of SNPs used in the chromosome.
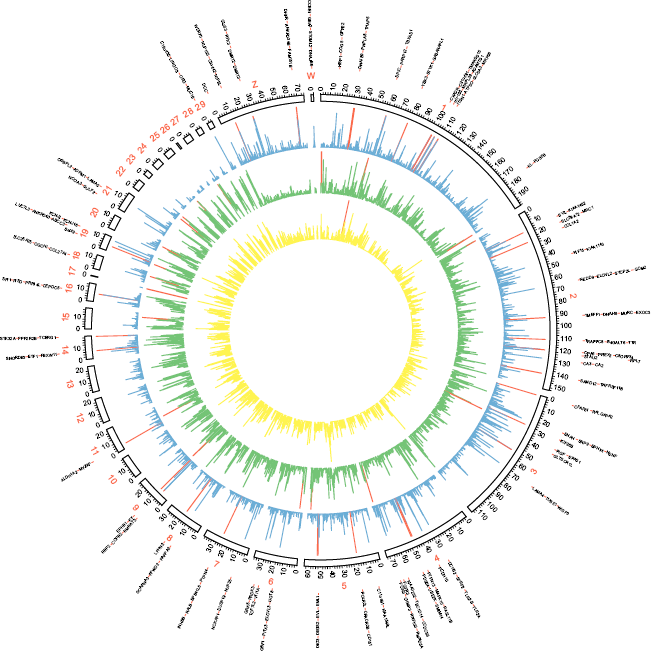
Circos plot of the global distribution of genes, SNP variants, and signature of selective sweep along with the genome. The circles from outside to inside illustrate gene density (yellow), SNP density (green), and CLR values (blue). The genes located in regions with significant strong sweep signatures are presenting as outliers. High values in each layout (gene density > 10/100 kb, SNP density > 1000/100 kb, and CLR value > 30) were marked in red histograms.
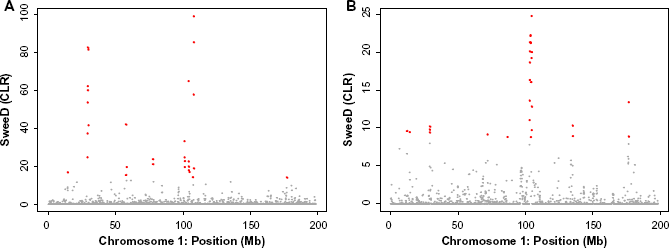
The result of selective sweep for the entire chromosome 1. (A) The scan of CLR for the sweep signal at each window of 100 kb in length across chromosome 1. We found outlier genomic regions with significant strong sweep signatures at a threshold of 10E-4 (shown in red). (B) The scan of CLR for the sweep signal at each window of 100 kb in length across the across chromosome 1 using only SNP data from the exon/UTR regions.
Involved genes and biological processes under selection
The enriched biological process of GO analysis.

Furthermore, the significant GO terms also included “fatty acid biosynthetic process (GO:0006633)” and “regulation of insulin secretion (GO:0050796).” As the fat traits in duck are related to meat quality and nutritive value, the fatty acid biosynthetic process is essential for duck breeding. The ELOVL2 gene is involved in the fatty acid biosynthetic process. Duck ELOVL2 may have the ability to convert α-linolenic acid to docosahexaenoic acid, 40 which is an important omega-3 fatty acid for humans. A previous study has reported that insulin plays an important role in the metabolism of glucose and lipid in poultry. 41 As insulin secretion is associated with pancreas development, the TCF7L2 gene takes part in pancreas development and regulation of insulin secretion. One non-synonymous SNP was also found in the TCF7L2 gene (Val > Ala at the position of the 145th amino acid). ΔN-Tcf712 transgenic mice, which lack the N-terminal β-catenin-binding domain, show impaired glucose tolerance with insulin secretion decreased. 42 Long-chain fatty acid transporter activity (GO:0005324, P = 5.9E-2) and fatty acid transporter activity (GO:0015245, P = 8.7E-2) were found to be significant in molecular function. The FABP1 and FABP2 genes, which were involved in those two terms, encode the fatty acid-binding protein (FABP) found in the liver or in the intestines. It is thought that the roles of FABPs include fatty acid uptake, transport, and metabolism. 43 We speculated that reasonable regulation of fat in domestic ducks was to cater to the requirements of humans. A previous study has reported that a number of genes in the significant CRs under selection may be important for controlling abdominal fatness in domestic chicken lines. 44
The current annotation of the duck genome has a limited availability of GO terms, which decreases the sensitivity of the analysis. Therefore, we could provide only suggestive evidences for the overrepresented annotations affected by positive selection.
In conclusion, we achieved high accuracy of SNP calling and enrichment of variants in functional categories using the RNA-seq data. This study provides a genome-wide map of selection signatures in duck genomes and yields insight into the mechanisms of selection in duck breeding. Our results show that genes related to the function of the digestive system and lipid metabolism may also experience positive selection.
Author Contributions
Conceived and designed the experiments: XD, SL. Analyzed the data: XD, RL. Contributed to the writing of the manuscript: RL, XD, YM, SP, LY, SL. Agreed with manuscript results and conclusions: SL, YG. All the authors reviewed and approved the final manuscript.
Footnotes
Acknowledgments
We thank Man Rao (INRA, Toulouse, France) for providing the chromosome sequences of duck genome.