
Abstract
Soluble starch synthases (SSs) are major enzymes involved in starch biosynthesis in plants. Cassava starch has many remarkable characteristics, which should be influenced by the evolution of SS genes in this starchy root crop. In this work, we performed a comprehensive phylogenetic and evolutionary analysis of the soluble starch synthases in cassava. Genome-wide identification showed that there are 9 genes encoding soluble starch synthases in cassava. All of the soluble starch synthases encoded by these genes contain both Glyco_transf_5 and Glycos_transf_1 domains, and a correlation analysis showed evidence of coevolution between these 2 domains in cassava SS genes. The SS genes in land plants can be divided into 6 subfamilies that were formed before the origin of seed plants, and species-specific expansion has contributed to the evolution of this family in cassava. A functional divergence analysis for this family provided statistical evidence for shifted evolutionary rates between the subfamilies of land plant soluble starch synthases. Although the main selective pressure acting on land plant SS genes was purifying selection, our results also revealed that point mutation with positive selection contributed to the evolution of 2 SS genes in cassava. The remarkable cassava starch characteristics might be the result of both the duplication and adaptive selection of SS genes.
Introduction
Cassava (Manihot esculenta Crantz) is a starch-containing root crop that is used as food for humans and animals and also for nonfood products. More than 70% of cassava production occurs in the subtropical and tropical regions between 30 degrees North and 30 degrees South of Africa, Latin America, and Asia by small-scale farmers. 1 The crop is widely grown as a staple food and animal feed in these regions, with a total cultivated area over 18 million ha.2,3 Cassava produces a high amount of starch, with levels of up to 90% of the total storage root dry weight. The characteristics of high starch production and the unique properties of its starch render cassava suitable for particular food and nonfood applications.1–3 However, little is known to date about the molecular mechanism of starch synthesis in cassava.
In higher plants, starch biosynthesis occurs in plastids and requires the cooperation of a series of biosynthetic enzymes, including ADP-Glc pyrophosphorylase (AGPase), starch synthase (SS), starch branching enzyme (BE), debranching enzyme (DBE), and plastidial starch phosphorylase (Pho1).4,5 Among them, SS functions in the elongation of linear glucan chains by catalyzing the transfer of the glucosyl unit of ADP-Glc to the nonreducing end of a glucan chain. The various isoforms of SS enzymes that have been identified in cereal endosperm thus far are GBSS, SSI, SSII, SSIII, and SSIV. GBSS is essential for amylose synthesis and is exclusively bound to the starch granule. However, other members of soluble starch synthases are responsible for amylopectin chain elongation, with distribution between the granular and soluble fractions. 6 In addition, each class of SS genes plays a distinct role in the synthesis of amylopectin. 7
The 2 particular Rossmann fold domains in SS and GBSS proteins distinguished in the Pfam database are Glycos_transf_1 (PF00534; GT_1) and Glyco_transf_5 (PF08323; GT_5), 8 and the presence of these 2 domains can be used to identify members of the SS protein family. Proteins containing Glycos_transf_1 function in the transfer of activated sugars to a variety of substrates, including glycogen, fructose-6-phosphate, and lipopolysaccharides, 9 whereas the Glyco_transf_5 domain is the catalytic domain of starch synthases that use ADP-glucose as the glucose donor. 10
Cassava, a starchy root crop grown in tropical and subtropical climates, is the sixth most important crop in the world after wheat, rice, maize, potato, and barley. Cassava starch has many remarkable characteristics, such as a high paste viscosity, high paste clarity, and high freeze-thaw stability, which are advantageous for many industries. 11 The SS gene family plays crucial roles in the biosynthesis of starch, and the structural features and physiological functions have been well described in cereals; in contrast, there is much less information about this family in cassava. The release of the entire cassava genome sequence provides the opportunity to investigate cassava SS genes on a genomic scale. In this study, we identified the members of the SS gene family in cassava. In addition, a comprehensive phylogenetic analysis of cassava SS genes was performed, including the phylogeny, gene structure, functional divergence, and adaptive evolution. The results of our bioinformatic analyses will provide the foundation for further functional detection of SS genes in cassava.
Material and Methods
Sequence collection
We performed multiple database searches to collect the potential members of the SS gene family in land plants. The nucleotide and corresponding amino acid sequences of rice SS genes 12 were obtained from the database of Rice Genome Annotation Project (RGAP, http://rice.plantbiology.msu.edu/), and the sequences of published Arabidopsis SS genes 13 were acquired from the TAIR database (http://www.arabidopsis.org/). The sequences of both the Arabidopsis and rice SS genes were used as queries to search land plants genes in Phytozome v9.1 (http://www.phytozome.net/). In addition, Basic Local Alignment Search Tool (BLAST) searches were also performed against the database of DOE Joint Genome Institute (http://www.jgi.doe.gov/). The Pfam tool was used to detect the conserved Glycos_transf_1 and Glyco_transf_5 domains. The exon/intron structures of the selected SS genes were collected from the databases of Phytozome, TAIR and RGAP and displayed with the help of Gene Structure Display Server (http://gsds.cbi.pku.edu.cn/).
Phylogenetic analyses
Multiple sequence alignments of the protein sequences selected in this work were performed using Clustal X; 14 gaps and ambiguously aligned regions were removed manually. The most appropriate protein substitution matrix, rate heterogeneity and invariant sites were determined using ModelGenerator 15 for land plant SS proteins. The phylogenetic analyses were performed with a maximum likelihood method using phylogenetic estimation using maximum likelihood (PhyML) 16 and a neighbor-joining (NJ) distance method using MEGA 5. 17 The maximum likelihood (ML) phylogenetic analyses were conducted with the following parameters: JTT model, estimated proportion of invariable sites, 4 rate categories, estimated gamma distribution parameter, and optimized starting BIONJ tree. The JTT model was also employed for the construction of NJ trees. Bootstrap support values were estimated using 100 pseudoreplicates, and the default settings were used for all the other parameters in the analyses. The branch lengths and topology were displayed using NJ phylogenetic tree.
Analysis of functional divergence
To investigate the functional divergence between subfamilies of land plant SS genes, the software DIVERGE 2 18 was employed to estimate the coefficient of type I functional divergence θI, the coefficient of type II functional divergence θII, and the likelihood ratio tests (LRTs) statistics between any 2 subfamilies. Type I functional divergence refers to the shifts in the evolutionary rate after duplication and is the indicator of changes in functional constrains; type II functional divergence is the result of cluster-specific alterations of amino acid physiochemical properties.19,20
Detection of positive selection
The approaches of Yang and coworkers21,22 were used to test for positive selection of the SS gene subfamilies. The transformation of the sequence alignment of proteins into the corresponding codon-based nucleotide alignment was performed by the online program PAL2NAL. 23 The codeml program in PAML 4.5 24 was then used to calculate the dN/dS ratio using the nucleotide alignment and corresponding phylogenetic tree as inputs. We detected variation in dN/dS among sites using LRTs, and the models tested were M3, M2a, and M8 versus the null models M0, M1a, and M7, respectively.
Improved branch-site models 25 were also used to search for positive selection by estimating different values of dN/dS for each cassava gene. For this analysis, we compared the null model (model = 2, NSsites = 2, with omega fixed to 1) with the alternative hypothesis (model = 2, NSsites = 2) to identify branches under probable positive selection: each cassava gene was used as the foreground, and the other land plant genes in the same SS subfamily were used as the background. When the likelihood ratio test was significant, the Bayes empirical Bayes method 26 was used to calculate the posterior probability that each site was subject to positive selection.
Coevolution analysis of 2 conserved domains
To test the possibility of the coevolution between 2 domains of SS proteins in cassava, Goh's 27 method was used to perform the correlation analysis on every possible domain -domain pair. The sequences of the Glycos_transf_1 and Glyco_transf_5 domains were intercepted from cassava SS proteins based on the results of domain identification. The sequence alignments of both domains were performed using CLUSTAL X 14 with the default parameters, and pairwise evolutionary distances for these 2 multiple alignments were calculated using MEGA 5. 17 The linear Pearson's correlation coefficient (r) between the distance matrices of these 2 conserved domains was calculated. Coevolution is inferred when r is significantly different from zero: a statistically positive value of r indicates a positive correlation between 2 domains, a value near zero indicates no correlation, and a statistically negative value of r suggests anticorrelation. 27 The statistical significance of the computed r value was tested by a bootstrapping analysis, yielding an estimate of the standard deviation of r given the size of our dataset and an estimation of the probability of obtaining the observed value of r by chance (P value). This method had been comprehensively illustrated in previous studies.27,28 The simulation for the statistical significance of the computed r value was performed using Matlab software.
Results and Discussion
Soluble starch synthase genes in cassava
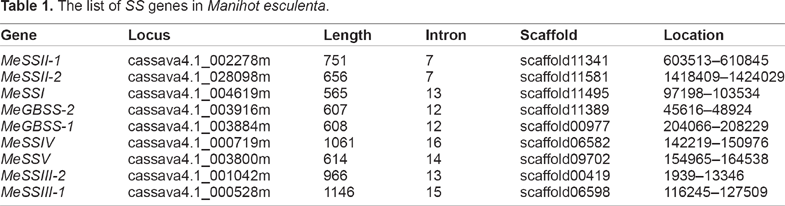
The identification of the members of soluble starch synthase genes in cassava was performed in 3 steps. The first step involved obtaining of the nucleotide and amino acid sequences of 10 known SS genes in Arabidopsis and rice from the databases of TAIR and RGAP, respectively. The second step aimed at a complete search for putative SS proteins in cassava and was performed by local BLAST searches using the Arabidopsis and rice SS genes as queries in cassava databases, which were downloaded from Phytozome v9.1. As the last step, each predicted SS protein sequence was confirmed by a Pfam search for the conserved Glycos_transf_1 and Glyco_transf_5 domains. After carefully surveying the cassava genome, 9 genes were defined as cassava SS genes (Table 1). The length of SS proteins in cassava ranged from 565 to 1146 amino acids, and each contained both a Glycos_transf_1 and a Glyco_transf_5 domain in their C-terminal region. In addition, we also noted that the proteins MeSSIII-1 and MeSSIII-2 contain 3 CBM_25 domains (PF03423.8) in their N-termini. The CBM_25 domain belongs to the carbohydrate-binding module family and has the ability to bind alpha-gluco-oligosaccharides, 29 suggesting that these 2 starch synthases possess carbohydrate-binding activity.
The list of SS genes in Manihot esculenta.
Coevolution between the Glycos_transf_1 and Glyco_transf_5 domains
According to the assumption that 2 domains must act synergistically for proper function to be present in a single protein, evolutionary changes in the sequence in 1 of these domains would cause either counterselection or redeeming alterations in the other domain. 30 Based on the identification of domain structure, each SS protein encoded by the cassava genome contained at least 2 evolutionarily conserved domains: the Glycos_transf_1 and Glyco_transf_5 domains. Therefore, these domains might have coevolved in cassava SS proteins. To test this assumption, a correlation analysis was used to evaluate the statistical significance of coevolution between the Glycos_transf_1 and Glyco_transf_5 domains. The correlation coefficient between the evolutionary distances of these 2 domains was 0.8830. The value was significantly greater than 0 at the level of P < 0.01 indicating that highly correlated coevolution between them had occurred during the evolution of cassava. In addition, we also tested the correlation coefficient of 2 domains in all land plant SS genes identified in this analysis, and the estimated value was 0.9361. Some researchers also recommended an upper cutoff of 0.8 for correlation coefficients for the coevolution of domains in a single protein, 27 and the correlation coefficient of these 2 conserved domains was also higher than 0.8. These results provide evidence for coevolution between the Glycos_transf_1 and Glyco_transf_5 domains, and the possible coevolution between them suggests the interplay of these domains and interaction with a putative partner or putative partners for SS protein function.
Phylogenetic relationship of SS genes
To evaluate the phylogenetic relationship of the cassava genes encoding soluble starch synthases, we characterized the SS genes from species that represent the main lineages of the land plants, including the moss Physcomitrella patens, the lycophyte Selaginella moellendorffii, and 3 monocot and 3 eudicot angiosperms (Supplementary Table 1). Two combined phylogenetic trees were constructed using the protein sequence alignment with the ML and NJ methods (Fig. 1). Both of these 2 trees showed the same topology: all the members of this family in land plants were clustered into 6 subfamilies, with well-supported bootstrapping values. All 6 subfamilies contain genes from both seed plants and mosses and/or lycophytes, suggesting that the main characteristic of this family in land plants was established before the origin of seed plants. We also noted that the subfamily SSV only contained the genes from dicots and S. moellendorffii, illustrating that this group originated prior to the origin of lycophytes and that its partner was lost in monocots. In addition, there is no orthologous gene in Arabidopsis, also suggesting a gene loss event in this model plant. We also found that the subfamily SSIII did not contain genes from P. patens. We also noted that the SS genes in seed plants were clustered together in all subfamilies and showed distinct evolutionary distance from those in nonseed plants, highlighting the differences between these groups.

Molecular phylogenies of the land plant soluble starch synthase family and their exon/intron structure in coding regions. The numbers above the major branches show the bootstrap values from maximum likelihood and distance analyses, respectively. Exons and introns are represented by boxes and black lines, respectively. Intron phases are also indicated on the diagram.
The lineage-specific expansion of gene families played an important role in the growth and differentiation of the proteomes of multicellular eukaryotes. 31 For example, it has been demonstrated that up to 80% of the genes in the genome of Arabidopsis fit the results of lineage-specific expansion. 32 Three pairs of cassava paralogous genes were identified on the terminal node of the phylogenetic tree, illustrating the lineage-specific expansion of this family in cassava after the split with other dicots. The increase in the members of a gene family is the result of gene duplication, which is important for the generation of new genetic material. In addition, duplication may also affect phenotype by changing the gene dosage. Thus, 3 duplicated events of SS genes may contribute to the characteristic of starch biosynthesis in cassava. Three principal evolutionary mechanisms are confirmed to contribute to gene duplications: segmental duplication, tandem duplication, and transposition events, such as retroposition and replicative transposition. 33 However, none of the 3 pairs of paralogs was located in the same scaffold, suggesting that tandem duplication did not contribute to the expansion of cassava SS genes. In addition, we also found that all 6 of these genes possessed many introns in the coding regions, illustrating that retroposition was not a contributor to the expansion of this family because the lack of an intron is a main characteristic of duplication via retroposition. 33 Therefore, segmental duplication might have contributed to the origin of these paralogous genes. The genes MeGBSS-2 and MeSSIII-2 were located in 2 short scaffolds, and it was difficult to detect conserved genes among the flanking regions with their paralogous partner. However, there were highly conserved genes among the flanking regions for 1 pair of paralogous genes, MeSSII-1/MeSSII-2, suggesting that this duplicated pair arose from segmental duplication events.
Exon-intron evolution of the SS gene family
The exon/intron structure can also provide important evidence to support phylogenetic relationships in a gene family. 30 To investigate the mechanisms of the structural evolution of SS homologs, we compared the exon-intron structure of individual SS genes in the tested land plant species. Figure 1 provides a detailed illustration of the distribution and position of introns within each of the SS genes. In general, the positions of the spliceosomal introns are conserved in the orthologous genes from the 6 subfamilies. In many cases, the intron phase is conserved as well in addition to a shared intron position, though the lengths of the introns at the same position in different genes differ greatly. The genes in subfamily SSI generally contain 13 or 14 introns, except for the members of P. patens, which do not possess any intron in the coding regions. To test whether P. patens gained or lost the introns during evolution, we compared them with those in Chlamydomonas reinhardtii. The phylogeny assigned the C. reinhardtii SS genes into 5 subfamilies, and only the subfamily SSIV did not contain C. reinhardtii genes (Supplementary Fig. 1). The genome of C. reinhardtii contained 2 genes of subfamily SSI, which possessed 10 and 16 introns, respectively. The positions and phases of most introns in CrSSI-1 and CrSSI-2 genes showed conservation with those in land plant genes. These results revealed that the P. patens genes in subfamily SSI had lost the introns during evolution. Most SS genes in the same subfamily exhibit similar exon/intron structure in the coding regions, further illustrating that they originated from the same ancestor and shared a close evolutionary relationship. However, the members of different subfamilies show large differences in their exon/intron structures. Such divergence in gene structures revealed that the SS gene subfamilies in land plants had multiple origins of gene ancestry.
Although the exon/intron structures were generally conserved among the members of a subfamily, some intron loss or gain events were also found in the long evolutionary period of this family. For example, PtGBSS-1 was found to gain an intron in the 3′ region, whereas SbSSIIIb lost an intron in the 5′ region. It has been demonstrated that intron loss or gain is an important step in generating structural diversity and complexity, 34 and the structural diversity of gene family members provides a mechanism for the evolution of gene families. However, the genes in cassava have no obvious evidence of intron gain and loss events when compared with their orthologs in other dicots.
Functional divergence between subfamilies
In our phylogenetic analysis, the land plant SS genes were broadly grouped into 6 subfamilies, and each subfamily was found to have originated from a single gene. To evaluate the potential functional divergence between subfamilies, type I and type II functional divergence between the subfamilies of the plant SS genes were estimated by a posterior analysis using DIVERGE 2. 18 This method is based on maximum likelihood procedures to estimate significant changes in the site-specific shift of the evolutionary rate (type I functional divergence) or site-specific shift of amino acid properties (type II) after the emergence of at least 2 subfamilies.19,20 Because this method uses amino acid sequences, one of its advantages is that it is not sensitive to the saturation of synonymous sites. 35 The collected plant SS proteins were used for this analysis, and the estimation was based on multiple alignments of proteins for any 2 subfamilies. The results showed that all the estimations of type I coefficients (θI) of functional divergence were statistically greater than zero, whereas none of the type II coefficients (θII) was significantly greater than zero (P > 0.05) (Table 2). Another feature of this analysis was that the estimates of θI were much larger than the estimates of θII. These results suggested that type I functional divergence was the dominant pattern for the differentiation between any 2 SS subfamilies and that significantly site-specific selective forces should contribute to most of the SS genes, leading to subfamily-specific functional evolution after diversification.
Functional divergence between subfamilies of the land plant SS gene family.

the number of critical amino acids for functional divergence with a posterior probability (Qk) > 0.95.
The crucial amino acids for type I functional divergence were also predicted based on site-specific profiles in combination with suitable cutoff values derived from the posterior probability of each com parison. Among a total of 422 aligned sites, most (>80%) had low posterior probabilities (<0.3). To comprehensively reduce positive false, Qk > 0.80 (Qk, posterior probability) and Qk > 0.95 were empirically used as cutoffs to identify the type I functional divergence-related residues between subfamilies. For any 2 subfamilies, there was at least 1 site that had a posterior probability higher than 0.80, and most pairs of groups had at least 1 site with a posterior probability higher than 0.95, except for the pairs SSI/SSV, SSIII/SSV, and SSIV/SSV. Using the SSI/SSII pair as an example, there were 5 acidic sites obtained for type I functional divergence, with a posterior probability higher than 0.95 (Supplementary Fig. 2). Two of these sites were located in the Glyco_transf_5 domain, and 1 was located in the Glycos_transf_1 domain. In addition, we also noted that only 1 site was conserved in the SSI subfamily but was diverged in the SSII subfamily, whereas the other 4 sites were all conserved in the SSII subfamily but diverged in the SSI subfamily.
Detection of cassava SS gene positive selection
Positive Darwinian selection has been demonstrated to be an important source of evolutionary innovation that drives the divergence of species. 36 The stringent and unequivocal single selective constraint on coding sequences is the ratio of dN (nonsynonymous substitutions per nonsynonymous site) to dS (synonymous substitutions per synonymous site). The value of dN/dS measures the quantity and direction of selective constraints on a functional gene, whereas dN/dS ≈ 1, dN/dS < 1, and dN/dS > 1 indicate neutral evolution, purifying (or negative) selection and positive selection, respectively. 37 To detect the selective pressure on cassava SS genes, the ML methods and codon substitution models of Yang and colleagues21,22,24 were used to evaluate the dN/dS ratios. In this analysis, we used the site-specific model to identify whether positive selection had acted on the evolution of each SS gene subfamily (Supplementary Table 2). Firstly, the comparison of models M0 and M3 was used to evaluate whether there were dN/dS ratio variations among the codon positions in each subfamily. Overall, the ML estimates of the dN/dS ratios for all the subfamilies under model M0 were <1, with a mean of 0.1108. This result suggested that purifying selection was the principal constraint acting on the evolution of SS gene subfamilies. However, the LRTs for the comparisons of models M3 and M0 were statistically significant for all subfamilies, revealing the existence of extreme variation in the selective pressure the among amino acid sites for all SS subfamilies. Secondly, the LRTs used to compare the data fit to models M2a versus M1a and M7 versus M8 were used to address whether positive selection promoted the divergence of each subfamily. To our surprise, none of the 6 subfamilies was found to be influenced by positive selection. These results suggested that purifying selection contributed to the functional stability of each subfamily of land plant SS genes.
Improved branch-site models 25 were used to test whether the cassava SS genes were influenced by positive selection after the split from other land plants. In this analysis, we used each cassava SS gene as the foreground and the other land plant genes in the same subfamily as the background to examine the potential for positive selection at specific sites for all the genes in cassava separately (Supplementary Table 3). Two cassava SS genes were found to be influenced by positive selection under this model: MeSSI and MeGBSS-1. Based on the results of the BEB analysis, MeSSI has 4 positively selected code sites, with having a posterior probability higher than 95% (Supplementary Fig. 3). Positively selected site 52 is located in the Glyco_transf_5 domain; this site encodes Gly in most other SSI subfamily genes, whereas it is a Phe in MeSSI. The other positively selected site in MeSSI is site 320, which is located in the Glycos_transf_1 domain. This site encodes a Met in MeSSI, whereas the amino acid encoded by this site is Asp or Glu in other members of this subfamily. The MeGBSS-1 gene has 2 sites influenced by positive selection, with only 1 having a posterior probability higher than 95% (Supplementary Fig. 4). One site encodes Arg in MeGBSS-1, whereas it is Ser or N Asn in other members of the GBSS subfamily. Positive selection pressure resulting in the directional change of amino acids is often the underlying mechanism of enzyme neofunctionalization. 38 Indeed, the persistence of positive selection in the MeSSI and MeGBSS-1 genes could involve a role in the adaptation to local environments or in functional innovation in cassava.
Funding
This work was supported by grants from the National Program on the Development of Basic Research (2011CB100100), the Priority Academic Program Development of Jiangsu Higher Education Institutions, the National Natural Science Foundations (31200943 and 31171187) and the Natural Science Foundations of Jiangsu Province (BK2012261, BK2012684).
Footnotes
Author Contributions
Conceived and designed the experiments: ZY, CY. Analysed the data: ZY, YW. Wrote the first draft of the manuscript: ZY. Contributed to the writing of the manuscript: CX, CY. Agree with manuscript results and conclusions: CX, CY. Jointly developed the structure and arguments for the paper: YW, CY. Made critical revisions and approved final version: ZY, YW, SX, CX, CY. All authors reviewed and approved of the final manuscript.
Competing Interests
Author(s) disclose no potential conflicts of interest.
Disclosures and Ethics
As a requirement of publication the authors have provided signed confirmation of their compliance with ethical and legal obligations including but not limited to compliance with ICMJE authorship and competing interests guidelines, that the article is neither under consideration for publication nor published elsewhere, of their compliance with legal and ethical guidelines concerning human and animal research participants (if applicable), and that permission has been obtained for reproduction of any copyrighted material. This article was subject to blind, independent, expert peer review. The reviewers reported no competing interests.
Supplementary Files
Supplementary Table 1. The list of land plant SS genes used for phylogeny reconstruction in this study.
Supplementary Table 2. Prediction of positive selection for each SS subfamily in land plants under the site-specific model.
Supplementary Table 3. Detection of positive selection for each cassava SS gene under the branch-site model.
Supplementary Figure 1. The phylogeny of plant SS genes including genes in C. reinhardtii. The numbers above the major branches show the bootstrap values from maximum likelihood and distance analyses, respectively. The loci for each C. reinhardtii gene are: CrSSI-1, Cre12.g521700; CrSSI-2, Cre04.g215150; CrSSII, Cre03.g185250; CrGBSS, Cre17.g721500; CrSSIII-1, Cre13.g579600; CrSSIII-2, Cre06.g282000; CrSSIII-3, Cre16.g663850; CrSSV, Cre16.g665800.
Supplementary Figure 2. The alignment and critical amino acids contributing to type I functional divergence between subfamilies SSI and SSII. Only the aligned amino acids are displayed. The sites with posterior probability higher than 0.95 for type I functional divergence are denoted by shadowing.
Supplementary Figure 3. The alignment of the SSI subfamily and the positively selected sites in MeSSI. The sites detected to be influenced by positive selection in MeSSI are denoted by shadowing.
Supplementary Figure 4. The alignment of the GBSS subfamily and the positively selected sites in MeGBSS-1. The sites detected to be influenced by positive selection in MeSSI are denoted by shadowing.