
Abstract
The insulin/insulin growth factor-1 (IGF1)/FOXO (IIF) signal transduction pathway plays a core role in the endocrine system. Although the components of this pathway have been well characterized, the evolutionary pattern remains poorly understood. Here, we perform a comprehensive analysis to study whether the differences of signaling transduction elements exist as well as to determine whether the genes are subject to equivalent evolutionary forces and how natural selection shapes the evolution pattern of proteins in an interacting system. Our results demonstrate that most IIF pathway components are present throughout all animal phyla investigated here, and they are under strong selective constraint. Remarkably, we detect that the components in the middle of the pathway undergo stronger purifying selection, which is different from previous similar reports. We also find that the dN/dS may be influenced by quite complicated factors including codon bias, protein length among others.
Introduction
The ability of organisms to respond appropriately to changes in their environment is one of the most important events in the evolution of life. Due to environmental changes, for higher eukaryotes it is essential to possess specialized mechanisms to maintain nutrition homeostasis between their food supply and energy demanding processes, such as growth, metabolism and reproduction. Indeed, the genes do not exert their functions separately, but form complex network, such as transcriptional network and biological signaling pathways. Some pathways play an important role in redirecting organism's resources toward activity, maintenance, and survival after dietary intake by individual organisms.1–3 These pathways, therefore, represent key molecular candidates for the environmental constraints of adaption through large changes in their morphology and their developmental programs. This may also be reflected at the physiological and molecular level.
4
In part, the organism's hormones were conceived in accurate execution of such developmental programs.5,6 One of the most critical pathways in hormones signal transduction is IIF and its components have been well annotated. The connection topology and the molecular functions of the components have been well characterized in different organisms, including
The components of the IIF pathway can be divided into three distinct phases according to interaction mechanisms: (1) Sensors (mainly InRs), the molecules responsible for insulin/IGF1 binding; (2) Transducers, the intracellular signaling components, which trigger a cascade of biochemical reactions to relay the signals (often through protein phosphorylation and dephosphorylation); and (3) Responses, the downstream effector elements. The transduction signal ultimately activates the effector elements in the pathway, which are involved in insulin-dependent cellular responses. Various signaling pathways are initiated by the binding of insulin/IGF1 to its receptor, and of these, the phosphoinositide 3-kinase–Akt/protein kinase B signaling pathway seems to be crucial in the ability of insulin to regulate metabolic homeostasis and protect from cell death. 13 Activation of Akt/protein kinase B results in the phosphorylation of FOXO, causing FOXO to remain localized in the cytoplasm. 14 As a result, FOXO cannot access its direct downstream binding targets. Here the FOXO proteins belong to “O” subfamily (FOXO1, FOXO3a, FOXO4 and FOXO6) of forkhead transcription factors. They regulate the transcription of target genes that are involved in metabolism. Apart from their roles in metabolism, FOXO members also mediate the survival-factor function of growth factors. 15 A simple scheme of IIF pathway components is shown in Figure 1 (modified from 16 ).

An illustration of the IIF pathway genes.
In previous studies, plenty of research on the insulin signaling pathway genes or proteins variation in their evolutionary rates have been illustrated. 17 These studies, however, have only focused on individual genes or gene families; consequently, the properties and mechanisms underlying pathway/network evolution remain largely unknown. Therefore, establishing the patterns of selection within a certain signaling transduction pathway allows us determine whether these genes are subject to equivalent evolutionary forces and how natural selection shapes the evolution of proteins in an interacting system.
A central question in the evolution of biochemical pathways concerns the role of the structure of signaling pathways. As known, some signaling pathways are structured in a way that the initial substrates in the pathway are ultimately transformed into several end products, based on the channeling of substrate into various branches of the pathway downstream. Therefore, Rausher et al 18 arrive at the conclusion that upstream genes should be more pleiotropic than those downstream and so should face greater selective constraint.18–20 The negative correlation between selective constraint and topological position has also been explained by the hierarchical organization of these pathways. Namely, the upstream genes play more important roles than the downstream ones, therefore stronger selection constraints will be receive to remove deleterious mutations in upstream genes. However, a correlation between pathway position and selective constraint levels with downstream genes evolving under stronger purifying selection has been already observed in a number of pathways, including the insulin/TOR pathway in Drosophila and vertebrates.21,22 It is still perplexing whether this correlation is a general trend for all IGF pathways or specific for insulin/TOR. Therefore, we will address this question on a well-characterized IIF pathway.
In recent years, the sequencing of a large number of diverse metazoans genomes has demonstrated that, in the midst of this overall conservation, taxon-specific differences among pathway components exist, for example, the TLR pathway. 23 Current knowledge of insulin signaling in model animals, with the wealth of genomic resources, offers the unique opportunity to answer whether there are subtle differences in the components that make up the IIF pathway. Therefore, this study is giving us the opportunity to unravel clues about the origin and the evolution of the IIF pathway by analyzing the genomes of different key metazoans species. Our specific goals are (1) to determine when IIF signaling pathway came into existence; (2) what is the selective forces operating on the different components and if evolutionary rate of the genes depend on their function or their position within the pathway; and (3) whether the IIF pathway genes exhibit evidence of positive selection.
Material and Method
Sequence data collection
If we are to get all members of a particular pathway for a given species, it is essential to have access to the genome sequence with good annotation. With this in mind, we have focused our analysis on the nuclear genomes of
A dataset of proteins with known involvement in the human IIF pathway was created according to the KEGG reference database (http://www.genome.jp/kegg/). Additional genes involved in IIF signaling were derived from searching relevant published literature. Consequently, we obtained a dataset of 27 genes with which to search the 19 metazoan species genomes. In order to test whether the evolutionary trend in the phylogeny was affected by taxonomic sampling used, we sorted the taxonomic samplings into 2 data sets: one for phylogenetically distant species (also called broad level species in this paper), including
Phylogenetic reconstruction
For each paralogous group/homologous group, we generated a multiple sequence alignment (MSA) of the amino acid sequences for each of our 2 data sets using the software Muscle with default settings.
27
This amino acid MSA was further used to guide the alignment of the CDS using PAL2NAL.
28
The resulting CDS alignments were manually improved using the software BioEdit 7.0.5.
29
Unreliably aligned regions were excluded from further analysis. Next, by analyzing the topology of the gene family trees separately, we confirmed the orthologous/paralogous relationships of the pathway components across each of our 2 data sets. DNA phylogenies for each gene family (representing a mixture of orthologous and paralogous genes) for the broad level species and mammals were constructed using MrBayes 3.1.2,
30
applying the nucleotide substitution model that best fit the data according to the Akaike information criterion (AIC). We used Modeltest version 3.7
31
to select the best-fitting substitution model. At least 200,000 generations were run in 4 independent chains by MrBayes 3.1.2.
30
A consensus tree was generated when the likelihood estimates had reached a stationary state (
Codon-based analysis
The degree of codon bias or codon preference is often used to reflect the level of selective constraint in a gene and the variation of synonymous substitution rates among genes, which may be related to codon usage. 32 To measure the extent of codon usage bias in each orthologous group (27 groups totally), we estimated the effective number of codons (ENC) using DnaSP version 5.10 m, 33 which varies between 20 and 61, where the lower the value, the more biased the codon usage. 34 Because GC content particularly at their third position is strongly correlated with codon bias, a graphical comparison of ENC versus GC content at the 3rd codon position (GC3) was used to detect the possible bias. A scatter-plot of observed values of ENC versus GC3 was drawn, along with a curve describing the expected values using the Nc-plot technique. 34
Tests for the impact of natural selection were carried out by estimating non-synonymous (dN) and synonymous (dS) divergence, and their ratio (ω = dN/dS) calculated by the codeml program from the PAML 4.4 package.
35
We restricted this analysis to 2 data sets: one is composed of the 8 species (
The one ratio model (M0) which assumes that all branches and all sites underwent the same selective constraint, was first used to test the selective forces acting upon each orthologous gene group in this analysis. We also applied the free ratio model (Mf) which assumes individual ratios on each branch of the orthologous gene group. Using the free ratio model, saturation effects were avoided by discarding dS values that were less than 0.007 or more than 2.00, as values for which S*dS were less than 10. To determine whether some codon positions had evolved under positive selection in each orthologous group, we compared the M1a and M2a models 36 and also the M7 and M8 models 37 using the likelihood ratio test. 38 Positive selection is invoked if the LRT is significant and the sites with ω > 1. 39
Statistical analysis
We performed a multivariate analysis considering dN, ω, the pathway position, and some parameters influencing evolution selection levels (codon bias, protein length, analyzed codons and GC content21,40). All statistical analyses were performed by statistical package R (http://www.rproject.org). First, we evaluated whether these parameters were correlated using Kendall's rank correlation coefficient (τ). Then, we analyzed the data using path analysis, an extension of multiple regression analysis that all variables are defined as random and new terminology is used. The first distinction made among variables in the model is between observed and unobserved random variables. Observed variables are called manifest variables and are directly observed. Before performing path analysis, the data were log-transformed and standardized to improve normality. All statistics related to path analysis was calculated by the sem package in R.
Results
Identification of IIF pathway genes in the investigated species
Aiming to identify all elements of the IIF signaling pathway in the investigated species, we initially gathered protein sequences for the selected species by using sequences of human, mouse and zebrafish as queries. Some sequences were readily available in GenBank, UCSC and ENSEMBL, and the others were from genomic alignments. We finally identified a total of 271 putative orthologs of the 27 IIF signaling pathway genes in genomes of 12 broad level species (Additional file 1); as well as 285 putative orthologs from 11 mammals (Additional file 2). Since current genomic projects include many unsequenced regions, this should be considered as the minimum number of actual genes.
No insulin and IGF1 homologs proteins were found to be encoded for in the genomes of
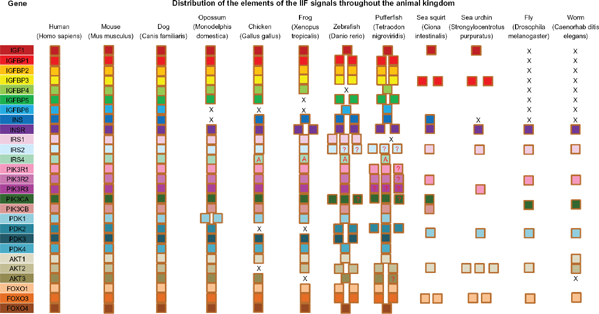
Survey of the components of IIF pathway in selected metazoans.
Phylogenies of the broad level species and mammals were presented in Additional file 3. Our 2 data sets provided slightly different topologies, especially when the major clades are considered. Taking advantage of the phylogenetic trees constructed using Bayesian methods, we readily obtained orthologous/paralogous relationships of the different pathway genes for 12 broad level species as well as 11 mammals. According to the criterion described in the material and method, orthologous members were separated from each gene family and were used for species tree construction and evolutionary rates analysis. We found that the genomes of vertebrates, beginning with

The phylogenetic tree showing the evolutionary relationships of the 8 higher species studied.
Codon usage bias and its correlation with GC3
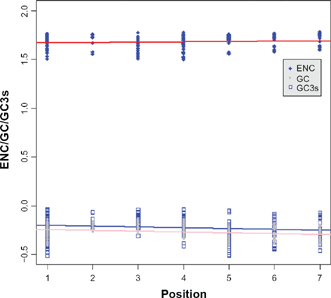
ENC is a measure of the degree of codon bias, ranging from 20, where codon bias is at a maximum and only 1 codon is used for each amino acid, to 61, where there is no codon bias and all codons are used. We first tested whether the ENC values and the GC contents for the total and 3rd codon position were influenced by gene positions in the broad level species and mammalian datasets. Codon bias showed a significant correlation with the positions of the elements (Kendall's τ = 0.145,
Correlations between different factors (codon bias, GC content for total and 3rd position) and the element position in the IIF pathway.

Graph of the ENC versus the percent GC at third codon positions.
Relationship of dN/ds to pathway position
The strength of natural selection acting on genes is inferred by ω, the ratio of dN/dS (non-synonymous substitutions (dN)/synonymous substitutions (dS)). By using the M0 model, a single dN/dS value for all lineages was estimated for each orthologous gene group in the IIF pathway. The results showed that dN/dS values were not uniformly distributed along the pathway, but varied greatly among genes, with ω values ranging from 0 to 0.21 for the broad level species (Table 1) and from 0.01 to 0.25 for mammalian species (Additional file 6), suggesting that purifying selection or selection constraint best explains the evolution of these genes. The free ratio model results demonstrated that the ω values for the IIF pathway genes varied substantially in each lineage, being estimated to be 0.0001~0.692 for the broad level species (Additional file 7) and 0.0001~0.773 for mammalian species (Additional file 8). In the further study the relationship between the ω values and the architecture of the IIF signaling pathway, we also performed other analysis. We first use boxplot graphical technique to display the distribution of selective constraints variables (dN, dS and dN/dS), which helps to see the difference of dN/dS and identify the outlying points (Fig. 6A). We found a significant negative correlation between ω estimates for IIF pathway genes and their positions in the pathway before removing the outlier (τ = −0.221;
Summary statistics used in this study.

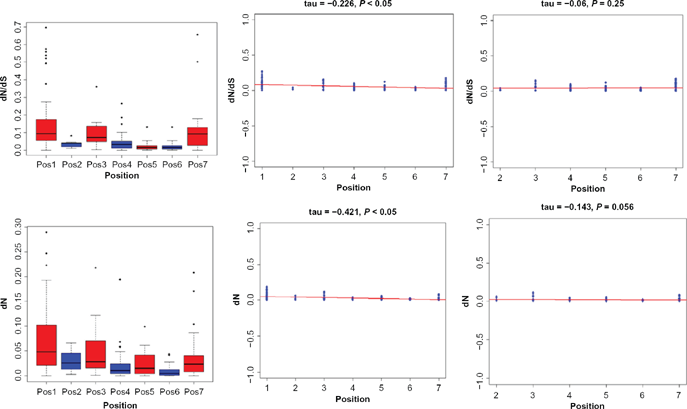
The distribution of selective constraint variables and correlation between the position of the elements in the IIF pathway and selective constraint estimates.
We wondered whether the correlation between ω and pathway position was a general trend in the phylogeny or whether it might only be attributable to some specific lineages. To test this, we adopted free-ratio model to estimate ω values along each linage for each orthologous gene group. ω correlated significantly with pathway position in

Correlation between the position of the elements in the IIF pathway and the dN/dS among different species. (A) for human, (B) for mouse and (C) for pufferfish and continuous lines represent regression lines.
As introducing in the part of introduction, the components of the IIF pathway can be divided into three distinct phases according to interaction mechanisms: sensors (position 2), transducers (position 3 to 6) and responses (position 7). We also performed relationship analysis among the different functional elements in the pathway using broad level species. The results showed that the dN/dS values of the transducers genes were significantly smaller than downstream responses (Fig. 8; Wilcoxon rank test;

Box plot of the functional module of IIF pathway.
The selective constraint of a given gene is known to correlate with different factors, such as the protein length and the number of analyzed codons.21,40 We further examined the correlations of dN/dS with a series of potential factors. By Kendall's rank correlation analyses, the ω (dN/dS) was shown to be marginally correlated with analyzed codons (τ = 0.284,
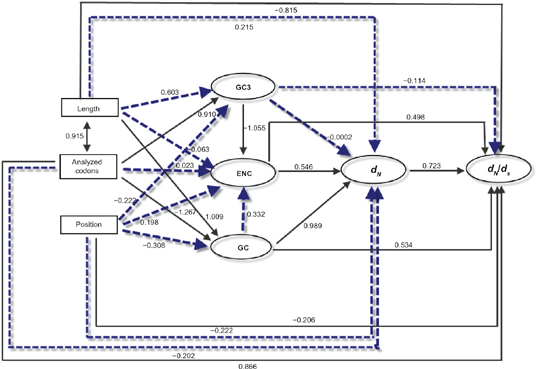
Graphical representation of the path analysis used to analyze the relationships among pathway positions, non-synonymous substitution (dN), dN/dS ratio, codon bias (measured by ENC), protein length, analyzed codons and GC content.
Tests for positive selection
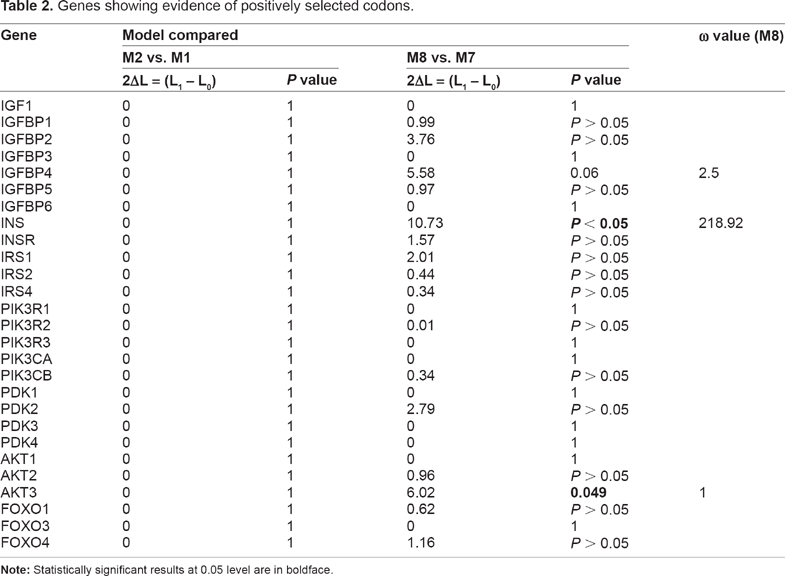
The results of the LRTs obtained from comparisons of M7 versus M8 and M1a versus M2a, which were conducted to examine positive selection in 27 gene orthologous groups in the broad level species, are shown in Table 2. LRTs for the comparison of M2a versus M1a were not statistically significant for any of the 27 genes. LRTs for the comparison of M8 versus M7, however, were significant for 2 of the 27 genes. IGFBP4 gene showed the footprint of positive selection, but LRTs were marginally significant (
Genes showing evidence of positively selected codons.
Discussion
Multicellular animals have their special mechanism to adapt to environmental changes. When environmental conditions are unfavorable to an organism's processes, such as growth and reproduction, different nutrient-sensing pathways will be activted in response to nutrition shuffling. Most of these pathways exert their function by modulating the activity of insulin-like signaling. The IIF pathway is an important branch of insulin signaling and plays key roles in growth, metabolism, stress resistance, reproduction, and longevity in diverse organisms including mammals. 7 Therefore, the evolution of IIF signaling transduction pathway was likely to be important to animals during evolutionary processes. The perception and transmission of signal of IIF pathway has been studied in detail in non-mammalian vertebrates and invertebrates since the 1970s.42–44 However, several key questions concerning the evolution of the IIF pathway remain unanswered. These include (1) which is the most distant animal species containing all the components necessary for IIF signaling?; and (2) whether the position of IIF component influences the evolutionary rate.
It has been reported that insulin-like peptides have been found in many invertebrate species including
Our study reveals a robust negative linear relationship between the value of dN/dS and the position of elements in the pathway at first. This result reaches the same conclusion for the analysis of insulin/TOR pathway in Drosophila and vertebrates.21,22 However, we are not sure this correlation is a true trend along the insulin pathway, or rather caused by more outliers or high variation of selective constraint (Fig. 6A; two positive selected genes though one is marginally significant) in position 1. We first removed all the outlier (including the positive selective genes) along the pathway, and we still obtained the same conclusion (Fig. 6B). Therefore the outliers were not the main factor leading to the gradient in the strength of negative selection along the pathway. Next, we removed all genes in position 1 and the correlation vanished (Fig. 6C). We also applied the similar strategy to dN, dS and lineage specific dN/dS variables, and we arrived at the coincident conclusion that the variation in selective constraint does not depend on the pathway structure here. Therefore, the presented correlation comes from the relaxed selective constraint operated on genes of position 1, which give us an erroneous perception of truth.
The organisms will open or close sets of genes in response to environmental stresses. During this process, organisms and/or individual cells are equipped with special control systems to respond and acclimate to stress. We further studied the relationship between functional module (sensors, transducers, and responses) related to special control systems and selective constraints. From Figure 8, we found that the dN/dS values from transducers were lower than that from responses and sensor module. This result seems contrary to previous demonstrations that there is no linear relationship between selective constraint and component position after removing components from position 1. In fact, the inconsistence comes from unbalanced selective constraint values among groups and different statistical methods. In this paper, most of the lineages have strong selective constraints, and several higher dN/dS were assigned to outliers when we combined the components from positions 3 to 6. In this case, the smaller dN/dS dominated the rectangle box, which make it smaller than that of the sensor and response module. While in previous linear analysis, the dN/dS values distribute evenly among positions, we obtained no significant linear relationship after removing components in position 1. Moreover, functional module analysis considered Wilcoxon rank correlation, while Kendall's rank analysis was used in positional analysis. This conclusion seems contrary to the pattern found in previous studies about other pathways. Rausher et al
18
have shown that the selective constraint levels in the plant anthocyanin biosynthetic pathway correlate with the position of the elements in the pathway. Namely, the upstream genes evolved substantially more slowly than the downstream genes. They thus hypothesized that the upstream genes in a metabolic pathway evolved more slowly than the downstream genes due to stronger purifying selection for the upstream genes. Such a pattern has also been confirmed at the intragenic
19
and population levels
56
in the genus
The selective constraints in molecular pathways were affected by diverse factors, such as connectivity,60,61 codon usage bias, and the length of the encoded proteins.21,40 Unfortunately, we could not obtain all higher animals' interactomic data, thus we are not able to conclude that connectivity pattern was responsible for the correlation between selective constraints and the position of the elements in the pathway. Most importantly, we detected (1) a positive correlation between the position of the elements in the pathway and codon bias (Fig. 4), and (2) a positive correlation between analyzed codons length and the position of the elements in the pathway. Furthermore, codon bias and analyzed codons length are all correlated with dN/dS and dN in Figure 9. However, path analysis did not confirm that the relationship between selective constraint and the position is significant after factoring out the effects of position 1 (Fig. 9). This phenomenon demonstrates that the relaxed selective constraint at position 1 explains the purifying selection polarity along the IIF pathway.
Conclusions
Genomic sequence data has provided an opportunity to gain a better understanding about the evolution of pathway genes. In this study, we investigated the differences in signaling transduction elements among different animals, the variation of selection constraint along IIF signaling pathway genes, and the relationship between evolutionary forces and gene position in the pathway. Our study demonstrates that the IGF1 and insulin recruited by the IIF pathway can date back to early stages in echinoderm evolution. In addition, our results also indicated that the negative correlation between dN/dS estimates and position was caused by higher dN/dS values at position 1. Also, the evolutionary rate variation of the IIF pathway are correlated with codon bias, protein length and other factors, suggesting that the selective patterns may be influenced by complicated factors. Overall, further work will be needed to study the patterns of molecular evolution in pathways encompassing a wide range of topologies and to analyze the biological impact of the interconnection patterns to fully understand how pathway architecture constrains the evolution of its components.
Author Contributions
Conceived and designed the experiments: Minghui Wang and Qishan Wang. Analyzed the data: Minghui Wang. Wrote the first draft of the manuscript: Minghui Wang. Agree with manuscript results and conclusions: Zhen Wang and Qiong ping Wang. Made critical revisions and approved final version: Xiangzhe Zhang and Yuchun Pan. All authors reviewed and approved of the final manuscript.
Funding
This work is supported by the National Natural Science Foundation of China (grant no. 31072003, 31000992, and 31272414), the National Key Technology R&D Program (grant no. 2008BADB2B11), National High Technology Research and Development Program of China (863) (grant no. 2008AA101002, 2008AA101009) and the National Key Basic Research Program (973) (grant no. 2006CB102102).
Competing Interests
Author(s) disclose no potential conflicts of interest.
Disclosures and Ethics
As a requirement of publication author(s) have provided to the publisher signed confirmation of compliance with legal and ethical obligations including but not limited to the following: authorship and contributorship, conflicts of interest, privacy and confidentiality and (where applicable) protection of human and animal research subjects. The authors have read and confirmed their agreement with the ICMJE authorship and conflict of interest criteria. The authors have also confirmed that this article is unique and not under consideration or published in any other publication, and that they have permission from rights holders to reproduce any copyrighted material. Any disclosures are made in this section. The external blind peer reviewers report no conflicts of interest.
Footnotes
Acknowledgements
The authors wish to express their gratitude to the members of animal sciences laboratory of Shanghai Jiao Tong University.
Additional File
Gene_information_new1.xls