
Abstract
Introduction:
DNA barcode, a molecular marker, is used to distinguish among the closely related species, and it can be applied across a broad range of taxa to understand ecology and evolution. MaturaseK gene (matK) and rubisco bisphosphate carboxylase/oxygenase form I gene (rbcL) of the chloroplast are highly conserved in a plant system, which are used as core barcode. This present endeavor entails the comprehensive examination of the under threat plant species based on success of discrimination on DNA barcode under selection pressure.
Result:
The family Dipterocarpaceae comprising of 15 genera is under threat due to some factors, namely, deforestation, habitat alteration, poor seed, pollen dispersal, etc. Species of this family was grouped into 6 clusters for matK and 5 clusters and 2 sub-clusters for rbcL in the phylogenetic tree by using neighbor-joining method. Cluster I to cluster VI of matK and cluster I to cluster V of rbcL genes were analyzed by various codon and substitution bias tools. Mutational pressure guided the codon bias which was favored by the avoidance of higher GC content and significant negative correlation between GC12 and GC3 (in sub-cluster I of cluster I [0.03 < P], cluster I [0.00001 < P], and cluster II [0.01 < P] of rbcL, and cluster IV [0.013 < P] of matK). After refining the results, it could be speculated that the lower null expectation values (R = 0.5 or <0.5) were less divergent from the evolutionary perspective. Apart from that, the higher null expectation values (R = >0.85) also showed the same result, which possibly could be due to the negative impact of very high and low transition rate than transversion.
Conclusion:
Through the analysis of inter-generic, inter/intra-specific variation and phylogenetic data, it was found that both selection and mutation played an important role in synonymous codon choice in these genes, but they acted inconsistently on the genes, both matK and rbcL. In vitro stable proteins of both matK and rbcL were selected through natural selection rather than mutational selection. matK gene had higher individual discrimination and barcode success compared with rbcL. These discriminatory approaches may describe the problem related to the extinction of plant species. Hence, it becomes very imperative to identify and detect the under threat plant species in advance.
Introduction
Phylogenetic analysis is the big deal in biology, because it provides basic information of background of an organism especially about the status and modes of their existence. The phylogenetic analysis of Dipterocarpaceae has yet not been extensively studied. A very few major phylogenetic analysis on this family has been reported based on DNA barcode, rbcL and matK gene; rbcL, trnH-psbA, and matK from Ketambe Research Station Quang Ninh (Vietnam) and Guangxi (China) in Hopea chinensis (Dipterocarpaceae), respectively. It was found that 2 of the individual DNA barcodes, matK and rbcL, performed best.1,2 DNA barcoding has been successfully initiated in animals by using mitochondrial gene, cytochrome oxidase 1 (CO1), having more than 95% accuracy level of species identification of major animal clade. 3 But it is found challenging to identify a standard barcode system in the plants, because of low mutation rate in CO1 and rapid structural changes of mitochodrial genome.4–6 In plant systematic research, both matK and rbcL genes from the chloroplast genome (cpDNA) appear to be a valuable gene by providing a high phylogenetic signal and a fairly conservative level of evolution, respectively.7,8 The genes matK and rbcL encode the maturase enzyme subunit K and a large subunit of ribulose 1,5-bisphosphate carboxylase (Rubisco), respectively. The plant-working group, Consortium for the Barcode of Life (CBOL), recognizes 2-plastid barcoding region rbcL + matK called as core barcode and an additional marker as required. 9 matK is one of the most rapidly evolving coding regions of the plastid genome having high species discrimination power, and it seems to be closely analogous to the animal barcode. 10 No other 2-markers or multi-markers combination of plastid barcode (rpoC1 + rpoB + matK or rpoC1 +matK + trnH-psbA 11 ; rbcL + trnH-psbA 12 ) and (atpF-H + psbK-I 13 ) except 2-plastid markers (rbcL + matK) provide appreciably better species resolution. Coding nature of both these (rbcL + matK) regions is not only useful for automatic checking of editing/assembly error and ascertaining of the existence of pseudogenes and proper sequence alignment, but it also facilitates the analysis pertaining to the comparative diversity among the taxa and evolutionary divergence based on substitution bias. Apart from matK and rbcL genes, there are other different barcodes (subunit of plant RNA polymerase [rpoA, rpoB, rpoC1, rpoC2], intergenic spacer region [trnH-psbA], ATP synthase subunit gene’s spacer [atpF-H]) available for phylogenetic analysis.
The parameter for plant barcodes success
First, geographical constraints generally make a high level of distinctive species discrimination.14,15 In contrast, the species diversity decreases as one moves toward dense populations which lead to shared barcodes among the coexisting species.16,17 Second, sufficient time is required for speciation driven by mutation or drift to form a set of genetic constituent which isolates conspecific individual together and separate them from other species. Barcode sequence represents the deficiency of proper species discrimination, due to slow rate mutation (Araucaria), woody species with long-generation time, and also individuals radiated recently and rapidly in Inga. 17 Third, polyploid speciation shows inconsistency between barcode sequences and taxon concept 18 where hybridization and/or polyploids are frequent. Both multiple allopolyploids and independent origin allopolyploid species having an identical plastid sequence share a common ancestor. According to the evolutionary clock, autopolyploid species does not share their plastid haplotype with diploid progenitor over evolutionary timescales unlike the initial stage of their origin. Finally, those with limited seed dispersal are predicted to have less DNA barcode discrimination success and it takes more time to reach monophyly in barcode regions, which is a natural occurrence than the connected populations having regular gene flows. 19
In the study of molecular evolution of individual genes, it is important to know the synonymous codon usages. Synonymous codon usages are not randomly used20,21 which have been influenced by factors such as CpG islands, 22 gene length, 23 gene expression, 24 protein secondary structure, 25 gene density,26,27 and so on. Two important models, ie, both mutational bias and natural selection, determine independently the codon usages variations. It is necessary to consider more codon usage patterns because no such unified theory for codon usages has been established. The chloroplast genome is found to be the most effective in the study of plant molecular evolution due to its small size, simple structure, and high copy number, which is closely similar to a bacterial genome. Recently, many more chloroplast genomes have been sequenced with the help of advanced DNA sequencing techniques (http://www.ncbi.nlm.nih.gov/genomes/GenomesGroup.cgi?taxid=2759&opt=Plastid#pageTop). The codon usage pattern of chloroplast genes (like matK, rbcL) shows very close similarity to those in Escherichia coli. 28 It has been reported that the codon bias in the chloroplast genome of Euglena gracilis is found to be determined by 2 asymmetric DNA strands. 29 The choice of codon usage in the chloroplast genome of grass species is influenced by context dependent mutation, 30 but in some cases, it is found that selection may influence the codon usage pattern of certain chloroplast genes. 31
Transition rather than transversion, which is favored by natural selection, causes the biochemical advantage.32-34 The introductions of new alleles through the transition are several folds higher than that of transversion, and therefore, nucleotide transition is common in molecular evolution. 35 This pattern of amino acid replacement often supports the effect of selection on the ground that the transition is more conserved in their effect on protein supported by reviewing more than 8 published reports. 36 The selective hypothesis has proposed that conservative effect on biochemical factors by transition mutation over transversion is correlated to the pattern of evolutionary divergence. 37 One obvious question is that the changes fixed in the evolution of an organism are favored toward survival effect because natural selection encourages positive adaptive changes whether it happens through transitions or transversion. Every nucleotide side (eg, G) may experience one type of transition (G to A) at a rate X and 2 types of transversion (G to C, G to T) at rate Y. The aggregate rate ratio of transition to transversion has a null expectation of R = X/2Y = 0.5 = 50% (>R indicates that it is being fit or divergent in accordance with value and <R shows opposite results to earlier) leading to transition bias relative to a null model of equal rates. This study emphasizes on 2 major objectives. The primary objective is to analyze codon bias of matK and rbcL genes among the individuals of this family and second one is to find out evolution-based phylogenetic tree.
Materials and Methods
Data collection
The family Dipterocarpaceae comprises of 15 genera (www.theplantlist.org/1.1/browse/A/Dipterocarpaceae/). The entire coding region of matK, rbcL gene sequences, and available amino acid sequences (matK and rbcL) of this family were retrieved from the taxonomy database of National Centre for Biotechnology Information (www.ncbi.nlm.nih.gov/nuccore/?term=Dipterocarpaceae) (dated 12 December, 2017). In all, 76 matK and 33 rbcL gene sequences belonging to 28 and 16 species, respectively, were down loaded from GenBank and documented in the supplementary table, ie, Supplemental Tables S1 and S2, respectively.
Indicator of codon usage
Codon usage pattern in the core barcode region was analyzed by using codon W 1.4.2. Relative synonymous codon usage (RSCU) is the ratio of the observed frequency of synonymous codons for a particular amino acid to the expected frequency. 38 Thus, RSCU values close to 1 indicate the lack of bias for codon usage where as the value >1 or <1 means preference and avoidance of that particular codon. The effective number of codon (ENC) is used to show the extent of codon bias of a gene and to quantify the absolute codon usage bias of a coding sequence. 39 The values of ENC always remain in-between 20 (a gene with extreme codon bias uses only one codon per amino acid) and 61 (a gene with no codon bias uses all the synonymous codon). 40 In general, 35 or less and 50 or higher ENC values of a gene are considered to have a strong and low codon bias, respectively. 41 The expected ENC values from GC3s under no selection in accordance with null hypothesis have been calculated according to equation (1), where S = GC3s.

The relationship between nucleotide content and codon usage by NC-plot is investigated to reveal the relationship among them. Wright 39 has suggested that NC-plot (ENC plotted against GC3s) is used to explain the pattern of synonymous codon usage. The codon choices of a gene influenced by a (G + C) mutation constrain usually lie on or just below the curve of the predicted value. 39 Codon adaptation index (CAI), a measurement of the expression of the gene, is used to estimate the extent of bias toward codon and its values range between 0 to 1.0, where in the CAI, a higher value means a stronger codon usage and a higher expression level. 42
Correspondence analysis by using codon W 1.4.2
Correspondence analysis (COA) is an ordination technique that identifies the major trends in the variation of the data where genes with their degree of variation are arranged along the continuous axes. It represents continuous variation accurately. The first axis captures most of the variation of genes and each of the subsequent axes shows a diminishing variation.
Chemical properties
The physiochemical properties like molecular weight (MW), theoretical isoelectric point (PI), percentage of positive and negative charged amino acid instability index, grand average of hydropathicity (GRAVY), etc were determined by using ProtParam (http://web.expasy.org/protparam/) (Supplemental Tables S3 and S4). The instability index provides an estimation of stability of a protein in vitro.
Sequence analysis
Gene sequences (matK and rbcL) were retrieved from the GenBank, which made a dataset of all the plant species of the family Dipterocarpaceae to find out the interspecific variation. Another dataset comparing the various genus of the family Dipterocarpaceae like Anisoptera, Dipterocarpus, Shorea, Hopea, Parashorea, etc was made to find out intergeneric variation.
Phylogenetic analysis
The nucleotide frequency and transition/transversion bias was computed by Molecular Evolutionary Genetics Analysis (MEGA 7.0). 43 DVADIST program from PHYLIP was used to analyze the distance between the clades. The phylogenetic data were validated by re-sampling sequence data using bootstrap, performed by NJ-plot in Phylogeny Inference Package (PHYLIP). 44 Clustering of individuals was made on the basis of their position on the phylogenetic tree (clusters I, II, III, IV, V, and VI for matK and clusters I, II, III, IV, and V and sub-clusters I and II of cluster I for rbcL). Few clades were found in each cluster and their numbering was given accordingly from top to bottom.
Results
Advancement of molecular biology and DNA sequencing of the genome of various organisms rapidly provide valuable information regarding their genetic makeup and function. In this study, changes in the nucleotide sequence of matK and rbcL genes of Dipterocarpaceae were analyzed to know the inter-generic, inter-specific, and intra-specific variation.
Phylogenetic analysis
Monophyly individuals of all the clusters showed poor barcode (matK) success (Figure 1) which may be caused by slow mutation, poor seed dispersal, woody plant with long-generation time and polyploidy (Hopea hainanensis and Shorea robusta), etc. Therefore, long time was taken to reach monophyly. Individuals of clade 1 of clusters II, III, and VI and clade 5 of cluster IV (Figure 1) may radiate recently due to slow mutation rate and dense population. Genetic drift may lead to conspecific individuals together from other as indicated by their branch length value in the clade 1 of cluster I and clade 2 of both the clusters II and IV. Either rapid mutation or geographical constrains in clade 2 of clusters I and III, in clade 1 of cluster V, and in clades 1 and 4 of cluster IV possibly lead to speciation causing high barcode success in their barcode region (matK). Figure 2 shows that most individuals of all the clusters except few clades and monophyly groups had lack of proper divergence of rbcL gene to differentiate them as indicated by branch length. Dipterocarpus intricatus is the most diversified in their barcode region. Most of the individual of clusters I, II, IV, and VI of matK, and sub-clusters I and II and clusters IV and V of rbcL were less evolutionary divergent and may lead to extinction.

Evolutionary relationship of taxa based on matK.
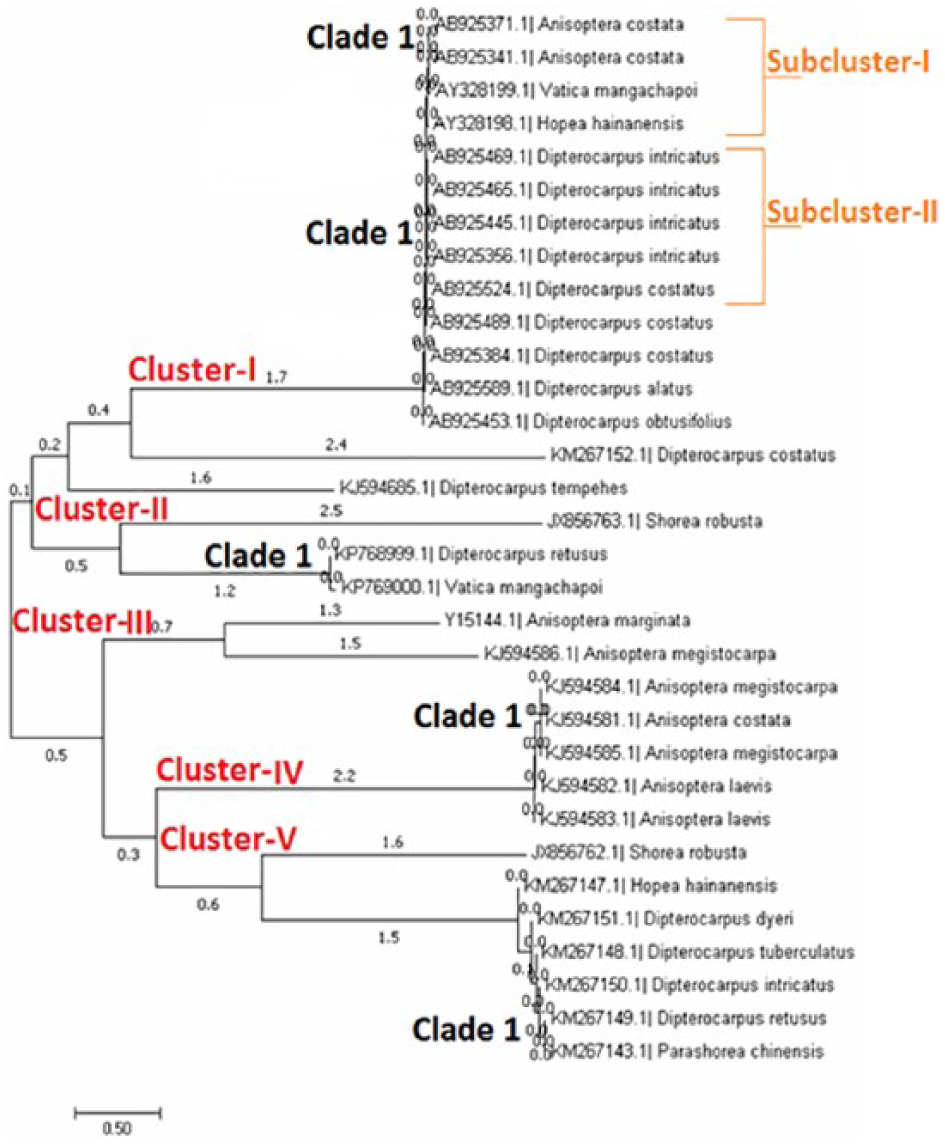
Evolutionary relationship of taxa based on rbcL.
Codon usage
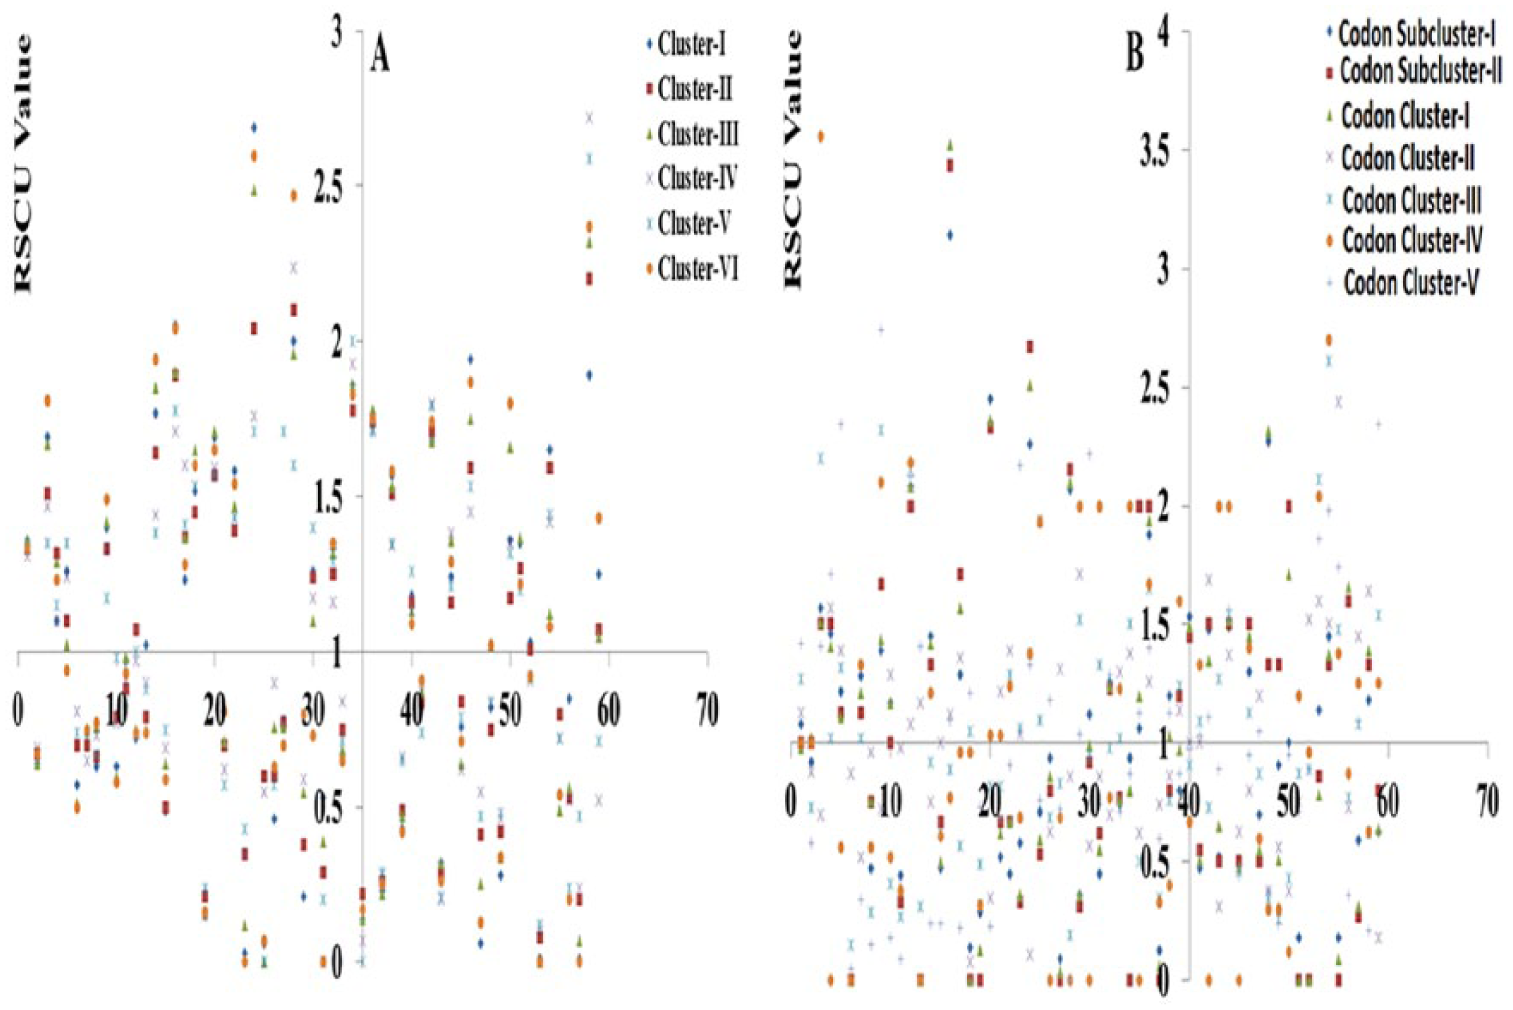
Average GC content among all the clusters ranged from 32.80% to 34.4% for matK and 42.2% to 44.6% for rbcL gene sequences (Table 1). So both these matK and rbcL genes were (A + T) rich, and overall codon usage was biased toward A- and U-ending codons (both Figure 3A and B) except clusters II (G- and C-ending bias) and IV of rbcL (where AU- and GC-ending codons occur at equal proportion) (Figure 3B), suggesting compositional constraints are important factors in shaping the codon usage variation in these genes.
GC content in the all the clusters of matK and rbcL.


Percentage of frequently synonymous codon usage among the clusters: (A) matK and (B) rbcL.
Synonymous codon usage pattern
Almost all the clusters of matK (Figure 4A) showed similar kind of codon usage pattern in most frequently used codon. But clusters III and VI used very similar types of codon to encode same series of amino acids, and RSCU values of these codons were almost same. On the contrary, codon usage pattern among the clusters of rbcL (Figure 4B) was not uniform, but sub-clusters I and II and cluster I showed a similar fashion of codon usage pattern and had almost similar RSCU values. In broad sense, Figure 4A showed that matK gene in all the individuals of this family underwent the same degree of selection pressures unlike rbcL gene. But in strict sense, individuals within clusters III and IV of matK (Figure 4A) and sub-clusters I and II and cluster I of rbcL (Figure 4B) were reviewed under the same scale of selection pressures.
Codon usage pattern among the group members of this family based on RSCU value: (A) matK and (B) rbcL. RSCU: relative synonymous codon usage.
Nucleotide content in 3 codon positions of gene
The GC content in 3 codon positions (GC1, GC2, and GC3) of matK gene among all the clusters was 35.5% to 39.7% (mean: 37.93%, standard deviation: 1.59%), 29.2% to 49.8% (mean: 35.33%, standard deviation: 7.82%), 30.5% to 34.9% (mean: 32.71%, standard deviation; 1.96%), respectively, and for rbcL, GC1 was 28.6% to 55.5% (mean: 40.95%, standard deviation: 12.90%), GC2 was 37.9% to 61.1% (mean: 48.75%, standard deviation: 8.86%), and GC3 was 28.9% to 55.3% (mean: 39.4%, standard deviation: 9.6%). Figure 5B showed nearly close GC1, GC2, and GC3 values among the sub-cluster I, sub-cluster II, and cluster I.

GC1, GC2, and GC3 among all the clusters: (A) matK and (B) rbcL.
According to neutrality analysis, it is found that mutational pressure presumably influences the codon bias if the correlation between GC12 and GC3 is statistically significant and the slope of the regression line is close to 1. Conversely, a narrow distribution of GC content and the nonsignificant correlation between GC12 and GC3 are caused by selection.45,46 In vitro stable protein encoding individuals within each cluster of both matK and rbcL (in vitro stable protein-encoded individuals [IN-VSPEI]) (Supplemental Tables S3 and S4) were considered to calculate GC (GC12 and GC3), but all individuals (in vitro stable and unstable protein encoding individuals) in the clusters were included for average GC calculation. Neutrality plot analysis (GC12 vs GC3) was performed in all the clusters (both matK and rbcL genes) to analyze relationships among the 3 codon positions. It was found that both matK and rbcL genes had a narrow range of GC content as mentioned earlier and all the clusters of matK gene showed no significant correlation between GC12 and GC3 except cluster IV (Table 2), suggesting that selection played a most prominent role in codon usage bias. In case of rbcL, there was significant correlation among the clusters and the individuals within the each cluster except the clusters IV, V, and sub-cluster II (where r value calculation is not possible because GC12 [48.3%] and GC3 [29.9%] are same among the individuals) and V (having 2 individuals hindering from significant correlation test) (Table 2), showing that mutations rather selection are playing major role in shaping codon usage bias.
Correlation coefficient (r), P value, and regression square of matK and rbcL, respectively.

NA, not applicable, because sample size is 2 which is invalid for correlation.
Relation between ENC and GC3s
ENC and GC3s values for matK calculated in the same way of the previous point 3.4 (GC content—GC12 and GC3) varied from 47.47% to 57.67% (mean: 51.10%, standard deviation: 2.57%) and 0.280% to 0.333% (mean: 2.57%, standard deviation: 0.022%), respectively. For rbcL, it was from 45.62% to 61% (mean: 49.23%; standard deviation: 3.2%) and 0.282% to 0.553% (mean: 0.375%, standard deviation: 0.102%), respectively. Wright has proposed that codon usage variation among the genes can effectively be analyzed by a plot of ENC vs GC3s 47 where GC3s entirely operate codon usage bias if the value of ENC remains close/fall on the expected curve between GC3s and ENC plot. Figure 6A showed that almost all the points of observed ENC value were either below or above the standard ENC value, suggesting their independence of GC3s except few points (few IN-VSPEI) of cluster IV which was dependent on GC3s, ie, G + C mutational bias (Figure 6B). Observed ENC values of all the individuals of sub-clusters I and II and cluster I were close to standard ENC value toward GC poor regions which were certainly originated from compositional constraints, and rest of the points are below their standard ENC value.

ENC vs GC3s (the portions where observed ENC value occur on the standard curve): (A) matK and (B) rbcL gene of this family. ENC, effective number of codon.
Mutational bias analysis
In the case of mutational bias, generally, GC or AT is used proportionally among the degenerate codon groups in a gene. On the contrary, GC or AT is not proportionally used for codon choice by natural selection. 48 The relationship among G, C, A, and T content in 4 degenerated codon families are analyzed to know whether these codon bias choices are restricted to the high bias genes or not (Figure 7A and B). Figure 7A showed codon bias for matK was mostly determined by a factor-like selection except in a specific few cases where mutation causes codon bias (eg, few individuals of cluster IV). Codon bias choice in sub-cluster II and cluster I of rbcL (Figure 7B) is very similar, which was controlled by mutation.

Comparative ratio of A3/A3 + T3 and G3/G3 + C3: (A) matK and (B) rbcL.
Chemical properties
Physiochemical properties of completely sequenced matK and rbcL proteins of this family were revealed by using the software ProtParam (Supplemental Tables S3 and S4, respectively). Aliphatic side chains of alanine, valine, isoleucine, and leucine of a protein may be regarded as a positive factor to increase the thermostability for the globular proteins. The aliphatic index for matK and rbcL proteins of this family ranged from 92.45% to 106.45% and 79.63% to 85.98%, respectively. Theoretically, the protein having instability index <40 is considered as stable. Thirty-three and 18 individual proteins of matK and rbcL, respectively, were found to be in vitro stable.
Correspondence analysis
In this study, we investigated on the synonymous codon usage variation among the clusters and the individuals of each cluster of matK and rbcL genes of this family (considering all the individuals and the stable protein encoding individuals as mentioned in earlier point 3.4). First 2 axes explain major variation which is gradually decreased in the successive axes. Ordinations of genes on the first 4 axes are examined for correlations with indices of codon usage (CAI, ENC, Fop [frequency of optimal codons], GC, and GC3s). In vitro stable protein-encoded individuals of clusters IV and V of matK showed more or less same gene expression where genes with higher expression level had a greater degree of codon bias, but the cluster IV had a tendency of GC compositional constraints at synonymous codon position (Figure 8). It was found that there was a significantly positive correlation between axis 1 and Fop in most clusters. This result suggested that selection was one of the major factors influencing the synonymous codon bias of the matK gene among the individuals of this family. Highly expressed rbcL genes of IN-VSPEI (sub-cluster I) are significantly correlated with GC and GC3s (Table 3).

Schematic representation of correlation axis 1 vs CAI or ENC or Fop or GC or GC3s for each cluster of matK accordingly on the graph (1-5 points) and the distribution of IN-VSPEI of each cluster of matK is also presented on this graph having 1.1 to 5.1 points, where negative (−) and positive (+) sign denotes negative and positive correlation, respectively, with axis 1. CAI, codon adaptation index; ENC, effective number of codon; Fop, frequency of optimal codons; IN-VSPEI, in-vitro stable protein-encoded individual.
Correlation (R) of axis 1 with ENC, CAI, Fop, GC content, and GC content at synonymous codon position of matK and rbcL, respectively.

Abbreviations: CAI, codon adaptation index; ENC, effective number of codon; Fop, frequency of optimal codon; IN-VSPEI, in-vitro stable protein-encoded individual; NS, non-significant correlation.
NA, not applicable, because sample size is not more than 2. Not identified means codonW could not produce data of 4 axis. * and ** means significant at 0.01 and 0.05 probability levels, respectively.
Sequence analysis
Substitution bias (transition/transversion) ratio at codon position for each cluster revealed evolutionary trend in accordance with their values. The inference was made for both the genes on the basis of overall substitution bias value on their entire codon position (1st + 2nd + 3rd nucleotide). According to selective hypothesis on substitution bias (at 1st + 2nd + 3rd position), clusters I, II, and V of matK, and sub-cluster II and clusters I and IV of rbcL (Table 4) exhibited evolutionary less divergence due to its low null expectation value (<R), whereas cluster VI of matK, and sub-cluster I, cluster II, and cluster V of rbcL having high null expectation value (R = >0.85) represented less evolutionary divergence, which was depicted in the phylogenetic tree (Figures 1 and 2).
Substitution bias at codon position of matK.

NA, not applicable, because more than 2 samples are required to calculate substitution bias in MEGA 7.0.
Discussion and Conclusion
Codon usage bias is a complex and important issue regarding evolution in both prokaryotes and eukaryotes. There are some hypotheses that have been proposed to explain the origin of codon usage bias. Neutral theory 49 and the selection-mutation-drift balance model38,50 are one of the best representatives among them (hypothesis of the origin of codon usage bias). According to the neutral theory, random synonymous codon choices are the results of mutation at degenerate coding positions. The selective-mutation-drift model explains that the codon bias is supposed to be determined by the stability among mutational pressures, genetic drift, and selection. However, with the advancement of genome projects in the recent years, these 2 hypotheses are not sufficient for the explanation of codon usage bias. Several parameters like gene length, 23 GC content,51,52 recombination rate,51,53,54 gene expression level,23,53,55 RNA structure,24,56,57 protein structure, 58 intron length, 59 population size, 60 evolutionary age of genes, 61 environmental stress, 62 hydrophobicity and aromaticity of encoded proteins,63,64 and so on may influence the codon usage bias. In this study, gene expression level and gene compositional constraint have been given primary focus. In vitro stable protein of both matK and rbcL genes of the family Dipterocarpaceae selected through natural selection had higher barcode success than mutational selection. Thus, from this study, it could be suggested that mutation and selection are operated randomly on the genes—both rbcL and matK.
GC rich organisms such as bacteria, archea, fungi, Triticum aestivum, Hordeum vulgare, and Oryza sativa46,65 tend to use G or C in their third position. Meanwhile, AT rich organisms like Onchocerca volvulus, Mycoplasma capricolum, Plasmodium falciparum, etc66,67 show A or T preference in the third position. The core barcode genes of this family (Dipterocarpaceae) showed AT richness and the overall codon usage was biased toward A- and U-ending codon except individuals of cluster II of rbcL gene. By combining analyses of both selective hypothesis on substitution bias (Table 4) and phylogenetic tree (Figures 1 and 2), it was reflected that generally null expectation, ie, R values greater than 0.85 and 0.5 or <0.5, showed less evolutionary divergence because very high and very low transition may negatively affect the fitness of organism.
Phylogenetic analysis helped to identify the variations, patterns, transition/transversion bias, and codon bias in nucleotide sequence. Genome-based phylogeny is found to be effective in this concern, and it has been practiced in bacterial system (due to smaller genome size). In angiosperm, whole genome phylogeny is being challenged, because of very hard processing of so large massive information unlike bacterial genome. However, it is quite obvious to looking at DNA barcode. A software, MEGA, provided information about inter- and intra-specific relationship of the family Dipterocarpaceae. Phylogenetic tree analysis showed that cluster IV of matK and cluster I of rbcL had longer branch length making the evolutionary sense between the species of this family. matK is a good candidate for DNA barcoding among the members of this family because of their high discrimination success than rbcL and showed a predictable range of mutational events, ie, nucleotide substitution (Supplemental Table S5), whereas rbcL involved additions and deletions. It was also found that the genetic diversity was affected by habitat alteration creating a situation like fragmented population, limited seed dispersal, etc.
Supplemental Material
Supplemental_tables – Supplemental material for In Silico Analyses of Burial Codon Bias Among the Species of Dipterocarpaceae Through Molecular and Phylogenetic Data
Supplemental material, Supplemental_tables for In Silico Analyses of Burial Codon Bias Among the Species of Dipterocarpaceae Through Molecular and Phylogenetic Data by Raju Biswas, Anindya Sundar Panja and Rajib Bandopadhyay in Evolutionary Bioinformatics
Footnotes
Acknowledgements
Raju Biswas is thankful to CSIR for Junior Research Fellowship (File No: 09/025(0216)/2015-EMR-I). Authors are thankful to UGC-Center of Advanced Study and DST-FIST at Department of Botany, The University of Burdwan for pursuing research activities.
Funding:
The author(s) received no financial support for the research, authorship, and/or publication of this article.
Declaration of conflicting interests:
The author(s) declared no potential conflicts of interest with respect to the research, authorship, and/or publication of this article.
Author Contributions
Both RB designed the work. RB conducted the work. Both RB and ASP analysed the data. RB and ASP wrote the paper. RB checked the paper. All authors finalized and submitted the paper.
Supplemental Material
Supplemental material for this article is available online.
References
Supplementary Material
Please find the following supplemental material available below.
For Open Access articles published under a Creative Commons License, all supplemental material carries the same license as the article it is associated with.
For non-Open Access articles published, all supplemental material carries a non-exclusive license, and permission requests for re-use of supplemental material or any part of supplemental material shall be sent directly to the copyright owner as specified in the copyright notice associated with the article.