
Abstract
The rapidly expanding data sets derived from genomic and transcriptomic analyses have allowed greater understanding of structural and functional network patterns within the genome resulting in a realignment of thinking within a systems biologic framework of cancer. However, insofar as spatially and temporally dynamic differential gene expression at the protein level is the mediate effector of cellular behavior and, in view of extensive post translational modification (PTM), the need for sensitive, quantitative, and high throughput proteomic analytic techniques has emerged. To circumvent the problems of tissue sample heterogeneity, laser capture microdissection (LCM) allows for the acquisition of homogeneous cell populations. Using different fluorescent dyes to label protein samples prior to gel electrophoresis, 2-D DIGE (two-dimensional differential in-gel electrophoresis) can, with reasonable sensitivity, process three protein samples on the same gel allowing for intragel relative quantification. MudPIT (multidimensional protein identification technology) is a non-gel approach exploiting the unique physical properties of charge and hydrophobicity which allows the separation of peptide mixtures as well as direct MS (mass spectrometry) and database searching. The introduction of iTRAQ (isobaric tags for relative and absolute quantification) achieves labeling of all peptides by employing an 8-plex set of amine reactive tags to derivatize peptides at the N-terminus and lysine side chains allowing for absolute quantification and assessment of PTM. These and other new laboratory technologies, along with improved bioinformatics tools, have started to make significant contributions in cancer diagnostics and treatments.
Introduction
For 70 years the oncology community has been exploring therapeutic opportunities involving cytotoxic based therapy for cancer control. Unfortunately, principles derived from the application of cytotoxic based therapies now provide diminishing return with respect to patient benefit. Recent developments in genetics, molecular biology, and molecular pharmacology promise to dramatically alter strategies of cancer management. Our ability to differentially characterize the neoplastic process in malignant cells on the bases of receptor overexpression, signaling process modulation, and genetic and epigenetic aberrations is now enabling us to realistically entertain the concept of specifically matching the “right patient with the right therapeutic”. Molecular characterization of relatively sensitive and differentially specific cancer structural and process components has resulted in a new wave of “targeted” therapies.
In a scale-free, hierarchical, modular system such as cancer, redundancy enables most neoplastic cells to bypass or buffer the effect of any single gene/target modification, thereby minimizing targeted therapeutic effectiveness and the capacity for long term durable response (Carlson and Doyle, 2002; Ciliberti et al. 2007). However, systems biology analysis suggests that coordinated and integrated targeted (rather than 'random’) network disruptions can expose an “attack vulnerability” (Carlson and Doyle, 2002; Hartwell et al. 1997). As such, the disordered system circuitry can become, almost paradoxically, more highly dependent on a specific rewired pathway (i.e. pathway addiction). In other words, the disruption of pathways that produce robustness to certain insults are often associated with enhanced fragility to other perturbations thereby exposing an “Achilles’ heel” of cancer. In such an approach, the most intriguing targets derived from a patient's differential genomic-proteomic profile, which we are studying, would involve highly interconnected “hub” genes which control cancer cell competitive survival, metastagenicity and/or cancer stem-cell renewal (Albert et al. 2000; Jeong et al. 2001). We and others have previously demonstrated that semi-quantitative proteomic (Feldman et al. 2004; Nemunaitis et al. 2007; Petricoin et al. 2004; Zhou et al. 2002) profiling derived by comparing malignant and non-malignant tissue from patients with progressive cancer can be analyzed in the context of global protein interaction networks in order to generate a prioritized list of potential protein and gene targets.
Compared to cDNA microarray studies, analysis of differential gene expression at the protein level presents unique advantages as proteins are the mediate, if not direct, effectors of cellular behavior. Furthermore, the products of post-translational modifications and differential RNA splicing, as well as samples with limited nucleic acids (e.g. serum) are most effectively analyzed using proteomics approaches. Thus far, proteomics analyses have been used to probe the cellular and molecular mechanisms of transformation (Young et al. 2005), search for determination of potential tumor biomarkers (Zhou et al. 2002), screen and allow early detection of cancer (Feldman et al. 2004; Petricoin et al. 2004), prognosticate, predict response and support therapeutic management of cancer (Nagata et al. 2004; Volpi et al. 2003). It is hoped that one day the knowledge of proteomic signals within individual cancer specimens prior to treatment will provide a more optimal match between the patient and a molecular based targeted therapy opportunity, thereby enhancing clinical response predictability for the clinical treatment team and the patient.
Proteomics Technologies
While many proteomics strategies have been designed and tested, only a handful have been widely used. These technologies along with their advantages and disadvantages are discussed below.
Polyacrylamide gel electrophoresis (PAGE)
Polyacrylamide gel electrophoresis (PAGE) is one of the most widely used techniques for separation of complex protein mixtures (Somiari et al. 2005). Upon completion of PAGE, the proteins of interest are excised from the gel and their identities are determined by mass spectrometry. There are mainly two versions of PAGE: one-dimensional gel electrophoresis (1-D PAGE or SDS-PAGE) and two-dimensional gel electrophoresis (2-D PAGE).
In 1-D PAGE, the protein samples are dissolved in a loading buffer that usually contains a reducing agent (for example, dithiothreitol) and a denaturing agent [for example, sodium dodecyl sulphate (SDS)]. Separation is primarily based on the molecular weight of the proteins in the samples. After electrophoresis, proteins are visualized either by using antibody-detection techniques or by staining the gel with Coomassie brilliant blue dye, silver stain or a fluorescent dye. The degree of protein separation (resolution) is rather low. A single protein band may contain several hundred proteins. Thus, 1-D PAGE is of little utility in proteomic analysis of complex protein samples.
For many years, 2-D PAGE has been the “benchmark” for large-scale separation of complex protein mixtures. It separates proteins by the sequential orthogonal use of two different electrophoretic techniques based on two different properties of the proteins. Proteins are first separated by isoelectric focusing (IEF) based on their isoelectric point. Subsequently, the proteins are separated in the presence of SDS according to their molecular weights. Protein detection after 2D-PAGE utilizes either antibody-detection techniques or gel staining techniques as described for 1-D PAGE. The proteins on the gel are detected as distinct spots which can be identified by mass spectrometry. A few hundred to a few thousand spots can be detected on a 2-D gel based on the specifics of the gel size and electrophoresis conditions. 2D-PAGE was first developed by O'Farrell (1975) but has subsequently undergone several modifications designed to improve its resolution, reliability and sensitivity [for example, see Yan et al. (Yan et al. 1999)]. Integrated imaging and bioinformatics tools are now available for proteomic characterization of biological specimens.
The recently introduced modification of 2-D PAGE, termed two-dimensional differential in-gel electrophoresis (2-D DIGE), has significantly improved the speed, reproducibility and sensitivity of 2-D PAGE based proteomics (Friedman, 2007; Friedman et al. 2004; Somiari et al. 2003; Wu et al. 2006; Wu, 2006). Using different fluorescent dyes to label protein samples prior to gel electrophoresis, the DIGE technique allows multiple samples to be co-separated and visualized on one 2-D gel (Unlu et al. 1997). Up to three protein extracts, for example one control and two treated, are labeled covalently with different fluorescent dyes (Cy2, Cy3 and/or Cy5), then combined and separated by 2-D PAGE. Up to three coincident images of the gel are captured–-using the Cy2, Cy3 and/or Cy5 excitation wavelengths. The images are then merged, and differences between them can be determined using image analysis software. 2-D DIGE effectively eliminates gel-to-gel variability that is associated with standard 2-D PAGE and improves the accuracy of quantitative protein profiling (Friedman, 2007). This technology has been used for protein profiling in numerous organisms including bacteria (Rathsam et al. 2005), yeast (Hu et al. 2003), plants (Bohler et al. 2007; Keeler et al. 2007), animals (Henkel et al. 2006; Kisby et al. 2006), and human (Jin et al. 2007; Reynolds et al. 2007). It is also used for analysis of phosphoproteins (Stasyk et al. 2005) and protein-protein interaction (Lyakhovich et al. 2007). The dyes are purported to have a linear response to variation in protein concentration over five orders of magnitude, offer sub-nanogram sensitivity, and are compatible with MS analysis. Main disadvantages to this technology include: 1) the high cost involved in acquiring equipment as well as expendable supplies, such as the fluorescent dyes; 2) the labor-intensive nature of the method, which limits its usefulness as a high-throughput analytical method; 3) proteins that are very acidic (pH < 4) or very basic (pH > 9), have high (>150 kDa) or low molecular weight (< 15 kDa) and proteins that are very hydrophobic are difficult to analyze using 2-D DIGE; and 4) its detection sensitivity dictates that many low abundance proteins (such as transcription factors, many serum biomarkers) are hard to detect with this method. Moreover, both microheterogeneity due to post translational modifications (i.e. one protein producing multiple spots) and comigration (one spot containing two or more proteins) have been observed.
Two approaches of DIGE, termed “minimal” and “saturation” labeling procedures, have been described. The minimal labeling procedure (Lilley and Friedman, 2004; Tannu and Hemby, 2006b) is more widely used. In this procedure, the CyDyes are covalently attached to the lysine residue side chain. The protein-to-dye ratio is deliberately kept high: only 2%-5% of the protein molecules are labeled (thus “minimal labeling”), so that only the proteins containing a single dye molecule are visualized on the gel. Saturation labeling procedure (Kondo and Hirohashi, 2006; Sitek et al. 2006) attaches dye molecules to cysteine residues, and all available cysteine residues are labeled (“saturation labeling”), thereby increasing the fluorescent signal and protein detection sensitivity. The saturation labeling procedure is used specifically for the analyses of scarce protein samples, for example, samples obtained by laser capture microdissection (Kondo and Hirohashi, 2006; Sitek et al. 2006). However, saturation labelling has also several drawbacks: (i) the 2-D spot pattern is significantly altered compared to that of unlabelled or minimal-labeled proteins; (ii) the labeling reaction must be optimized for each sample to produce a uniform labeling of proteins, which is a time-consuming and laborious procedure; (iii) proteins may precipitate during the labeling reaction due to the introduction of the hydrophobic dye molecule; and (iv) currently only two different saturation labeling dyes are available, which excludes the use of an internal standard (Shaw et al. 2003).
Multidimensional protein identification technology (MudPIT)
MudPIT (multidimensional protein identification technology) is a non-gel approach to the identification of proteins from complex mixtures (Kislinger et al. 2005). It offsets many of the disadvantages associated with two-dimensional gel electrophoresis. MudPIT uses two liquid chromatography steps interfaced back-to-back in a fused silica capillary to permit two-dimensional high performance liquid chromatography (Breci and Haynes, 2007). Typically, the first column containing a strong cation exchange (SCX) material is coupled to the second column containing reversed phase (RP) materials, which is in turn connected to a tandem mass spectrometer (MS) (Fig. 1). By exploiting a peptide's unique physical properties of charge and hydrophobicity, complex mixtures can be separated prior to sequencing by mass spectrometry.
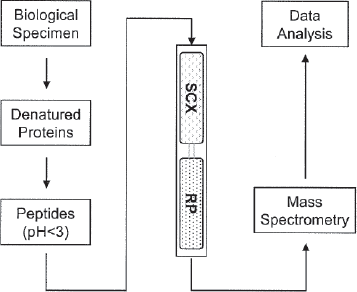
Summary of steps utilized by multidimensional protein identification technology (MudPIT). SCX = strong cation exchange; RP = reversed phase.
A complex peptide mixture generated from protein lysates is loaded onto the biphasic columns (Florens and Washburn, 2006). Sample preparation is relatively straightforward, the samples are denatured, the cysteines reduced and alkylated and the proteins digested with a protease such as trypsin. Charged peptides bind to the SCX column, whereas any uncharged peptides pass through and bind to a reverse phase trap column. Chromatography proceeds in steps with increasing salt concentration to release proteins from the SCX resin in steps unto the RP resin. A reversed phase gradient with increasing hydrophobicity is then slowly introduced to progressively elute peptides from the RP resin into the mass spectrometer. Peptide fragmentation data is then obtained to identify the peptides and hence the proteins from which they are derived. In the next step, a buffer with increased salt concentration is injected onto the SCX column, displacing further peptides from it onto the RP trap column. Salt is removed by washing the column and again an analytical RP separation is performed and the eluting peptides analyzed by mass spectrometry. Incremental increases of salt are used (salt step gradient from around 0–200 mM). The end result is multiple protein identifications from each salt step (Wu and MacCoss, 2002). The biphasic column which is placed in-line with the HPLC system acts as an ion source for tandem MS. This design reduces dead volumes and band broadening, thereby maximizing resolution and sensitivity.
Isotope coded affinity tags (ICAT)
Chemical tagging (usually stable isotope labeling) of proteins/peptides allows for relative quantification of protein samples by liquid chromatography/mass spectrometry (LC-MS) analyses. The prototypical stable-isotope labeling for quantitative proteomics was isotope-coded affinity tags (ICAT) technology. Developed in the laboratory of Dr. Reudi Aebersold, this technology simultaneously quantifies and identifies protein differences in paired samples (Gygi et al. 1999). Essentially, proteins from the two states to be compared are labeled at cysteine residues with light and heavy tags, respectively. Like the cyanine dyes used in 2-D DIGE, the isotopic tags are similar in structure and chemical properties, but are different in mass. The ICAT reagents consist of three functional elements: a cleavable biotin group, an isotopic tag that occurs in a “heavy” or “light” state, and a cysteine-reactive group. Two proteins samples are separately labeled using the heavy (deuterated or 13 C) ICAT reagent for one protein sample and the light (non-deuterated or 12 C) ICAT reagent for the other (Han et al. 2001). The two labeled mixtures are then combined, proteolytically digested and run on an avidin column to pull out only the labeled peptides via the biotin tag. This reduces the complexity of the sample prior to analysis by nano-scale LC-MS/MS (Shiio and Aebersold, 2006). Peaks corresponding to the same peptide are identified as doublets in mass spectra due to the mass difference between light and heavy isotopes. The peak intensities of the peptides correlate directly with the relative abundance of the proteins in the two states. Selected peptides (usually those that show a significant difference in abundance between the two samples) will be subjected to MS/MS analysis to reveal the amino acid sequence and thus the protein identity (Tannu and Hemby, 2006a; Turecek, 2002).
ICAT is a powerful protein profiling technology that allows simultaneous detection and quantification of protein differences between biological samples as well as identification of the proteins. ICAT has the power to quantitatively identify proteins including acidic and basic proteins, membrane proteins, low copy number proteins, and high molecular weight proteins (Griffin et al. 2003; Smolka et al. 2001). The weaknesses of ICAT include (Ciordia et al. 2006; Tannu and Hemby, 2006a): 1) Proteins that do not contain cysteine, or proteins that do not contain cysteine residues on tractable peptides upon proteolytic digestion, will not be detected due to the nature of the labeling procedure (Moseley, 2001). 2) High sample complexity and the data-acquisition rate of the mass spectrometer used may limit coverage of differentially expressed proteins (Moseley, 2001). 3) The number of proteins that can be identified in an ICAT experiment (resolution) is far smaller than what is typically achieved with 2-D PAGE technology (Somiari et al. 2005), although this has been partially improved with technological developments and introduction of more powerful softwares (Bouyssie et al. 2007). 4) The cysteine-based ICAT tags will generally not yield information on changes in the proteome based on post-translational modifications. 5) Avidin columns used to concentrate labeled peptides may further complicate the analysis due to non-specific binding and/or irreversible binding of the peptides (Moseley, 2001).
Stable isotope labeling with amino acids in cell culture (SILAC) is a somewhat similar approach which is used for incorporation of a label into proteins for mass spectrometry (MS)-based quantitative proteomics (Liang et al. 2006). SILAC relies on metabolic incorporation of a given 'light’ or 'heavy’ form of the amino acid into the proteins. Thus in an experiment, two cell populations are grown in culture media that are identical except that one of them contains a 'light’ and the other a 'heavy’ form of a particular amino acid (e.g. 12C and 13C labeled L-lysine, respectively). It is becoming one of the highly effective techniques in cell biology. However, because metabolic labeling is required, this technique is unlikely to be used for proteomic analyses in cancer patients.
Isobaric tags for relative and absolute quantitation (iTRAQ)
Recently a new quantitative method, isobaric tags for relative and absolute quantitation (iTRAQ), was developed (Chen et al. 2007; Overall and Dean, 2006; Ross et al. 2004). This technology employs amine-reactive isobaric tags to label peptides at the N-terminus and the lysine side chains, thereby labeling all peptides in a digest mixture. Currently, eight isobaric tags are available, allowing for the labeling and simultaneous comparison of 8 protein samples by mass spectrometry. The iTRAQ-based protocol contains four steps (Aggarwal et al. 2006; Zieske, 2006), as shown in Figure 1. First, protein extracts are prepared from each sample to be analyzed. Second, proteins are separately digested into polypeptides. Third, each set of the polypeptides are labeled with iTRAQ reagent individually. Finally, labeled peptide samples are mixed and the mixture is analyzed by tandem mass spectrometry (MS/MS) to obtain an MS/MS spectrum. Due to the large number of peptides produced, chromatographic methods are often used individually or in combination to fractionate the peptide mixture prior to LC-MALDI TOF/TOF or LC-ESI TOF/TOF.
Each of the four isobaric reagents has a mass of 145 Daltons, and consists of three groups: reporter, balance, and reactive groups (Ross et al. 2004). The reporter groups have molecular weights of 114, 115, 116, and 117 Daltons, respectively. The carbonyl balance groups ensure that all the iTRAQ-labeled peptides have the same mass. The reactive groups are attached to the N-terminal and the lysine residues of sample proteins. In single MS, peptides labeled with any of the isotopic tags are indistinguishable (isobaric). Upon fragmentation in MS/MS, however, the reporter groups of the iTRAQ reagents will split from the peptide and form small fragments with mass/charges (m/z) of either 114, 115, 116, and 117 (4-plex) or 113, 114, 115, 116, 117, 118, 119, and 121 (8-plex), respectively. Intensity of each of these peaks represents quantity of small reporter group fragment and thus represents the quantity of a peptide. MS/MS analysis will also generate peaks from polypeptides which allow the identification of peptide sequences and therefore protein sequences.
The advantages of iTRAQ include: 1) all tryptic peptides are labeled resulting in increased confidence and higher quality data; 2) up to 8 labels can be used for multiplexing experiments; 3) improved MS/MS fragmentation results in more confident peptide or protein identifications; and 4) post translational modifications, such as phosphorylation, can be analyzed (Gafken and Lampe, 2006). The key disadvantages of iTRAQ include: 1) more mass spectrometry time is required because of the increased number of peptides; and 2) samples must be prepared according to very strict guidelines (Aggarwal et al. 2006).
Surface enhanced laser desorption ionization-time of flight (SELDI-TOF)
Surface enhanced laser desorption ionization-time of flight (SELDI-TOF) is a relatively novel and straightforward proteomic technology that can be used for quantitative analysis of protein mixtures after selectively capturing proteins with unique attributes on activated surfaces (Maurya et al. 2007; Poon, 2007). This technique utilizes stainless steel or aluminum-based supports, or chips, engineered with binding features that have either chemical (hydrophilic, hydrophobic, pre-activated, normal-phase, immobilized metal affinity, and cationic or anionic) or biological (antibody, antigen binding fragments (e.g. scFv), DNA, enzyme, or receptor) bait surfaces (Roelofsen et al. 2007; Szalowska et al. 2007). Solubilized tissue protein samples or body fluids are directly applied to the chips, where proteins can bind to different chromatographic surfaces to retain proteins with specific features. After removing unbound proteins through serial washes, the bound proteins are subjected to analysis by laser desorption ionization-time of flight mass spectrometry. Masses of proteins ranging from small peptides of less than 1 kDa up to proteins of greater than 300 kDa are calculated based on time-of-flight. As mixtures of proteins will be analyzed within different samples, a unique sample fingerprint or signature will result for each sample tested. Consequently, patterns of masses rather than actual protein identifications are produced by SELDI analysis. This allows for comparison of spectra of a large number of samples within an abbreviated time frame and acquisition of differentially expressed proteomic patterns.
SELDI-TOF is a potentially powerful clinical proteomics tool for identification of patients at risk for development of cancer based on the direct analysis of body fluids like serum, plasma, ductal lavage, cerebro spinal fluid and urine (Maurya et al. 2007; Poon, 2007; Zhang et al. 2006). A high profile and well publicized ovarian cancer study utilized SELDI-TOF to identify protein peaks in serum that distinguished patients with ovarian cancer from those without ovarian cancer (Petricoin et al. 2002). While the study design, sensitivity and specificity reported have generated counter comments, the SELDI-TOF is an emerging and potentially powerful proteomic tool that has attributes, e.g. cost and ease of use, that are lacking in other proteomics technologies.
Protein array
Protein arrays are solid-phase ligand binding assay systems comprising of immobilized biological molecules on solid surfaces which include glass, membranes, microtiter wells, mass spectrometer plates, and beads or other particles (Clarke and Chan, 2005; Lueking et al. 2005). The assays are highly parallel (multiplexed) and often miniaturized (microarrays, protein chips). Biological molecules such as antibodies, proteins, protein fragments, peptides, aptamers or carbohydrate are affixed in a grid-like pattern on small surfaces thus forming a microscopic array (Collett et al. 2005; Reid et al. 2007). Thus, protein arrays represent a proteomic tool that closely emulates the DNA microarray technology.
Protein arrays are used to perform protein expression profiling, to analyze protein-protein interactions, to determine the substrates of protein kinases, to identify the targets of biologically active small molecules, or to detect new disease biomarkers (Uttamchandani et al. 2006). One of the chief formats of protein array is the capture array, in which ligand-binding reagents, which are usually antibodies but may also be alternative protein scaffolds, peptides or nucleic acid aptamers, are used to capture target molecules in mixtures such as plasma or tissue extracts. Protein arrays using antibodies as the capture moieties are called antibody arrays (Kopf and Zharhary, 2007), which fall into one of two subtypes: those using matched antibody pairs for sandwich-type assays (forward phase arrays) and those utilizing single antibodies and a sample labeling methodology (reverse phase arrays). The former platform requires the use of a “detector” antibody with is either modified with a directly detectable label (enzyme, fluorescent molecule, isotope, etc.), or it is biotinylated for detection after subsequent probing with labeled streptavidin. This platform essentially resembles ELISA. The latter requires that protein samples be labeled beforehand (e.g. with fluorescent molecule, isotope, or biotin), thus obviating use of a detector antibody. Antibody array technology is attracting a lot of attention because of the potential of analyzing the levels of hundreds of proteins within a pathway of interest (Borrebaeck, 2006).
When other ligand-binding molecules are used, the capture arrays can be used to study functional proteomics such as protein-protein, protein-DNA, protein-drug, receptor-ligand, enzyme-substrate interactions, etc. (Cho and Cheng, 2007). They may also be used to correlate the polymorphic changes resulting from SNPs with protein function. The capture reagents themselves will need to be selected and screened against many proteins, which can also be done in a multiplex array format against multiple protein targets. Another protein array platform, known as ProFusion” (Phylos, Inc., Lexington, MA) arrays, utilizes surface-bound DNA probes that hybridize to a protein via its encoding mRNA. Taken together, these protein array technologies offer advantages include being rapid and automatable, capable of high sensitivity, economical on reagents, and giving an abundance of data for a single experiment (Becker et al. 2006; Hall et al. 2007).
However, the potential of antibody arrays is currently limited by the high cost of producing antibodies and the availability of antibodies that have both high specificity (to eliminate cross reactions with non-specific proteins within the sample) and high affinity for the target of interest (to allow detection of small quantities within a sample). Additionally, the difficulty associated with preserving proteins in their biologically active conformation before analysis with protein arrays further limits the application of this technology as a routine proteomic strategy. Given the amount of information generated from one experiment, significant input of bioinformatics support is important; the data handling demands sophisticated software and data comparison analysis. Fortunately some of the software can be adapted from that used for DNA arrays, as can much of the hardware and detection systems.
Laser capture microdissection (LCM)
The power of proteomic analytical techniques relies heavily on the preparation of homogeneous cell populations. Tumors are heterogeneous microenvironments comprised of stroma, normal cells, and cancer cells at various stages of differentiation. Identification of protein level changes specific to cancer cells is hampered by the composite interspersed cell subpopulations in acquired tissue specimens. In order to overcome this difficulty, Michael Emmert-Buck and colleagues (Emmert-Buck et al. 1996; Emmert-Buck et al. 1994) at the National Institutes of Health (NIH) developed LCM and demonstrated its usefulness for studying various tissue types at the DNA, mRNA, and protein levels.
LCM technology allows researchers to isolate distinct cell subpopulations from stained tumor sections. Tissue sections are mounted on standard glass slides. A transparent, 100-mm-thick, ethylene–-vinyl acetate film is then placed over the dry section (Bonner et al. 1997). During LCM, cells are isolated using an inverted microscope fitted with a low-power near-infrared laser. The laser provides enough energy to transiently melt this thermoplastic film (momentarily heats to 90 oC) in a precise location, binding it to the underlying cells in that location. To improve the convenience of the technique, the transfer film is usually mounted on a transparent cap. After the appropriate cells have been selected, the film and adherent cells are removed, and the unselected tissue remains in contact with the glass slide. The laser diameter can be adjusted from 7.5 to 30 μm so that individual cells or a cluster of cells can be selected. The film holding the captured cells is then transferred to a tube, where an extraction buffer is used to remove the cells for further molecular analysis.
Up to 3000 transfers can be performed on one film. Therefore, up to 3,000–5,000 cells can be isolated from a single slide in this fashion (Simone et al. 1998). Because the plastic film absorbs most of the thermal energy and the pulse lasts for only a fraction of a second, biological macromolecules are not damaged (Bonner et al. 1997; Emmert-Buck et al. 1996). LCM is compatible with many common methods for the preparation of tissue sections. Tissues are typically fixed by alcohol-based precipitation techniques. Although aldehyde-based fixation may also be used, covalent cross-linking of macromolecules can potentially interfere with subsequent analysis of proteins. Tissue sections are stained prior to LCM procedures by standard methods such as hematoxylin and eosin, methylene green nuclear stain, fluorescence in situ hybridization, or immunohistochemistry for identification of tissue morphology and cell populations of interest. Capture of approximately 50,000 cells is sufficient for 2-D PAGE separation and visualization of several hundred distinct spots using silver or fluorescent stains. Image analysis can then be used to identify differentially expressed proteins.
The major challenge in using LCM for proteomic studies is the limited amounts of material collected. For most proteomic applications, it is necessary to procure dozens of slides to get enough material for a single experiment. Although this technique is faster compthan the previously used-microdissection methods, isolation of large numbers of cells from many sections can require considerable time (Vogel et al. 2007; von Eggeling et al. 2007). This shortcoming also significantly limits one's ability to detect and quantify proteins that are present at low levels, such as transcription factors, signal transduction molecules, hormones, etc., even when highly sensitive protein analysis systems are used. Thus far, LCM has been used more successfully with nucleic acids (DNA or RNA), for which amplification methods are available. Another disadvantage is that cover slips and mounting solutions are not compatible with LCM and, as with other microdissection techniques, visualization of samples can be difficult (Maitra et al. 2001). The newer versions of the LCM have a built-in optical system allowing the operator to confirm the histology of the area to be microdissected without transferring the slide. For an experienced histopathologist, this suboptimal visualization should not be a problem. Another limitation of LCM is that it is not compatible with live-cell analysis, but for these applications flow cytometry have been used routinely.
Bioinformatic Analysis of Proteomics Data
Technological advances highlighted above have created a bottleneck at the level of data analysis and resulted in an accumulation of experimental data at a rate far exceeding the current ability to assimilate that data. Transforming the rapidly proliferating quantities of experimental data into a usable form in order to facilitate data analysis is a challenging task (Meunier et al. 2007). Although interpretation of experimental datasets in an interactive and intuitive way will remain a big challenge in the foreseeable future, numerous specialized databases and graphical tools are beginning to make significant contributions toward dissecting protein complex structures, generating functional data organization and revealing hierarchical relationships (Ashburner et al. 2000; Bader et al. 2001; Bohannon, 2002; Demir et al. 2002; Duan et al. 2002; Karp, 1998; Karp, 2001; Ruths et al. 2000; Salamonsen et al. 1999; Sirava et al. 2002). A detailed discussion of these bioinformatics tools are outside the scope of this review, but a number of excellent reviews are available to interested readers (Cannataro, 2008; Deutsch et al. 2008; Ferre, 2005; Palagi et al. 2006).
Discussion
Proteins are the direct effectors of cellular behavior rather than their DNA and mRNA templates. Characterization of protein expression provides the most immediate assessment of cellular functional capacity. The use of laser capture microdissection (LCM) to maximize the concentration of cell populations of interest within the context of their microenvironment so as to optimize protein signal detection is critical for quantitative and comparative analysis to non malignant expression patterns. Use of isobaric tags for relative and absolute quantification and liquid chromatography may provide the broadest quantitative protein analysis achievable for unknown protein comparison with today's technology. Proteins assemble themselves into networks through a variety of protein-protein interactions (Jensen, 2006). The resolution of these coupling events and in silico prediction of outcome from the disruption of these events are likely to provide the functional basis for defining novel and, potentially, effective targets for drug therapy (Aksenov et al. 2005; Christopher et al. 2004; Pearl, 2000; Senzer et al. 2005). Pathogenic gene mutations, gene loss, and gene duplication or amplification as well as epigenetic modifications can result in defective, absent or overexpressed proteins. These proteins realign within the cellular protein network in a “degenerative” pattern resulting in an oncopathologic hostile takeover (Ajani and Allgood, 2005). The culling of these unique tumor proteomic patterns provides the basis for a systematic approach to the development of personalized cancer therapeutics, especially when coupled with functional analysis of individual candidate gene/protein couplets. Correlation of gene expression patterns (protein mediated activity) with disease outcome (survival) has been demonstrated in a variety of cancers (Bhattacharjee et al. 2001; Garber et al. 2001; Perou et al. 2000; Rosenwald et al. 2002; Rosenwald et al. 2003; Shipp et al. 2002). However, gene transcript levels often show poor correlation with protein levels and they cannot predict post translational modifications.
By using the following criteria: (1) differential expression, (2) linkage to essential oncogenic processes, (3) high connectivity, and (4) high bottleneck centrality, it is feasible to reduce a finite number of overexpressed proteins in malignant tissue into a smaller subset of candidate targets, against which potentially therapeutic siRNA or shRNA agents can be constructed (Nemunaitis et al. 2007). These products can then be used to enable a systematic loss-of-function analysis, in order to validate an integrated and coordinated complex of biologically relevant “gene targets” for trial investigation. It is envisioned that future RNAi based gene therapy (one possible approach) for cancer can be prescribed based on the integrated mRNA-proteomic co-expression profile of each individual's tumor.
There are available data allowing preliminary assessment of the potential comparative therapeutic benefits of siRNA versus shRNA as RNAi effectors. Synthetic siRNA can be delivered to the cytosol for direct incorporation into the RNA-induced silencing complex (RISC), whereas shRNA requires Dicer processing or, if delivered in a plasmid, nuclear penetration and translational processing to produce the hairpin shRNA for Dicer. Conversely, Dicer processing may result in a more potent RNAi effector (Siolas et al. 2005). Furthermore, by using miR-30 based shRNA, pol II promoters (rather than pol III) can be used to drive shRNA-mir expression, allow for greater regulation and, perhaps, minimize the potential risk of exportin-5 saturation (Dickins et al. 2005). Obversely, siRNA cannot be amplified intracellularly as can plasmid-expressed shRNA. Preliminary comparisons between siRNA and shRNA (two methods of controlling RNA expression and target protein expression) indicate that shRNA induced knockdown is more durable and efficient than siRNA (Lage, 2005; McAnuff et al. 2007; Stein, 2006; Vlassov et al. 2007) and, furthermore, amenable to second and third layers of tumor specificity via tumor-targeted vector delivery and tumor specific promoter control thereby minimizing non malignant cell uptake and limiting potential toxic effects to non target agents (Dickins et al. 2005; Gossen and Bujard, 1992; Grimm and Kay, 2006; Gu and Fang, 2003; Gupta et al. 2004; Yu et al. 2002). Comparing patient-specific molecular profiles with known and developing human tissue-based pathways and with networks derived from protein interaction databases provides a means for identifying biologically relevent oncodependent target clusters–-In other words, “matching up the right patient with the right therapeutic”.