
Abstract
Background
Strategies for identifying the most relevant psychosocial predictors in studies of racial/ethnic minority women's health are limited because they largely exclude cultural influences and they assume that psychosocial predictors are independent. This paper proposes and tests an empirical solution.
Methods
Hierarchical cluster analysis, conducted with data from 140,652 Women's Health Initiative participants, identified clusters among individual psychosocial predictors. Multivariable analyses tested associations between clusters and health outcomes.
Results
A Social Cluster and a Stress Cluster were identified. The Social Cluster was positively associated with well-being and inversely associated with chronic disease index, and the Stress Cluster was inversely associated with well-being and positively associated with chronic disease index. As hypothesized, the magnitude of association between clusters and outcomes differed by race/ethnicity.
Conclusions
By identifying psychosocial clusters and their associations with health, we have taken an important step toward understanding how individual psychosocial predictors interrelate and how empirically formed Stress and Social clusters relate to health outcomes. This study has also demonstrated important insight about differences in associations between these psychosocial clusters and health among racial/ethnic minorities. These differences could signal the best pathways for intervention modification and tailoring.
Keywords
Introduction
Psychosocial risk factors, measurable concepts that describe individuals' psychological experiences that occur within social contexts, predict chronic disease outcomes in multiple settings and inform risk for disease development, progression, and mortality.1–3 For example, hostility and cynicism are risk factors for the development and progression of cardiovascular diseases, cancer, and all-cause mortality.4–6 Optimism and positive effects are indicators of positive health; they protect against cardiovascular diseases and are associated with reduced all-cause mortality.7–9 Therefore, to extend what is known about chronic disease development, progression, and mortality, in prospective studies of chronic disease risk, psychosocial predictors should be measured and their variance accounted for in disease diagnosis.
Psychosocial predictors may also play an important role in health disparities. According to Marmot and Wilkinson, 10 psychosocial predictors represent psychological and biological responses to and meaning made of inequitable social and economic circumstances. 10 Individuals' psychological responses to these conditions result in behavioral and physiological changes that contribute to disparities in health.11–13 For example, Tindle et al 14 found that African-American/Black women who measured high hostility have significantly higher hazards of all-cause death (62%) and cancer-related death (142%) than high-hostility non-Hispanic White women (13% and 18%, respectively). Differences also exist for positive psychosocial predictors, where optimism has a more pronounced protective effect among African-American/Black than non-Hispanic White women for all-cause (33% vs 14%) and cancer-related mortality (44% vs 7%).
The difficulty with this literature is that the universe of psychosocial predictors is vast and for most disparities researchers it is not desirable, nor financially or otherwise feasible, to measure or intervene on the entire universe of psychosocial predictors relevant to health disparities. Therefore, empirical strategies are needed to identify the psychosocial predictors that are most germane to understanding and eliminating health disparities. The four most common strategies are conducting extensive literature reviews, following existing theoretical frameworks, using predictors identified and published by others, and primary data collection with racially/ethnically diverse samples and some combination of psychosocial predictors. Unfortunately, these strategies are limited because they largely exclude racial/ethnic cultural influences, yet, cultural characteristics—including norms, attitudes, and beliefs manifested through race/ethnicity—are key in producing the meanings attributed to individual psychosocial predictors. 15 Second, the strategies assume that psychosocial predictors are independent from one another; this is a problematic assumption because it ignores the probable overlap and similarity between individual predictors. 16 These limitations may be detrimental to high-quality, empirical selection of the most important psychosocial predictors used for understanding and reducing health disparities.
Suls and Bunde 17 argue that individual psychosocial predictors are not independent and that they share underlying and conceptual similarities. For example, the authors propose that three well-known psychosocial correlates of cardiovascular disease (anger, hostility, and anger expression) are not independent psychosocial predictors;17, p. 287 and that they form a psychosocial cluster, such as an anger cluster. 17 Beyond Suls and Bunde's theory, there are no theoretical frameworks to guide scientifically identified psychosocial clusters. However, two publications have reported on empirically, but theoretically, identified psychosocial clusters that offer guidance. Frasure-Smith and Lesperence 18 and Clark et al, 19 each reported on the existence of psychosocial clusters identified from among numerous individual predictors. In their reports, psychosocial clusters aligned with negative and positive construct characteristics, where multiple predictors with negative characteristics formed a cluster and multiple predictors with positive characteristics formed a cluster. In both cases, the resulting psychosocial clusters were also associated with health outcomes in the expected directions. Negative psychosocial clusters were related to 38% higher hazard for cardiac-related mortality 18 and 37% increased odds of coronary heart disease. 19
From the existing evidence regarding psychosocial clusters, there is only one publication that reported racial/ethnic differences that may exist in psychosocial cluster formation. In the report of Clark et al 19 on psychosocial cluster formation, one psychosocial cluster was identified that varied significantly by race/ethnicity; however, rather than investigating the variation, the cluster was excluded from further analyses. Nevertheless, the variation reported by Clark et al points to race/ethnicity as potentially important for psychosocial cluster formation. Building on Suls and Bundes' ideas, racial/ethnic variation in cluster formation could add to psychosocial explanations for health disparities identified among racially/ethnically diverse populations of women. 17
Two significant gaps exist in the current knowledge about psychosocial clusters and health. First, in the three existing publications that describe clusters, almost no consideration has been given to race/ethnicity in cluster formation or in the relationship between clusters and health among racial/ethnic minority people. This significantly limits the utility and value of clusters in health disparities research. Second, existing evidence about clusters is based on studies that assessed only a small number of select psychosocial predictors. Filling these gaps requires investigating the broad range of psychosocial predictors known to represent the state of the science and best known universe of health-relevant predictors, assessed with a large sample of racial/ethnic minority women. This manuscript aims to fill these gaps.
This project had two objectives, each with its own set of hypotheses. Our first objective was to identify psychosocial clusters from among numerous, highly health-relevant psychosocial predictors and to investigate racial/ethnic differences in clusters. Our first hypothesis was that psychosocial predictors would cluster along the lines of positive and negative attributes for non-Hispanic whites. Our second hypothesis was that among Hispanic women, social and positive predictors would form a cluster, and that among African American/Black women, negative and social predictors would form a cluster. Our second objective was to identify and describe how psychosocial clusters are related to health stratified by race/ethnicity. Our third hypothesis was that the associations between clusters and health would be similar to associations between individual predictors and health for non-Hispanic whites. Our fourth hypothesis was that associations between clusters and health would be more pronounced among racial/ethnic minorities than non-Hispanic whites.
Methods
Study sample
Data for this study were provided by the Women's Health Initiative (WHI). A comprehensive description of the WHI recruitment methods is provided elsewhere. 20
Beginning in 1993, postmenopausal women, aged 50–79 years at baseline, were recruited into the long-term clinical trial or observational study. The observational study included 93,676 women, and 68,132 women participated in the clinical trials. 20 Participants were recruited from 40 geographically diverse rural, suburban, and urban clinical centers in 24 states. WHI represents a racially/ethnically diverse sample of women. 21 Recruitment of racial/ethnic minority participants was proportionate to the total US female minority population.20,21 The current study used baseline data collected from participants in both the observational and clinical trials and included 140,652 participants. This sample size does not reflect the full baseline sample due to missing data. Cases with missing psychosocial or outcome data including quality-of-life measures and chronic disease outcomes (<10%) were excluded. This approach has been used in numerous papers that use and report WHI findings.22–24 The current research complied with the principles of the Declaration of Helsinki and was exempted from the requirement of full IRB review by the Boston University Institutional Review Board (protocol #H-29767).
Measures
Health outcomes
Physical and emotional well-being. Physical and emotional well-being was measured among WHI participants using the Medical Outcomes Short Form-36 (SF-36). 25 Higher scores indicate more favorable emotional and physical well-being.
Chronic disease index. The Williams chronic disease index was used to enumerate the number of chronic diseases experienced by participants. 26 The William's chronic disease index 26 provides an unweighted, self-report frequency of single chronic conditions and co-occurring conditions calculated per individual and included heart attack, arthritis, ulcers, asthma, stroke, hypertension, diabetes, and cancer. The index represented the number of conditions experienced by women in this sample where a higher number of conditions indicated poorer physical health.
Independent variables
Psychosocial predictors. The psychosocial predictors collected at baseline from women via questionnaires are not meant to represent the universe of global characteristics, but rather an optimal battery of psychosocial predictors recommended by leading investigators from across the nation and accepted as empirically relevant to women's health outcomes. 27 Psychosocial predictors collected include social strain, 28 social support, 29 optimism, 30 negative emotional expressiveness and ambivalence over emotional expressiveness, 31 stress,32,33 and cynical hostility.33,34
Social support was measured as the amount of social support an individual had available. Nine questions were asked, and women were asked to indicate how often each of the nine different types of support was available. 29 Responses were summed for a total scale score, where higher scores indicated greater social support.
Social strain, an indicator of negative social support, was measured with four questions. 28 Response items were summed for a total social strain score, where a higher score indicated greater social strain.
The Life Orientation Test—Revised was administered to measure optimism. This scale is composed of six items, and item ratings were summed for a total score where a higher score indicated a higher level of optimism and lower scores indicated higher degree of pessimism. 30
Negative emotional expressiveness (NEE) is an indicator of an individual's tendency to express negative emotions. Four items from the Emotional Expressiveness Questionnaire were used to measure NEE. 31 Responses were set to a five-point Likert scale and were averaged to generate a total score where higher scores indicated a greater tendency to express negative emotions.
Ambivalence over Emotional Expressiveness is measured by the Ambivalence over Emotional Expression Questionnaire. 31 Responses to three items were averaged, and higher scores indicated greater ambivalence in expressing negative emotions.
Stress was assessed from two variables, life events and caregiving. Eleven items were used to assess life events. 32 The responses were summed, and higher scores indicated greater number of and more upsetting events.
Caregiving may also be a source of social strain and stress for some women. If women indicated that they were helping a sick friend or a family member on a regular basis, they were asked how often they help this person. Responses ranged from 0 to 4, where 0 equaled none, not providing care and 4 indicated five or more times a week. 35
Cynical hostility, or mistrust of others, was measured with the Cook-Medley Questionnaire. 33 Positive items were reverse scored, and all items summed, with higher scores indicating higher levels of cynical hostility.
Demographic characteristics
Demographic characteristics were collected from participants using a standardized questionnaire. The current analysis included only age, education, income, and race/ethnicity. Participants self-identified as one of the following racial/ethnic groups: American Indian/Alaska Native, Asian or Pacific Islander, Black or African American, Hispanic/Latino, non-Hispanic white, and other.
Analyses
Hierarchical cluster analysis
Hierarchical cluster analysis was conducted to examine how the psychosocial predictors clustered. Hierarchical cluster analysis is an assumption-free classification technique used to identify homogenous bundles of variables.36–38 This technique is advantageous over others, such as factor analysis (eg, principal component analysis), in the partitioning of variance. 37 Factor analysis partitions individual variable variance into several factors, whereas hierarchical cluster analysis assigns the total variance of a variable to a single underlying source based on similarity. 37
The number of clusters produced by hierarchical cluster analysis was determined by interpreting the dendrogram,39,40 a graphical representation of the clusters. Dendrograms (eg, Fig. 1) provide three key pieces of information: weight, compactness, and distinctness. Weight is the total percentage of psychosocial predictors represented in each cluster. Compactness is the degree of similarity between predictors within each cluster as indicated by the relative distance on the x-axis from the point at which all the predictors come together as a cluster. Distinctness is represented by clusters' degree of dissimilarity from one another as indicated by the length of the branches along the x-axis.
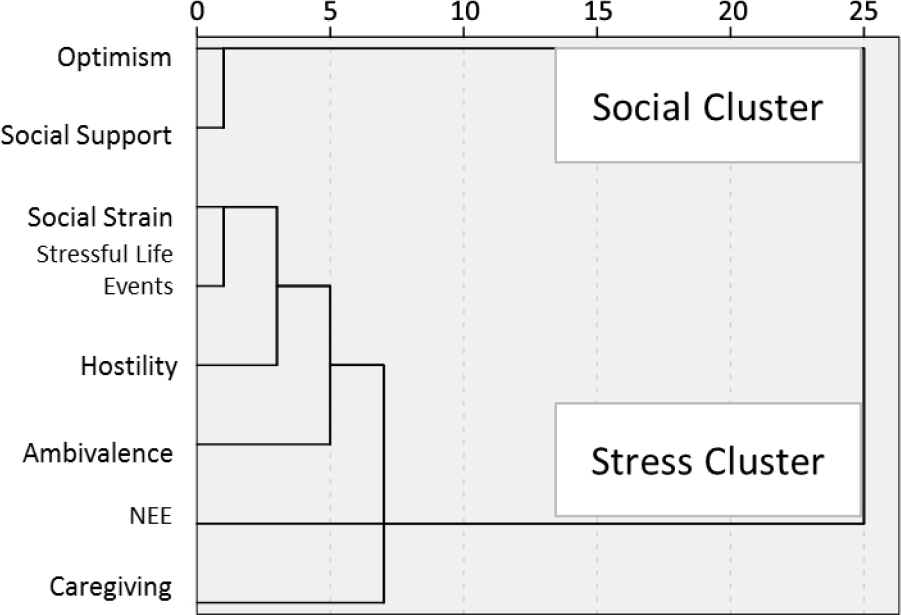
Dendogram of individual constructs as psychosocial clusters.
Cluster reliability cannot be determined using techniques reliant on correlation matrices.41,42 Consequently, cluster consistency was determined by comparing cluster analysis calculated independently on randomly selected split halves. Consistency across the sample halves indicated cluster reliability. For multigroup comparisons in psychosocial cluster patterns, hierarchical cluster analysis was first conducted on the baseline sample, and then we examined psychosocial cluster patterns according to women's racial/ethnic subgroup.
Cluster analysis results were reported according to published guidelines.37,38 To standardize across multiple scales and to enable the use of clusters in regression analyses, the z-scores for individual variables were calculated and then averaged to generate new, composite variables (ie, psychosocial clusters). After variables were created from the psychosocial clusters, measures of central tendency were calculated for each cluster. Clusters were dichotomized at their means, where z-scores above the mean were coded as 1 and z-scores below the mean were coded 0. Cluster analyses were computed with SPSS 18.0. Interaction effects between clusters on health were examined where theoretically appropriate.
Descriptive and multiple variable regression analyses
Descriptive statistics were calculated on participants' demographic characteristics, psychosocial variables, and outcomes.
Multivariate linear regression tested clusters associated with physical and emotional well-being. Multivariate Poisson regression tested clusters associated with the chronic disease index. Regression models were first calculated with the full sample and then stratified by race/ethnicity. There is evidence that the magnitude of associations between psychosocial predictors and health is modified by race/ethnicity. 9 Stratifying models by race/ethnicity permits investigation of these potential racial/ethnic differences. Multivariate models were adjusted for age, income, and education. Regression analyses were computed with Stata 11.
Results
Demographic characteristics
Table 1 summarizes the demographic characteristics of the current study sample. Over 66% of the sample was older than 60 years, and 83% were white, with African Americans as the largest represented minority accounting for 9% of the sample. The largest proportion of participants, 63%, reported annual household earnings between $20,000 and $74,999, and 38% indicated completing some college or vocational school.
Participant characteristics.

Forming psychosocial clusters
Table 2 provides a correlation matrix for all of the psychosocial predictors included in the cluster analysis. With the exception of two pairs of psychosocial predictors, ambivalence of emotional expressiveness and caregiving and NEE and social support, all other psychosocial predictors were correlated in the expected directions.
Psychosocial concepts pairwise correlations.

P ≤ 0.05.
P ≤0.0001.
Table 2 also provides a correlation matrix for psychosocial predictors, demographic characteristics, and well-being and chronic disease index. The correlations between clusters, outcomes, and select demographic characteristics were in the expected direction and ranged from − 0.40 to 0.40 (Table 2).
The hierarchical cluster analysis produced a two-cluster solution (Fig. 1). The first cluster is referred to hereafter as the Social Cluster, and the second cluster is referred to as the Stress Cluster. The clusters were distinct from one another, as indicated by the long horizontal branches that lead from each cluster to their connection (25 on the x-axis). The predictors that comprised the Social Cluster were highly similar to one another. Their similarity was indicated by the cluster's compact nature and is illustrated on the dendrogram by the short distance on the x-axis before the predictors emerged as one cluster (between 0 and 5 on the x-axis). The Stress Cluster was also compact, but less so than the Social Cluster, and emerged between 5 and 10 on the x-axis. The Social Cluster's weight was 25%, where two of the eight psychosocial predictors formed the cluster. The Stress Cluster's weight was 75%, where six of the eight psychosocial predictors formed the cluster. The cluster structure remained consistent for both clusters when hierarchical cluster analyses were conducted independently on two randomly selected split halves from the sample.
Table 3 presents cluster summary statistics for the full sample. The individual predictors that comprise the Social Cluster (optimism and social support) were all scored in the same direction such that larger scores were thought to be more positive than lower scores. The individual predictors that comprise the Stress cluster (social strain, stressful life events, hostility, ambivalence, NEE, and caregiving) were also all scored in the same direction such that larger scores were thought to be more negative than lower scores.
Functional clusters summary statistics.

Psychosocial clusters and race/ethnicity
When hierarchical cluster analysis was conducted by race/ethnicity, the same two-cluster solution was produced for non-Hispanic White and African/American Black women. Table 3 summarizes the cluster summary statistics by race/ethnicity. Mean Social Cluster values were significantly different across racial/ethnic group (P < 0.001) with the Social Cluster average values significantly lower among racial/ethnic minority women, as compared to non-Hispanic white women.
Cluster associations with well-being
Emotional well-being. Table 4 summarizes the multivariate linear regression results for the full sample. Both psychosocial clusters were associated with emotional well-being (P < 0.001).
Associations between clusters and emotional and physical well-being and chronic disease index.

≤ ns.
The Social Cluster was positively associated with emotional well-being; the emotional well-being of those individuals having Social Cluster values above the mean on average was 10 units higher than those below the mean (P < 0.001). Conversely, individuals with Stress Cluster values above the mean had emotional well-being that was 7 units lower than those below the mean (P < 0.001).
When an interaction term between the Social and Stress clusters was added to the model, the Social Cluster was found to modify the association between Stress Cluster and emotional well-being in the full sample (P < 0.001) with the Social Cluster buffering negative associations between the Stress Cluster and emotional well-being (data not shown).
Physical well-being. Summarized in Table 4, the Social and Stress Clusters were associated with physical well-being (P < 0.001). The Social Cluster was positively associated with physical well-being, where individuals with Social Clusters above the mean had physical well-being that was on average 7 units higher than those below the mean (P < 0.001). Conversely, individuals with Stress Cluster values above the mean had physical well-being that was 5 units lower than those below the mean (P < 0.001).
When an interaction term between the Social and Stress clusters was added to the model, the Social Cluster modified and buffered the association between Stress Cluster and physical well-being in the full sample (P < 0.001).
Clusters and quality of life stratified by race/ethnicity
Emotional well-being. Table 4 also presents the multivariate linear regression results stratified by race/ethnicity. Both psychosocial clusters were associated with emotional well-being in each racial/ethnic group with the Social Cluster positively associated and the Stress Cluster negatively associated. The Social Cluster had the largest positive association with emotional well-being among American Indian/Alaska Native women (P < 0.001). The Stress Cluster had the largest negative association with emotional well-being among American Indian/Alaska Native women (P < 0.001). The Social Cluster buffered the association between Stress Cluster and emotional well-being in each of the racial/ethnic groups.
Physical well-being. Psychosocial clusters were also associated with physical well-being among all racial/ethnic groups (Table 4). The Social Cluster was positively associated with physical well-being in each racial/ethnic group, with the largest association observed among American Indian/Alaska Native women (P < 0.001). For all racial/ethnic groups, the Stress Cluster was negatively associated with physical well-being, with the largest association observed among American Indian/Alaska Native women (P < 0.001).
The Social Cluster buffered against the negative association between Stress Cluster and physical well-being among all racial/ethnic groups except American Indian/Alaska Natives and Asian American/Pacific Islanders.
Cluster associations with chronic disease index
Table 4 summarizes multivariate Poisson regression results. Both clusters were significantly associated with the chronic disease index (P < 0.001) with the Social Cluster negatively and Stress Cluster positively associated with the number of chronic conditions. Those individuals having Social Cluster values above the mean had on average 0.90 times as many chronic illnesses compared to those with lower Social Cluster values. Those individuals having Stress Cluster values above the mean had on average 1.16 times more chronic illnesses compared to those with lower stress.
When an interaction between the Social and Stress clusters on chronic disease was added to the model, the Social Cluster was found to slightly modify the relationship between stress and the number of chronic illnesses (P < 0.001). The Social Cluster was best at buffering against the Stress Cluster's effect on chronic disease when the Social Cluster values where higher than when they were lower.
Cluster associations with chronic disease index stratified by race/ethnicity
Table 4 summarizes the multivariate Poisson regression results for all racial/ethnic groups. The Social Cluster was inversely associated with the chronic disease index among all racial/ethnic groups except Asian American/Pacific Islanders and other. The Social Cluster had the largest association with chronic disease index among African American/Black women (P < 0.001). The Stress Cluster was positively associated with the chronic disease index among all racial/ethnic groups with the largest association among American Indian/Alaska Native women (P < 0.001).
The Social Cluster buffered the association between Stress Cluster and chronic disease index for only non-Hispanic white women (P < 0.001) and American Indian/Alaska Native women (P < 0.001).
Discussion
We fulfilled our first objective and confirmed the presence of, and described in detail, psychosocial clusters comprised of individual psychosocial predictors. Our first hypothesis was supported. Eight individual psychosocial predictors clustered into two larger groupings based on their underlying similarity: the Social Cluster and the Stress Cluster. Our findings align with empirical 43 and conceptual 44 evidence for the independence of positive and negative psychosocial predictors. Our findings are also similar to others18,19 who have also reported the existence of two distinct psychosocial clusters; one cluster comprised of negative and one of positive psychosocial attributes. Stress and Social Clusters are two of what could be several clustered psychosocial dimensions relevant to health. To determine the absolute number of clustered dimensions, additional analyses of multiple psychosocial predictors collected from large, diverse samples must be conducted. However, there is evidence from the current study and existing literature 19 for three clusters: Distress Cluster, 19 Stress Cluster (Jabson), and Social Cluster (Jabson). The Stress and Distress Clusters were similar in composition where each included distress/stress-oriented psychosocial predictors. The Social Cluster was unique in that it was comprised of both positive and social psychosocial attributes. It is possible that if optimism and social support were assessed in tandem with additional multiple social and positive psychosocial predictors, two clusters would emerge: a social cluster and a positive cluster. Currently, there is a gap in the evidence that might be filled by a positive psychosocial cluster. A positive cluster could be comprised of predictors such as self-esteem, happiness, and optimism. Testing for a positive cluster could involve assessing a large, diverse sample with a comprehensive battery of positive, negative, and social psychosocial predictors.
We did not find evidence of our second hypothesis. Psychosocial clusters did not differ by race/ethnicity. It is possible that a difference in the meanings ascribed to psychosocial predictors is closely linked with nativity and acculturation. The WHI sample is a highly acculturated sample with less than 1% of the sample preferring a language other than English and approximately 7.3% born outside the United States. Perhaps in a sample that was less acculturated, cluster formations would have differed according to our hypotheses. However, our findings show that psychosocial predictors had similar meanings and formed similar clusters in this racially/ethnically diverse sample. Future work that involves applying our findings to recently immigrated and/or less acculturated samples should first explore the stability of clusters in these groups.
Our third hypothesis was supported. Clusters were associated, in the hypothesized directions, with physical and emotional well-being and the Williams chronic disease index. The Social Cluster was significantly associated with higher scores on emotional and physical well-being and with fewer chronic diseases. The Stress Cluster was associated with poorer physical and emotional well-being and with more chronic diseases. These findings match with the extensive body of research that has linked social support and networks to positive health outcomes45,46 and uncontrolled stress with health decrements. 47
When the Social cluster and Stress cluster were identified, post hoc tests of the buffering hypothesis were conducted. The buffering hypothesis posits that stress negatively affects health in the absence of adequate social support. 48 An interaction effect was identified between the clusters where the Social Cluster buffered against the negative effects of the Stress Cluster on health outcomes. We interpret this finding cautiously as these are cross-sectional data.
The second objective of this study was to describe associations between clusters and health by race/ethnicity. The findings supported our fourth hypothesis: the associations between psychosocial clusters and health were more pronounced for racial/ethnic minority subgroups than for non-Hispanic whites. The largest associations between psychosocial clusters and emotional and physical well-being were among Hispanic/Latino and American Indian/Alaska Native women. The cultural importance of social support and social networks in these subgroups has been established49,50 as has their importance for disease prevention and management.51,52 It is possible that our findings reflect the salience of social predictors to Hispanic/Latino and American Indian/Alaska Natives. The Stress Cluster also had the largest associations with poor emotional and physical well-being among Hispanic/Latinos and American Indians/Alaska Natives. There is evidence that both Hispanic/Latinos and American Indian/Alaska Natives experience higher than average stress and trauma compared to white samples.53,54 It is possible that the associations observed between the Stress Cluster and health reflect the long history of stressors and trauma experienced by these subgroups. These findings are important because they provide a first look at how clustered psychosocial predictors relate to individual health outcomes by race/ethnicity.
The magnitude of effect associated with the psychosocial clusters for health-related quality of life was noteworthy. For emotional well-being, women with higher Stress Cluster values reported a 9–10 unit mean difference depending on their Social Cluster scores, while the mean unit differences for physical well-being ranged from 4 to 9. While this study was cross sectional and did not involve an intervention to alter subjective well-being, it is nevertheless helpful to place the magnitude of the observed differences within the context of existing literature. Traditionally, a shift of 3–5 points on health-related quality of life scales has been considered to be clinically significant, 55 although the differences we observed in this study were larger than that and approached what more recent expert panels have deemed to be clinically significant changes for patients with chronic conditions. 56 For self-reported chronic conditions, being above the mean on the Social Cluster or below the mean on the Stress Cluster was associated with about 1 less chronic condition. In older adults, even 1 additional chronic condition has been shown to contribute to disability. 57
The findings reported here extend the existing literature in several ways. By identifying psychosocial clusters and their associations with health, we have taken an important step toward understanding how individual psychosocial predictors interrelate and how empirically formed clusters relate to health outcomes. Our approach provides a unique strategy for considering multiple, interrelated psychosocial predictors with health. This study has also demonstrated important insight about differences in associations between psychosocial clusters and health among racial/ethnic minorities. These differences could signal the best pathways for intervention modification and tailoring. For example, in tailoring a chronic disease management intervention to a racial/ethnic minority group, the cluster findings presented here might provide valuable information about which intervention components could be improved to enhance intervention effects.
This study has several limitations. One major limitation of these data is their cross-sectional nature. These analyses were meant first to establish the nature of clusters, whether they exist and what their properties are, and how they are related to health in a cross-sectional fashion. Any inferences we want to make about causality of these clusters on disease outcomes must wait for future analyses that use the strength of the WHI longitudinal data collection to understand how clusters predict health over time. Additionally, WHI does not reflect a population-based sample, and the results reported here may be influenced by the healthy volunteer effect. 58 Consequently, results reported here cannot be generalized to all women. Since the time that baseline measures were collected from WHI participants 1993–1998, additional self-report measures of chronic minority stress and microaggressions, as well as minimally invasive biological markers of stress such as salivary cortisol, have become available. Our findings may have been enhanced if such measures could have been applied to this study because they could add to understanding how individuals' psychological responses to inequitable social and economic conditions result in physiological changes that contribute to disparities in health. However, the baseline measures reflected the most health-relevant measures at that time and remain relevant today.
Our findings suggest important next steps. First, we must test the relationships between psychosocial clusters and longitudinal health outcomes. These analyses will inform the pathway between psychosocial clusters and women's health in ways that cross-sectional methodologies cannot. Second, we must examine the relationships between psychosocial clusters and health-related behaviors. There is evidence of the importance of individual psychosocial constructs and health-related behaviors,59–61 but it is not yet known what role health-related behaviors play in the relationship between psychosocial clusters and women's health. Determining this relationship could offer valuable insight about pathways for risk reduction.
Author Contributions
Conceived and designed the experiments: JJ, DB, and JW. Analyzed the data: JJ. Wrote the first draft of the manuscript: JJ. Contributed to the writing of the manuscript: JJ, DB, JW, SS, JL, CK, HT, and CM. Agree with manuscript results and conclusions: JJ, DB, JW, SS, JL, CK, HT, and CM. Jointly developed the structure and arguments for the paper: JJ and DB. Made critical revisions and approved final version: JJ, DB, JW, SS, JL, CK, HT, and CM. All authors reviewed and approved of the final manuscript.
Footnotes
Acknowledgments
We would like to acknowledge the Women's Health Initiative (WHI) and all of the participants; without participant contributions and data access granted by the scientific review committee, this work would have been impossible.