
Abstract
Objectives
To investigate the role of insulin resistance (IR) and insulin plasma levels (IRI) in patients with chronic liver disease (CLD) and hepatocellular carcinoma (HCC).
Methods
We recruited the following patients: 125 with HCC, 128 with liver cirrhosis (LC) and 133 with chronic hepatitis C (CHC). IR was assessed by the HOMA-IR method. To define IR and hyperinsulinemia we selected as a cut-off level, the value of the 80th percentile for HOMA-IR (2.72) and IRI (11.18) in 113 healthy subjects.
Results
The mean levels of HOMA-IR and IRI increase progressively among CHC (2.7 ± 2.9 and 11.5 ± 10.5, respectively), LC (5.4 ± 4.5 and 17.6 ± 11.2) and HCC (6.4 ± 9.8 and 18.2 ± 18.8). In the upper quintiles for HOMA-IR and IRI, the frequency of patients in the LC and HCC groups was twice as much in CHC cases. HCC with DM2 have the greatest percentage above the 80th percentile of HOMA-IR, their quintiles distribution is inverted and HOMA-IR mean values are significantly higher in comparison with HCC without DM2 cases.
Discussion
Our study shows that the association between IR and CLD begins in the early stages of liver fibrosis. DM2 increases HOMA-IR and IRI mean levels in HCC patients and these metabolic factors could play a major role in the link between diabetes mellitus and hepatocarcinoma.
Introduction
The relationship between diabetes mellitus and solid cancers has been reported in type 2 diabetes mellitus (DM2) patients. 1 In fact, several studies have shown that DM2 patients present an increased mortality for cancer of endometrium, colorectal, pancreas, kidney, breast and hepatocellular carcinoma (HCC).2–4
Previous investigations have shown that up to 96% of patients with chronic liver disease (CLD) may have impaired glucose tolerance and 20%–30% of patients with liver cirrhosis suffered from clinical DM2 (hepatogenous diabetes).5,6 Nevertheless, the association between diabetes and CLD is complex and reciprocal because type 2 diabetes mellitus appears to be a cause of non-alcoholic fatty liver disease (NAFLD) that may progress, over a period of many years, from steatohepatitis to cirrhosis and, sometimes finally, to HCC. 7 On the other hand, liver cirrhosis and hepatitis C virus infection increase the susceptibility to diabetes mellitus.8,9
It has been suggested that insulin resistance (IR) may represent the link between DM2 and chronic liver disease.4,10 IR is the main component of the metabolic syndrome, a common disorder that ensues from the increasing prevalence of obesity and diabetes worldwide. 11 IR and glucose metabolism impairment are also associated with hepatic fibrosis and cirrhosis, regardless of its etiology.12,13
In the last years some studies have been carried out on the metabolic and clinical characteristics of DM2 patients with chronic liver disease.4,14–16 Two recent investigations17,18 linking insulin and liver diseases showed that in patients with chronic hepatitis C virus infection IR is associated with advanced hepatic fibrosis and more rapid progression of liver disease.
A recent report 19 noted that DM2 is associated with a 3-fold increased risk of hepatocarcinoma occurrence in our population. In addition, we observed that DM2 pre-exists to the development of HCC in most diabetic patients. Patients with HCC and glucose intolerance in our study show clinical and metabolic characteristics consistent with a state of insulin resistance with compensatory hyperinsulinemia, both typical features of type 2 diabetes mellitus patients. We have therefore hypothesized that the link between DM2 and HCC may be represented by hyperinsulinemia either of endogenous source, related to an insulin-resistance state, and of exogenous origin, dependent on antidiabetic treatment with exogenous insulin or oral agents that enhance pancreatic insulin secretion, like sulfonylureas.
Therefore, the purpose of our study is to investigate the role of insulin resistance and insulin plasma levels not only in HCC cases but also evaluating subjects with early stages of CLD, as patients with chronic hepatitis C and liver cirrhosis.
Subject
The following four groups have been studied:
HCC
One hundred twenty-five patients (86 males and 39 females) with hepatocellular carcinoma, mean age 65.7 ± 9.9 years, admitted consecutively from April 2006 to April 2008 at our Medical Department in the Pordenone Hospital-Italy, were recruited.
According to the etiology of the underlying liver disease, patients were subdivided as follows:
HBV 9.6%, HCV 45.6%, Alcohol 38.4% and Cryptogenic 6.4%.
HCC was diagnosed by cytological or histological examination of hepatic focal lesions or according to the following acknowledged criteria: 20 ultrasound examination (also by using micro-bubbles of sulphur hexafluoride as contrast dye), alpha fetoprotein (AFP) >400 ng/ml, computerized tomography scan and/or magnetic resonance imaging of the upper abdomen.
Diabetes mellitus was diagnosed using the American Diabetes Association criteria: 21 fasting plasma glucose ≥126 mg/dl (confirmed on a subsequent day in the absence of unequivocal hyperglycemia) or symptoms of hyperglycemia and a casual plasma glucose ≥200 mg/dl.
In HCC patients, DM2 was present in 30 (24.0%) patients, all diet treated.
Liver cirrhosis
One hundred twenty-eight patients (82 males and 46 females) with liver cirrhosis (LC), mean age 66.2 ± 5.2 years, individual-matched with HCC cases according to age (±5 years), gender, history and treatment of diabetes, time of admission, body mass index (BMI) and etiology of the liver disease, were enrolled.
These patients were admitted to our Hospital for diagnosis, staging or therapy of liver cirrhosis.
The diagnosis of cirrhosis was performed by hepatic biopsy or by ultrasound examination in the fasting state showing the presence of splenomegaly, hypertrophy of left or caudal lobes and surface irregularity or by transient elastography by Fibroscan (Echosens, Paris) with a liver stiffness >12.5 kPa. 22 According to Child's classification of cirrhosis, patients were classified as follows: Class A 65.5% and B 34.5%. In cirrhotic patients, the presence of HCC was ruled out through ultrasound examinations, CT or MRI of the upper abdomen and AFP checks. Based on the histological examination, hepatic steatosis was reported in 28% of LC cases. DM2, only diet treated, was present in 30 (23.4%) of these patients.
Chronic hepatitis C
We recruited one hundred thirty-three patients (85 males and 48 females), mean age 61.2 ± 8.7 years, with diagnosis of chronic hepatitis C (CHC), individual-matched with HCC and LC cases according to age (±5 years), gender, history and therapy of diabetes, time of admission and body mass index (BMI). The HCV genotypes were: 1a (5.3%), 1b (52.4%), 2a/2c (30.1%), 3 (4.8%) and untypable (7.4%). Before enrolment, none of the patients had been treated with antiviral drugs. Biopsy of the liver showed the following stages of fibrosis: F0: 30.5%; F1: 49.2%; F2: 18.5% and F3: 1.8%. On histological examination, hepatic steatosis was reported in 42% of cases.
All patients showed active infection with high transaminases values. Other risk factors for hepatic disease were absent, in particular HBV infection, autoimmunity, iron and copper overload and alcohol abuse. In CHC patients, diet treated DM2, was present in 31 (23.3%) of patients.
Healthy subjects
To evaluate the basal HOMA values of our healthy population we recruited, from the outpatient clinic, the doctors and nurses of our Department, one hundred thirteen (74 males and 39 females) healthy, Caucasian, normo-weight subjects with mean age of 30.3 ± 3.2 years. All subjects had a normal standard oral glucose tolerance test and no risk factors for metabolic and liver diseases; in particular, individuals with alcohol abuse were excluded.
Methods
Ethics
This work has been carried out in accordance with the Declaration of Helsinki (2000) of the World Medical Association.
Clinical parameters assessment
Demographic, clinical and biochemical data of each patient were collected in a computerized database. Biochemical parameters were determined at the Pordenone Hospital central laboratory using standardized and validated methods. Body mass index (BMI) was calculated as body weight in kilograms divided by the square of height in metres (kg/m2).
Alcohol intake evaluation
A trained nurse assessed the alcohol intake by interviewing the patients using a standard questionnaire. Total alcohol intake was evaluated retrospectively on the basis of a history of lifetime consumption, dividing the patient's life into 10-years periods, and recorded as the average amount of ethanol (mL) ingested daily. Each subject was classified according to his/her maximum level of alcohol consumption for one or more decades in his/her lifetime in order to avoid underestimation of alcohol consumption in subjects with HCC and a history of alcoholic liver disease. Alcohol use was evaluated considering an average alcohol content in volume of 5% for beer (a can = 330 mL), 12% for wine (a glass = 125 mL) and 18% for aperitifs, 30% for digestive alcoholic drinks and 40% for liqueurs (a measure = 40 mL). 23 A glass of wine, a can of beer or a measure of spirits contain about 16 g of ethanol. Alcohol abuse was defined as a daily consumption of more than 30 g in males and of more than 20 g in females.
Laboratory assessment
Venous blood samples were taken in the morning after 12-h overnight fasting.
Hepatitis B surface antigen (HBsAg), anti-HBV surface antigen (anti-HBs), anti-HBV core antigen (anti-HBc), and hepatitis B “e” antigen (HBeAg) were determined by using commercial assays (Abbott Diagnostic Division, Wiesbaden; Germany).
Antibodies against HCV (anti-HCV) were determined using a third-generation micro particle enzyme immunoassay (AxSYM HCV version 3.0, Abbott Diagnostic Division). Positive samples were tested for anti-HCV using a third-generation line immunoassay (Immunogenetics, Gent, Belgium) and for serum HCV-RNA using the Roche Amplicor version 2.0 (Roche Molecular System, Pleasenton, CA).
Fasting plasma glucose concentration was measured by an esochinase method on an Advia 1650 analyser (Bayer AG, Germany). Insulin was measured by chemiluminescence immuno assay on an Advia Centaur analyser (Bayer AG, Germany). Because pancreatic insulin secretion is pulsatile, for each subject we used the mean of three samples taken at 5-minutes intervals.
HOMA evaluation
Insulin resistance was assessed by the Homeostasis Model Assessment method24,25 for the evaluation of insulin resistance (HOMA-IR). HOMA-IR is a method that can be employed in large studies and has been validated for assessing IR against the reference method of euglycemic-hyperinsulinemic clamp in Italian patients. 26 The HOMA index of insulin resistance (HOMA-IR) was calculated on the basis of fasting values of plasma glucose (FPG) and immunoreactive insulin (IRI), as follows: [FPG (µmol/mL) × IRI (µU/mL)]/22.5. With this method, high HOMA-IR scores denote low insulin sensitivity (insulin resistance). The analyses for IR determination were repeated using the quantitative insulin sensitivity check index (QUICKI), as an alternative surrogate marker of IR, computed as follows:1/[log IRI (µU/mL) + log FPG (mg/dL)], 27 that showed consistent results with HOMA-IR computation values. The HOMA values were analyzed using a double approach, as a continuous variable and as a categorical parameter. For the latter, the HOMA values were categorized according the cut-off level of the 80th percentile. HOMA-β,18,24 a parameter reflecting the insulin secretion ability of pancreatic β-cells, was calculated as follows: [360 × IRI (µU/mL)]/FPG (µmol/mL)/0.0555–63].
Statistics
Parametric data are expressed as mean values ± standard deviation (SD) and categorical variables as percentages. The chi-square test was used for the comparison of dichotomous variables and the Student's t test for continuous variables. One-way ANOVA was used to test differences on multiple levels by a single factor (independent) variable. A P value < 0.05 was considered statistically significant. Post hoc comparisons were performed using Bonferroni test. All statistical analyses were performed using SPSS software 13.0 for Windows (SPSS Inc., Chicago, IL, USA).
Results
HOMA and IRI levels in healthy subjects
To assess the mean ± SD levels of the metabolic features in our normal, healthy population we selected 113 subjects that show the following demographic and metabolic parameters (Mean ± SD): age 30.3 ± 3.2, BMI 23.0 ± 2.0, FPG 89.7 ± 9.5, IRI 7.9 ± 4.6 (median 6.05), HOMA-IR 1.8 ± 1.2 (median 1.50), HOMA-β 107.4 ± 57.4. The HOMA-IR and IRI data of these subjects show a right-skewed (with the median value lower than mean), unimodal distribution.
Patient characteristics
The clinical and biochemical features of the 3 groups of patients are listed in Table 1.
Clinical and biochemical characteristics of CHC, LC and HCC patients.

Data are expressed as Mean ± SD.
Mean age, BMI and fasting plasma glucose (FPG) values are not different among CHC, LC and HCC patients.
The values of IRI and HOMA-IR are comparable in LC (mean 17.6 ± 11.2, median 16.1 and mean 5.4 ± 4.5, median 4.6, respectively) and HCC patients (mean 18.2 ± 18.8, median 15.3 and mean 6.4 ± 9.8, median 4.1), but are significantly higher than in CHC subjects (mean 11.5 ± 10.5, median 9.7 and mean 2.7 ± 2.9, median 2.1).
Mean HOMA-β levels are significantly higher in CHC (160.5 ± 139.2) and HCC (160.1 ± 145.2) patients in comparison to LC cases (120.9 ± 77.9) in which HOMA-β mean levels are comparable to those in healthy subjects of our population (107.4 ± 57.4).
HOMA-IR, IRI and HOMA-β levels in diabetes mellitus subgroups of HCC
In HCC patients, HOMA-IR values are 2-fold and significantly higher in DM2 positive subgroup as compared with DM2 negative cases (Table 2). Otherwise, the HOMA–β values are significantly higher in DM2 negative (215.5 ± 209.4) than in diabetic HCC patients (106.2 ± 70.9), in which HOMA–β mean values are similar to those in healthy subjects (107.4 ± 57.4).
Clinical and biochemical features of 125 HCC patients with and without diabetes mellitus.

HOMA-IR, IRI and HOMA-β levels and etiology of CLD
We do not find statistical differences in HOMA values and DM2 prevalence among the etiologic groups of HCC cases (Table 3). However, in HCC patients with HBV infection we found the lowest mean level of HOMA-IR (2.9 ± 1.5). The mean HOMA-IR levels progressively increase in HCV infected patients (5.0 ± 4.9) and with alcohol abuse (7.6 ± 14.3) patients with HCC. The HCC subjects with Cryptogenic etiology show the highest mean HOMA-IR values (8.3 ± 6.0) and DM2 prevalence (50%).
Prevalence of DM2 and HOMA values (M ± SD) of 125 HCC patients with different etiologies.
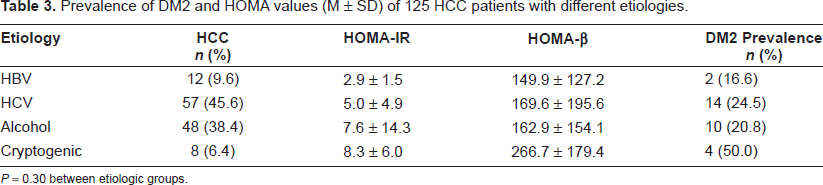
P = 0.30 between etiologic groups.
IRI and HOMA levels according to HCV genotypes and serum HCV RNA levels
In patients with Chronic Hepatitis C, no relation of HOMA-IR, IRI and HOMA-β values with specific HCV-genotypes has been demonstrated (data not shown). Moreover, analysis of variance shows that HOMA-IR and IRI values are not associated with different HCV RNA plasma levels (figures not reported).
Insulin resistance and IRI in CLD patients
Based on the values of FPG and IRI of our healthy subjects, we calculated the HOMA-IR and IRI values in our white healthy population with low-risk for diabetes mellitus. 26
The distribution of HOMA-IR values and the 80th percentile in our healthy individuals, reported in Table 4, are similar to that previously described in the Bruneck study, 26 evaluating a Caucasian population resident in an Italian area near the border of our Region. In particular, for HOMA-IR in our healthy subjects we found a value for the 80th percentile of 2.72, as compared to 2.77 in the Bruneck study.
Prevalence rates in n and (%) of CHC, LC and HCC patients, subdivided in categories of insulin resistance as defined by the limits of HOMA-IR quintiles of 113 healthy subjects.
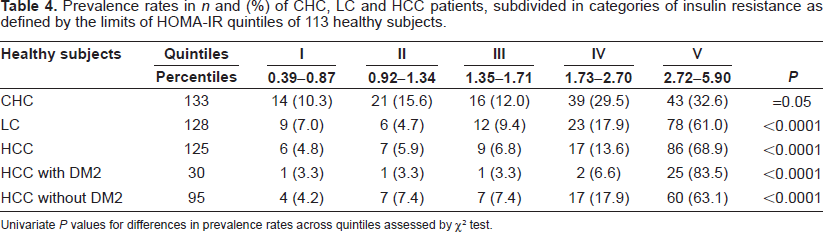
Univariate P values for differences in prevalence rates across quintiles assessed by χ 2 test.
In our healthy subjects, the HOMA-IR and IRI data distribution is right-skewed and continuous. We defined as insulin resistance and hyperinsulinism, the HOMA-IR and IRI levels above the value of 80th percentile (2.72 and 11.18, respectively), corresponding to the lower limit of the top quintile of the HOMA-IR and IRI values in our healthy subjects.
The prevalence rates of CHC, LC and HCC patients, subdivided in categories of insulin resistance as defined by the HOMA-IR and IRI quintiles of the 113 normal subjects, are reported in Table 4 and 5, respectively. In patients with CLD, the prevalence rates across quintiles increase progressively and are significantly different, as compared to the distribution of HOMA-IR and IRI in healthy subjects. Therefore, for HOMA-IR and IRI the percentage of patients in the upper quintiles are similar in LC and HCC without DM2 groups, but it is twice as much in CHC patients. The HCC group with DM2 has the greatest percentages above the 80th percentile value and the distribution in the HOMA-IR and IRI quintiles is inverted in comparison with healthy subjects.
Prevalence rates in n and (%) of CHC, LC and HCC patients, subdivided in categories of IRI (μU/mL) as defined by the limits of IRI quintiles of 113 healthy subjects.

Univariate P values for differences in prevalence rates across quintiles assessed by χ 2 test.
Discussion
Our study shows that the mean values of IRI and HOMA-IR increase progressively in CHC, LC and HCC groups. As compared to the distribution of healthy subjects, in the CLD groups the prevalence rates of patients, across the HOMA-IR and IRI quintiles, are significantly different.
The percentage of patients within the top quintile for HOMA-IR is similar in LC and non-diabetic HCC groups, and it is 2-fold than that found in CHC patients. In diabetic HCC cases, more than 80% of patients are located in the highest quintile for the distribution of HOMA-IR and IRI values. In these patients the distribution of the prevalence rates across quintiles is inverted, in comparison to that of healthy subjects. Moreover, the HOMA-IR mean values are significantly higher in diabetic HCC patients.
To identify all insulin-resistant subjects in our population and to minimize the inclusion of false-positive subjects, we used the level of the 80th percentile of HOMA-IR and IRI as cut-off values. The selection of the value of 80th percentile as the cut-off point for HOMA-IR (2.72) and IRI (11.18) levels, is in agreement with the Bruneck study, a populationbased prospective study in Italian patients on the prevalence of IR in metabolic disorders. 26 The method we used is different from the arbitrary cut-off points selected in other studies, in which has been considered as indicative of a significant IR in CHC patients HOMA-IR levels of >1.73 in Japanese 18 >2.0 Spanish 28 and >3.0 French investigations 17 and which, consequently, may have influenced the results of these studies.
The mean levels of IRI and HOMA-IR are similar in LC and HCC patients, but higher than in CHC subjects. In chronic hepatitis C patients, the IRI and HOMA-IR values are in the middle of the levels reported between healthy individuals and LC patients. In comparison with LC patients, HOMA-β levels are higher in CHC and HCC patients. In our study for the first time, as far as we know, together with the evaluation of IR, by HOMA-IR method, pancreatic insulin secretion by HOMA-β, was also evaluated. The IRI levels, their distribution and percentiles in normal healthy subjects and in CHC, LC and HCC patients were also studied. Therefore, we may assume that the concomitant increase of IRI, HOMA-IR and HOMA-β found in our patients with CLD, is a clear marker of a hyperinsulinemic state, compensatory to the insulin resistance. In addition, our data confirm that IR, and the consequent hyperinsulinemia, are characteristic features in all stages of the liver diseases and that the link between insulin and chronic liver disorders begins in the early stages of liver fibrosis and increases significantly when the liver disease advances towards cirrhosis and HCC. 29
The levels of HOMA-β, a parameter related to insulin pancreatic secretion, in CHC and HCC patients are higher than in LC patients and healthy subjects. The possible explanation is that there is a gradual decline of β-cell function in the progression of liver fibrosis to cirrhosis and, on the other hand, that the development of HCC is more frequent in the cirrhotic patients with higher levels of IR and that are still able to maintain a compensatory pancreatic insulin secretion.
Our data suggest that HOMA-IR and IRI levels in LC and HCC patients are not related to an hyperinsulinemia resulting from a reduction of insulin liver extraction by hepatic dysfunction, that could, instead, not be excluded in other previous investigations,30,31 in which pancreatic insulin secretion was not evaluated. To the contrary, high IRI plasma levels in our population are related to a hypersecretion of insulin, by a compensatory mechanism to IR, as shown by the high HOMA-β levels in our CLD patients. Moreover, HOMA-β levels are lower in HCC patients with DM2 as compared with non-diabetic HCC cases, probably due to the progressive exhaustion of β-cells function characterizing the pathogenetic mechanism of type 2 diabetes mellitus, also in CLD patients.
In patients with CLD, the number of subjects across HOMA-IR and IRI quintiles, is significantly different, as regards to their distribution in healthy individuals. Moreover, the number of CLD patients in the top quintile of HOMA-IR and IRI distribution is increasing from CHC, LC and to HCC groups. Therefore, our results show that IR and hyperinsulinemia characterize all clinical stages in CLD patients.
Some limitations could be present in our study. It is a cross-sectional study drawn from a clinical series of patients and not from the community, but patients with CHC, LC and HCC in this survey, have been accurately individual-matched by age, gender, diabetes mellitus, BMI, time of hospital admission and also according to the etiology of liver disease in LC and HCC cases. As for patients with chronic hepatitis, we only selected subjects with HCV infection, because this is the leading cause of LC and HCC in our area and IR is a common feature in patients with chronic hepatitis C. 32 Moreover, pancreatic insulin secretion was studied indirectly by HOMA-β method and not by C peptide determination. The relevance of insulin resistance and hyperinsulinemia found in CLD patients in our survey need to be directly evaluated in a prospective study.
In conclusion, as far as we know, our survey provides the first evidence that IR and hyperinsulinemia, investigated by HOMA model, are a characteristic feature of patients in all steps of the clinical spectrum of chronic liver disease, beginning from the CHC patients, where the mean values of these parameters are in the middle between healthy subjects and the levels of LC and HCC patients. Moreover, in HCC patients with type 2 diabetes mellitus, insulin resistance and IRI levels are significantly increased. As regards to their biological mechanisms, it is known that a high insulin plasma concentration could stimulate the Insulin-like Growth Factors 1 (IGF-1) pathway in DM2, and molecular studies have shown that insulin and IGF-1 may have carcinogenic effects on liver and other tissues. 33 The findings of our study suggest that insulin resistance and high plasma insulin levels may play a major role in the progression of chronic liver disease patients and may explain, at least in part, the link between type 2 diabetes mellitus and HCC. Therefore, the HOMA-IR measurement could represent a novel clinical marker to identify the CLD patients at greater risk for the progression of liver disease and carcinogenesis. Moreover, the observation that insulin resistance and high insulin plasma levels may be the link between DM2 in CLD and HCC patients, is important not only for preventive strategies but also for the therapeutic approach of diabetes mellitus in patients with chronic liver disease because they, to counteract the adverse effects of insulin resistance and hyperinsulinemia, should first attempt to achieve the metabolic control through changes in diet and lifestyle.
Statement of Interests
The authors declare that they have no conflict of interest.
Footnotes
Acknowledgments
We thank Eugenio Cervesato PhyD, for statistic assistance.