
Abstract
Background
The right ventricle (RV) has an essential function in cardiovascular physiology and pathology. Currently, it is gaining an increasing interest given its recognized role in many cardiovascular conditions. However, echocardiographic assessment of the RV in daily practice is frequently based on qualitative estimation, and it has been regarded as a neglected chamber.
Objective
We sought to review and discuss the appropriate approach and latest methods of assessment of the RV by echocardiography.
Methods
A MEDLINE/Pubmed search was performed, and 55 relevant articles were selected; articles addressing right ventricular assessment by echocardiography, along with the latest recommendations, have been reviewed and discussed.
Results
A RV diameter >42 mm at the base and >35 mm at the mid-cavitary level indicates right ventricular dilatation; a longitudinal myocardial velocity (S′) <9.5 mm/s, a tricuspid annular plane systolic excursion <17 mm, and a fractional area change <35% are indices of right ventricular systolic dysfunction. A right ventricular ejection fraction of >45% and an absolute value of global longitudinal strain of >21% reflect normal systolic function. The significance of dp/dt, the right myocardial performance index and isovolumic myocardial acceleration, is also discussed along with the parameters of right ventricular diastolic function. The use of novel echocardiographic approaches, such as three-dimensional echo and speckle tracking imaging, allows practitioners to overcome the challenges encountered with conventional echocardiography.
Conclusion
Accurate assessment of the RV by echocardiography yields early detection of cardiac diseases, enhances risk stratification, and allows timely initiation of appropriate therapy.
Introduction
For many years, the right ventricle (RV) was considered less relevant in cardiac diseases than its left counterpart, and was regarded as the neglected or forgotten chamber of the heart. However, the role of the RV in the management and prognosis of many cardiac diseases, such as congestive heart failure, arrhythmia, and sudden cardiac death, is increasingly recognized.1,2 Moreover, RV dimensions (RVD) and RV function (RVF) are closely correlated to symptom occurrence and to exercise capacity in many clinical conditions. In view of this, a comprehensive and accurate evaluation of the RV is essential. Classically, RV exploration may be achieved by right cardiac catheterization, X-ray computed tomography, cardiac magnetic resonance imaging, and echocardiography. Echocardiography is widely available, less expensive than other techniques, noninvasive, and is not associated with radiation or contrast injection. Moreover, echocardiography is a well-validated tool for a comprehensive evaluation of RVD and RVF. Nevertheless, echocardiographic imaging of the RV has inherent challenges stemming from the anatomic peculiarities of the RV, its retrosternal position, and its complex architecture. Novel modalities of echocardiography, such as three-dimensional echo (3DE) and myocardial deformation imaging by speckle tracking echocardiography (STE), provide promising tools to overcome most of the difficulties encountered with conventional echocardiography. 3
This review discusses the basic and advanced techniques of exploration of the RV by transthoracic echocardiography, and gives insights into the appropriate approach in order to provide a reliable and reproducible exam and to improve clinical outcomes in various right heart conditions.
Methods
We performed an extensive search of the literature starting from 1985, using MEDLINE/Pubmed with the search terms echocardiography, right ventricle and right ventricle; assessment. Moreover, the terms right ventricle, three-dimensional echocardiography, strain imaging, and tissue Doppler imaging were specifically searched in titles, abstracts, keywords, and conclusions of the selected articles, and thereby used as additional filters. Selected articles address mainly assessment of RV with regard to clinical outcome, rather than the pure technical feature. We analyzed 222 articles and determined that 55 articles were relevant for inclusion in the study.
Background
RVD and RVF are sometimes difficult to assess by echocardiography, owing to the complex RV structure, its retrosternal position, and the interdependency with the left ventricle (LV). The RV plays an important role in the morbidity and mortality of patients with cardiopulmonary diseases. However, there is currently little uniformity in echocardiographic approach to the RV, owing to potential lack of awareness and/or conformity with guidelines. 4
The gross anatomy of the RV differs from that of the LV, as it has a more complex geometrical form. The RV is triangular in shape and is formed from an anterior, inferior, and lateral (free) wall (RVFW); it comprises the inflow, the apex, and the outflow tract (RVOT) and, when viewed in the parasternal short axis (PSAX), the RV has a crescent shape that wraps around the LV. 5
The RV is also functionally different from the LV. Its contraction is mainly determined by longitudinal shortening due to the structural organization of the RV myocardial fibers. 6 It pumps against a lower afterload; also it has very short or absent isovolumic contraction and relaxation periods. In addition, the RV is more sensitive than the LV to both acute and chronic volume and pressure overload. 7 Of note, the RV and the LV are interdependent via the pulmonary circulation, the interventricular septum, and the pericardium.
Various echocardiographic techniques, such as the time-motion mode (M-Mode), two-dimensional echo (2DE), pulsed wave Doppler (PWD), Doppler tissue imaging (DTI), STE, and 3DE, provide valuable qualitative and quantitative data regarding RVD and RVF. When used in conjunction with tricuspid flow and pulmonary artery hemodynamics, such data allow a better understanding of the structure, function, and pathophysiology of the right heart. Of note, the essential views used for RV assessment comprise the apical 4-chamber (A4C), parasternal long axis (PLAX), the PSAX, and the subcostal views (Fig. 1). The modified A4C view obtained with either lateral or medial transducer orientation allows a RV-focused visualization.

Main views used to explore the RV: A4C view (upper left quadrant), PLAX view (upper right quadrant), PSAX view (lower right quadrant), and the subcostal views (lower right quadrant).
Methods of Assessment of the Right Ventricle by Echocardiography
Evaluation of the RV is largely carried out by echocardiography in daily clinical practice. However, qualitative estimate is common and is mainly based on visual evaluation (“eye-ball” estimate). Visual assessment allows a simple and fast evaluation of the RV and may be relevant when sonographic signal is optimal, but it requires an experienced sonographer in order to avoid pitfalls. Moreover, such a simplistic approach may be insufficient and/or inaccurate. A more objective approach that comprises both qualitative and quantitative methods is necessary, especially when the sonographic signal is suboptimal or when there is a suspicion of abnormal RVD or RVF. Of note, most of the values cited in the literature regarding RVD are not indexed to sex or to body surface area (BSA), although many data imply that indexed parameters are more accurate for RV assessment.8,9
Qualitative Assessment of the Right Ventricle
The RV comprises three compartments: the inlet, the outlet, and the apex which is highly trabeculated. The moderator band (septomarginal trabecula) connects the interventricular septum to the anterior papillary muscle. The contraction of the RV is represented by a peristaltic motion from the inflow to the outflow tract. The RV is relatively “wrapped” around the LV, and such a complex geometry renders imaging the inflow and the outflow tract in a single two-dimensional plane impossible. The initial approach is usually based on a visual estimate, allowing evaluation of the RV size and geometry. A rough estimate of the RV size is based on a comparison with the LV size, when the LV has a normal size, as follows: RV size is considered normal when it is less than two-thirds of the LV, mildly enlarged when it is more than two-thirds but inferior to the LV, moderately enlarged when it is roughly equal to the LV size, and severely enlarged when it is superior to the LV.4,5
An experienced sonographer must be capable of making an adequate qualitative assessment of RVF when the sonographic signal is adequate, staging a potential dysfunction as mild, moderate, or severe. Qualitative signs of RV dysfunction mainly address the RVFW and septal motion. Examination of the septal motion in the PSAX view at the level of the papillary muscles may help to distinguish volume from pressure overload. RV volume overload produces RV dilatation with septal flattening (D-shaped pattern) at end-diastole, whereas pressure overload produces maximal septal flattening at end-systole (Fig. 2). 10 Different views are used to assess accurately the various segments of the RV: the PLAX to assess the anterior wall of the RVOT; the basal PSAX to assess the inferior wall of the RV and the anterior wall of the RVOT; the PSAX at the papillary muscles level to assess the inferior, lateral, and anterior wall of the RV; A4C to assess the lateral wall; the subcostal long axis to assess the inferior wall; and the parasternal RV inflow view to assess the anterior and inferior walls (Fig. 3).11,12

(Left panel) Normal crescent shape of the RV. (Right panel) Dilated RV with D-shape of the LV and flattening of the septum.

The different RV segments (anterior, lateral, inferior) with the anterior segment of the RVOT displayed using different views.
Quantitative Assessment of the Right Ventricle
Right Ventricular Dimensions
The RV structure is more trabeculated than the LV structure. Also, the RV has an average wall thickness of 3-5 mm in the normal adult population; RV hypertrophy is defined as a thickness of the RVFW >5 mm (A4C view). 1 Of note, the moderator band is thin and difficult to visualize in normal subjects, whereas in patients with RV hypertrophy it becomes easily visible.
The sphericity index of the RV is estimated in the A4C view, and it is equal to the ratio of the short diameter (at the midventricular level) to the long diameter in end-diastole. This ratio is increased in RV remodeling and dilatation. The eccentricity index of the LV is calculated in the PSAX view at the papillary muscles level, and is equal to the ratio of the anteroposterior to septolateral LV diameter (Fig. 4). The eccentricity index is helpful in identifying the volume and pressure overload states, and a value >1.0 is considered abnormal. 13 Of note, the most practical linear diameter used in clinical practice is the RVd2 (mid-cavitary diameter taken in A4C view), and the upper normal limit is 35 mm (Fig. 5; Table 1).

Eccentricity index using the PSAX view;

Linear diameters of the RV measured in A4C and PSAX view.
Normal values of two-dimensional linear dimensions of the RV.

RV end-diastolic area is measured using the A4C or the modified A4C view; manual tracing is made by tracking the endocardial border at end-diastole and at end-systole, with trabeculations and papillary muscles included in the cavity. The current reference ranges for end-diastolic area, indexed for BSA and sex, are as follows: 5.0-12.6 cm2/m2 for men and 4.5-11.5 cm2/m2 for women. 9 Of note, measuring RV end-diastolic area may be challenging in cases of suboptimal endocardial demarcation and when the RV cavity is foreshortened.
Volumetric Dimensions
Calculating RV volume in 2DE requires significant geometrical assumptions and is thus prone to estimation errors; 3DE allows measurements of RV volumes without translation of diameters and areas, thereby overcoming the limitations of 2DE. 14 During measurement, it is important to manually define end-diastolic and end-systolic frames. Also, myocardial trabeculae and papillary muscles should be included in the cavity. Recent published data cited the upper normal limits of indexed RV volumes as follows: RV end-diastolic volume of 87 mL/m2 in men and 74 mL/m2 in women, and RV end-systolic volume of 44 mL/m2 in men and 36 mL/m2 in women. 9
Right Ventricular Systolic Function
The structural organization of the myocardial fibers has a characteristic complex three-dimensional arrangement: the midwall circumferential layer is poorly developed, and most of the myocardial fibers are oriented longitudinally. This ultrastructure explains why RV contraction is mainly determined by longitudinal shortening.12,15 Accurate evaluation of the systolic function of the RV is better achieved by measuring one or many echocardiographic indices, and an integrative approach using a combination of parameters is preferred. These parameters comprise the tricuspid annular plane systolic excursion (TAPSE), DTI-derived tricuspid lateral annular systolic velocity wave (S′), fractional length shortening, fractional area change (FAC), RV index of myocardial performance (RIMP), RV dp/dt and right isovolumic myocardial acceleration (IVA).1,4
Tricuspid annular plane systolic excursion
TAPSE is defined as the total excursion of the tricuspid annulus from tele-diastole to end-systole, and it is measured typically at the lateral annulus using M-mode (Fig. 6). TAPSE is a reliable, sensitive, and reproducible index for the initial diagnosis and for the follow-up of RV function. Moreover, it presents an excellent correlation with the RV ejection fraction (RVEF) as calculated with radionuclide ventriculography or magnetic resonance. 16 The normal value of TAPSE is >16 mm.4,17 Of note, TAPSE is relatively load- and angle-dependent, and is subject to cardiac translation; however, it is the least user-dependent parameter for assessment of RV function.17,18 Guazzi et al reported that the ratio TAPSE/systolic pulmonary artery pressure (SPAP) improves the prognostic risk stratification in heart failure patients when compared to TAPSE alone and a ratio <0.36 mm/mmHg predicts higher mortality in such patients. 17

Tricuspid annular plane systolic excursion (TAPSE) measured at the lateral tricuspid annulus in M-Mode.
Myocardial Systolic Excursion Velocity (S′)
DTI is useful for the assessment of both systolic and diastolic RV function. S' is obtained using the A4C view, and measurement is typically performed at the lateral tricuspid annulus or at the basal segmental level of the RVFW, using either pulsed or color DTI. Pulsed DTI is more robust than color DTI and it has a higher temporal resolution in this respect. 19 S' is one of the most reliable and reproducible methods to assess RV systolic function, and it correlates positively with RVEF as calculated by cardiac magnetic resonance. 20 The lower reference limit with pulsed DTI is set at 9.5 cm/s. 4 Of note, S' is load-dependent and requires correction when heart rate is <70 bpm or >100 bpm; correction is achieved by multiplying S' by 75 and dividing it by the heart rate (Fig. 7). 10

Myocardial systolic excursion velocity (S′) displayed with DTI using the A4C view at the lateral tricuspid annulus. E′, early diastolic filling; A′, late diastolic filling. The first systolic wave represents the myocardial isovolumic contraction (arrow).
Fractional Linear Shortening and Area Change
Fractional linear shortening is obtained by measuring the RVOT diameter at end-diastole and end-systole using the PSAX view. Reference limits are not set in the latest guidelines; however, “normal” values are reported with a wide range of standard variation (43% ± 18%).4,21 The main limitation in obtaining fractional linear shortening is the poor definition of the RV anterior wall. Also, there are no established landmarks for orienting the image axis at the level of the RVOT. FAC, calculated with the A4C view, is a more reliable parameter; it is defined as the difference between end-diastolic and end-systolic area divided by the end-diastolic area and multiplied by 100 (Fig. 8). Of note, FAC has been shown to correlate with RVEF as measured by magnetic resonance imaging, and the lower reference value is 35%.4,22

Fractional area change (FAC; left panel) and fractional linear shortening (FS; right panel).
Right Ventricular dp/dt
RV dp/dt represents the rate of pressure rise in the RV and may be used to estimate RV systolic function. Compared with dp/dt in the LV, there are less data regarding the RV dp/dt, and the measurement is therefore rarely used in daily practice. RV dp/dt is obtained by measuring the time required for the tricuspid jet to increase in velocity from 1 to 2 m/s, and normal values are >400 mmHg/s. 4 RV dp/dt is highly load-dependent; however, it correlates positively with TAPSE, and also it is useful for sequential assessment of RV function when loading conditions are expected to be identical. 23
Myocardial performance index or Tei index
The RIMP reflects both systolic and diastolic RV function. Isovolumic relaxation time (IVRT), isovolumic contraction time (IVCT), and ejection time intervals are measured using either PWD or DTI at the lateral tricuspid annulus, and RIMP is equal to (IVRT + IVCT)/ejection time (Fig. 9). Normal values are set as <0.43 by PWD and <0.54 by DTI. 4 Of note, IVRT is shortened when RA pressures are increased, and thus RIMP is known to be load-dependent.

Myocardial performance index.
Myocardial Isovolumic Acceleration
Myocardial acceleration during isovolumic contraction is obtained by dividing the peak isovolumic myocardial velocity by the time to peak velocity using DTI; IVA is typically measured at the lateral tricuspid annulus and has the advantages of being relatively a load-independent index of global RV systolic function, with a lower reference limit set at 2.2 m/s2. 4 IVA is not currently employed as a routine parameter for assessment of RV systolic function, but it has shown to correlate with the severity of illness in many conditions affecting the RV, including obstructive sleep apnea, mitral stenosis, and repaired tetralogy of Fallot (Fig. 7). 24
Right Ventricular Diastolic Function
RV diastolic function should be included in the routine evaluation of the RV, as it is a marker of early or subtle global RV dysfunction; also it often precedes systolic dysfunction.25,26 Evaluation of the RV diastolic function is mainly based on tricuspid valve inflow using PWD and on lateral tricuspid annulus motion using DTI. Moreover, abnormal right atrial (RA) area or volume and abnormal flow pattern in the hepatic veins may imply RV diastolic dysfunction. Early and late filling waves (E and A wave, respectively) are recorded by PWD, along with the E deceleration time. Also, the lateral tricuspid annulus velocity during early filling (E′) is recorded by DTI (Fig. 7). Diastolic dysfunction is graded as mild when tricuspid E/A <0.8 (impaired relaxation; type 1), moderate when E/A is between 0. 8 and 2.1 with an E/E′ >6 or diastolic flow predominance in the hepatic veins (pseudonormal; type 2), and severe when E/A >2.1 and deceleration time is <120 ms (restrictive pattern; type 3) (Table 2).4,9,27
Values of RV systolic and diastolic parameters.

Advanced/novel Echocardiographic Approach of the Right Ventricle
The majority of conventional echocardiographic methods for assessment of RVD or RVF are based on volumetric approximation of the RV. Such approaches have inherent limitations because of the complex geometry of the RV, and because most of these parameters are angle- or load-dependent. The issue of complex RV geometry is usually overcome with 3DE, and the inherent limitations related to angle or load dependency are overcome with deformation imaging using STE.
Three-dimensional Echocardiography
3DE allows a better anatomical definition of the RV compared to 2DE, including the base, the apex, and the outflow tract. Assessment of the RV with 3DE is feasible during routine standard echocardiography.28,29 Van der Zwaan et al reported that the duration of RV analysis (acquisition and off-line reconstruction) using 3DE is reasonably short, with a satisfactory quality of images. 28 Of note, 3DE of the RV is validated as the optimal technique for assessment of RV cardiomyopathy, atrial septal defect, Ebstein's anomaly, and tetralogy of Fallot.30,31
RVEF is an integrated result of the interaction between RV contractility and load, and therefore it does not directly reflect RV contractile function per se. In view of this, 3DE allows measurement of RVEF reflecting global RV systolic performance, with a better sensitivity than 2DE. RVEF as measured by 3DE is better calculated using the volumetric semiautomated border detection method, and a value >45% reflects normal RV systolic function.4,9 The main limitations to 3DE for RV assessment are poor sonographic signal and irregular rhythms.
Technically, 3DE of the RV requires a different transducer (frequency of 3-4 MHz with a volumetric frame rate of 16-24 frames/s) than the one used for conventional echocardiography, and the A4C view is the most frequently used approach. Semiautomated border detection needs to be manually adjusted, and after acquisition and display of end-diastolic and end-systolic frame, long axis, planes, and volumetric data of the RV may be analyzed offline. A variety of axial cuts (cropping planes) can be obtained at the apex, mid and base of the RV, whether in the sagittal or coronal planes. Volumetric calculation is achieved via the method of disks or via the mesh shell technique. Curves of regional and global RVF are produced and analyzed; RV end-diastolic volume, RV end-systolic volume, and RVEF are generated. 32 Accepted normal values of RV end-diastolic volume as stated by recent guidelines 30 are 129 ± 25 mL for men and 102 ± 33 mL for women (Fig. 10).

Three-dimensional RV reconstruction. End-diastolic frame (upper left panel); end-systolic frame (upper right panel); mesh shell image showing end-diastolic frame (lower left panel). The volume time curve displayed in the lower right panel.
In summary, the intrinsic ability of 3DE to directly visualize RV geometry and measure RVD and RVF without the need for geometrical assumption has resulted in significant improvement in the evaluation of the RV. This advantage was demonstrated in both accuracy and reproducibility when compared to other reference techniques, such as radionuclide ventriculography or magnetic resonance imaging.29,32
Speckle Tracking Echocardiography
The use of deformation imaging implies a great progress in echocardiography, as it allows assessment of segmental myocardial specific motion (ie, longitudinal, radial, and circumferential motions; twist and rotation). However, global longitudinal strain (GLS) is the most practical and useful parameter for RV assessment by STE. 33 STE overcomes most of the limitations inherent in conventional echocardiography, given that it is independent of cardiac translation; also it is angle- and load-independent, thus allowing accurate quantification of regional and global myocardial function. 34
Technically, RV systolic longitudinal strain and strain rate are assessed in the A4C view using STE, which enables a real-time tracking of the frame-to-frame myocardial motion. To derive 2D strain values, the displacement of the speckles relative to each other is compared throughout the cardiac cycle. Classically, RV myocardium is divided into six segments, the lateral and septal RV wall are each divided into basal, middle, and apical segments. Regional strain and strain rate values are generated, and GLS of the entire RV is derived and expressed as mean ± standard deviation. 33 Because of the paucity of data, no reference limits were established in the latest guidelines 3 ;however, Kannan et al reported that a GLS >25% allows the prediction of RVEF >50% with a sensitivity of 81%. 35
STE is particularly useful for the diagnosis and management of various right heart diseases, such as right heart failure, pulmonary artery hypertension, arrhythmogenic right ventricular dysplasia, and congenital heart disease. 35 Guendouz et al reported that an absolute GLS value below 21% in patients with congestive heart failure identifies patients with high risk of adverse cardiac events. 36 Similarly, in patients with pulmonary arterial hypertension (PAH), a GLS <19.4% allows identification of patients at high risk of adverse cardiovascular events.37,38 Moreover, myocardial deformation imaging using 3D STE is useful to determine timing of peak systolic strain in different ventricular segments, therefore allowing a more accurate analysis of myocardial dyssynchrony (Fig. 11).39,40

Speckle tracking imaging showing deformation imaging curves of the RV divided into six segments.
Other Parameters Relevant to Right Ventricular Assessment
For a comprehensive assessment of the RV by echocardiography, an evaluation of RA size and pressure, tricuspid flow, and pulmonary artery pressure is crucial given the interactive role of these parameters with the RVD and RVF. 4
Right Atrial Dimensions and Pressure
Quantification of RA size is usually performed using the A4C view. The minor diameter extends from the lateral border of the RA to the interatrial septum and the major diameter extends from the bottom of the RA to the tricuspid annulus. Upper reference limits are 4.4 and 5.3 cm, respectively (Fig. 12). The upper reference limit for RA area is 18 cm2 measured by 2DE at the end-systolic frame, 4 and the reference values of indexed RA volume are 25 ± 7 mL/m2 in men and 21 ± 6 mL/m2 in women. 9 Of note, RA size is correlated with clinical outcomes in PAH. 41 RA pressure is estimated by measurement of the diameter of the inferior vena cava in the subcostal view, and normal diameter as measured at end expiration is between 1.5 and 2.1 cm. 4 A diameter <2.1 cm that collapses more than 50% with a sniff suggests a normal RA pressure (range, 0-5 mmHg), a diameter >2.1 cm that collapses less than 50% with a sniff suggests high RA pressure (~15 mmHg), and in indeterminate cases where the diameter and collapsibility do not fit such patterns, an intermediate value of 8 mmHg is adopted.4,42

Right atrial linear dimensions.
Tricuspid Regurgitation
Tricuspid regurgitation is considered physiological when it is minimal, and this is present in almost all subjects. However, when it is moderate or severe, it becomes pathological and is commonly correlated with RA/RV structural or functional abnormalities. 43 Regurgitant jet area correlates roughly with tricuspid regurgitation severity: a jet area of <5 cm2 reflects mild regurgitation, between 6 and 10 cm2 reflects moderate regurgitation, and >10 cm2 reflects severe regurgitation. Also, a vena contracta width >6.5 mm is typically associated with severe regurgitation. 43 Grading the severity of tricuspid regurgitation and identification of its type (functional vs organic) are crucial for monitoring and managing right heart diseases. Tricuspid regurgitation flow is most commonly used to evaluate SPAP when no intrinsic organic valve disease is present. Difficulties in assessment of tricuspid regurgitation are commonly related to poor sonographic signal, and in such cases a search for indirect signs of increased SPAP may be performed 10 ; these indirect signs are outlined in the next section.
Pulmonary Artery Pressure
Pulmonary artery hypertension is defined as a mean pulmonary artery pressure >25 mmHg. 44 Of note, SPAP as measured using the tricuspid regurgitation peak velocity is only an estimate and cannot be considered an accurate measurement of SPAP. 45 In view of this, it is important to consider other surrogates to estimate SPAP when judged necessary. The use of pulmonary flow acceleration time should be considered when the tricuspid flow is not reliable or cannot be measured, and a value <105 ms is suggestive of PAH. Other echocardiographic parameters or surrogates may suggest PAH, and they are better used in the context of an integrated approach to estimate SPAP. These parameters include indexed RA volume >34 mL/m2 in men and >27 mL/m2 in women, RV FAC <32%, LV eccentricity index (end-systole or end-diastole) >1, RV IVRT >75 ms, and TAPSE <16. 10 Of note, the pulmonary Doppler flow envelope may give insights into the origin of PAH; a mid or late systolic notching is typically encountered in PAH associated with pulmonary vascular disease (pre-capillary PAH) (Fig. 13). 46
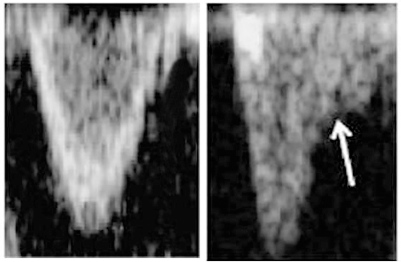
Notching (arrow) of the pulmonary spectral flow (right panel).
Clinical Implications and Insight into the “Right way” to Explore the Right Ventricle
Echocardiographic evaluation of the RV is far from perfect, and there is currently no single echocardiographic parameter reliable enough to be universally accepted. Operators should be aware that when assessing RVD and RVF during everyday clinical practice, all echo modalities have their pitfalls. In order to proceed via the “right way” to examine the RV, the sonographer should first conduct the echocardiographic examination with regard to the clinical context. Multiple acoustic windows should be used, and the examination must be based on an integrative approach using both qualitative and quantitative parameters. Of note, a comprehensive examination of the RV may be time consuming, and a case-by-case decision is made by experienced sonographers with regard to the extent of the required echographic parameters in order to yield a relevant assessment. Particularly, the challenges encountered with conventional echocardiography may be overcome with the use of newer echocardiographic techniques, such as 3DE and STE. 3
RV assessment by echocardiography has practical applications particularly in patients with acute cardiac conditions, such as pulmonary emboli, acute heart failure, cardiogenic shock, cardiac tamponade, and acute valvular dysfunction. 47 Interestingly, TAPSE was found the least user-dependent and most reproducible parameter in patients with pulmonary embolism. 18 Moreover, Sosland et al described a distinct echocardiographic finding (McConnell's sign) in patients with acute pulmonary embolus, represented by akinesia of the mid RVFW and normal motion at the apex. 48 Descotes-Genon et al reported that GLS is significantly reduced in patients with intermediate- to high-risk pulmonary embolism as compared to GLS in patients with low-risk pulmonary embolism. 49
Cardiac toxicity related to chemotherapy remains an important side effect of anticancer chemotherapy, and early detection and management of cardiac injury is crucial. In this context, STE has been shown to reliably detect early preclinical abnormalities in both RV and LV function. 50 Tumuklu et al found that GLS of the RV is significantly decreased in hypertensive individuals, and concluded that STE is a new tool that allows identification of subtle changes in systolic RVF in systemic hypertension, even without PAH, which could not be determined by standard echocardiography. 51 Similarly, Hilde et al reported that patients with chronic obstructive pulmonary diseases exhibit signs of RV dysfunction at an early stage as assessed by STE, even before development of PAH. 52 Alpendurada et al found that significant RV dysfunction is a predictor of nonresponse to cardiac resynchronization therapy, and therefore accurate RV assessment may guide the selection of patients before implementing such a complex therapy. 53
Herein, most data were described as related to transthoracic echocardiography and at rest; additional approaches comprise contrast and/or transesophageal echo. Also stress echo is a valuable tool in patients who manifest suspicious symptoms at exercise that may be related to stress-induced RV dysfunction. 54 In addition, patients who manifest suspicious symptoms at exercise that may be related to stress induced RV dysfunction may require stress echocardiography in this context. 55 These techniques vary in complexity, and every echo laboratory must consider the options to implement the necessary approach according to the clinical context.
Conclusion
At present, a single and widely accepted echocardiographic approach to assess the RV is not available. Accurate assessment of the RV requires the use of multiple acoustic windows and/or multiple echocardiographic techniques. In all echocardiographic studies, it is better to perform a comprehensive examination taking into account all available clinical information. Also, the exam should provide an assessment based on both qualitative and quantitative evaluation. 3DE and STE allow the sonographer to overcome the challenges encountered with conventional echo, as these novel techniques yield important diagnostic and prognostic information. The ability of these novel approaches to directly monitor RV myocardial function may allow early sensitive detection of subclinical myocardial dysfunction, with better risk stratification and timely institution of therapy.
Author Contributions
Analyzed the data: AK. Wrote the first draft of the manuscript: AK. Contributed to the writing of the manuscript: AK. Agree with manuscript results and conclusions: AK. Jointly developed the structure and arguments for the paper: AK. Made critical revisions and approved final version: AK. The author reviewed and approved of the final manuscript.
Footnotes
Acknowledgments
The author would like to express his full consideration to Pr Gilles Grollier and Pr Sami Succar for their scientific comments and valuable contribution in writing this paper.