
Abstract
T1 mapping is now a clinically feasible method, providing pixel-wise quantification of the cardiac structure's T1 values. Beyond focal lesions, well depicted by late gadolinium enhancement sequences, it has become possible to discriminate diffuse myocardial alterations, previously not assessable by noninvasive means. The strength of this method includes the high reproducibility and immediate clinical applicability, even without the use of contrast media injection (native or pre-contrast T1). The two most important determinants of native T1 augmentation are (1) edema related to tissue water increase (recent infarction or inflammation) and (2) interstitial space increase related to fibrosis (infarction scar, cardiomyopathy) or to amyloidosis. Conversely, lipid (Anderson–Fabry) or iron overload diseases are responsible for T1 reduction. In this pictorial review, the main features provided by native T1 mapping are discussed and illustrated, with a special focus on the awaited clinical purpose of this unique, promising new method.
Introduction
The ability to discriminate between T1 and T2 tissue contrast is a unique strength of magnetic resonance imaging. In the past years, new pulse sequences, achievable through breath-hold, were developed, aimed at providing clinically feasible parametric images in which each pixel directly corresponds to the T1 or T2 value of cardiac tissues. 1 Regarding T1 mapping, the MOLLI sequence described in 2004 by Messroghli et al. 2 and the faster ShMOLLI sequence 3 developed by the group of Oxford constitute a real breakthrough, offering robust, fast, and practical quantification of T1 tissue values, immediately available on the scanner console, circumventing the influence of windowing, without a need for manual postprocessing. Such a change from visualization to quantification has been described as a true “revolution” of cardiac magnetic resonance (CMR), 4 reducing the subjectivity encountered in traditional nonquantitative techniques and providing the ability to differentiate between “normal” and “affected” myocardium. T1 mapping may be performed before (pre-contrast or native T1, reflecting composite water signal from extracellular space and myocytes) but also after contrast media injection (allowing determination of extracellular volume fraction). In this review, we thought to summarize the most salient results obtained with native T1 mapping and to illustrate the potential clinical utility of this technique through a series of cases. Since pre-contrast T1 will only be considered here, the expression “T1” will be used to mean native, pre-contrast T1 in the following paragraphs.
Normal native myocardial T1 values measured with MOLLI at 1.5 T lie between 900 and 1100 ms, but depend on several technical and physiological parameters. In particular, from 1.5 to 3.0 Tesla field, T1 augmentation was reported to be between 14% and 28% greater. In this article, all presented images were obtained with the basic MOLLI sequence of the Siemens Tx-mapping WIP780, on a 1.5 T Aera scanner. Reported T1 values result from myocardial region of interest (ROI) tracing (being careful to exclude the blood pool as well as the epicardial fat). For the purpose of comparison with published data, mean normal myocardial T1 value determined in our center was 1032 ± 39 ms.
The longitudinal relaxation time T1 is increased in (1) edema resulting from myocardial injury or inflammation, cellular edema, myocyte necrosis and (2) in the case of extracellular space expansion induced by amyloidosis infiltration or by fibrosis, either focal (replacement fibrosis, infarct scar) or diffuse (interstitial fibrosis increased in hypertrophic cardiomyopathy [HCM] and dilated cardiomyopathy [DCM]). Thus, T1 increase is ubiquitous and the use of other complementary imaging sequences such as T2-STIR and late gadolinium enhancement sequences (LGE) is mandatory (summarized in Table 1), as well as interpretation within the clinical context. On the other hand, main causes of T1 reduction include fatty infiltration (lipomatous metaplasia), intracellular sphingolipids overload (Anderson–Fabry), and iron overload diseases. The order of magnitude for the most important T1 alterations recently published is listed in Table 2.
Signal behavior according to different kinds of myocardial diseases.

Range of native T1 values in various pathological conditions.

Edema
Area at risk and salvaged myocardium after acute infarction
In 1983, Higgins et al. 5 demonstrated in dogs that the percentage of water content in an acute myocardial infarction (MI) is approximately 4% greater than that in normal regions and that T1 and T2 values in the area of infarction are greater than those of normal myocardium. This focal T1 increase in water content is related to cellular destruction (infarct core) and to surrounding interstitial edema and may last up to one or two months after acute infarction. 6 In the case of edema, Ferreira et al demonstrated that T1 mapping was significantly more sensitive than STIR-T2, 7 and in the setting of experimental acute infarction, Ugander et al showed that both T1 mapping and T2 mapping were similarly sensitive to tissue edema and are closely correlated with the area at risk as assessed by microsphere in animal study. 8 As it can be seen in Figure 1, in the area of acute MI identified by LGE, the T1 increase is in the range ≈+20% vs remote myocardium (see Table 2). Edema-related T1 elevation over several standard deviation (SD) above normal values allows for the identification of acute MI with sensitivity and specificity >90%.9,10 LGE appears less extensive than increased T1 area but is more specific to myocardial necrosis. The difference between the area at risk (T1 increase) and necrosis (LGE, with a smaller size) corresponds to the salvaged myocardium. In the clinical study of Dal'Armellina et al. 11 , the diagnostic performance of T1 mapping was similar to that of T2-prep sequence (similar extension of salvaged myocardium). Moreover, T1 mapping seems to be more robust (better reproducibility) than T2-weighted imaging, and increased T1 values have a prognostic significance (weaker segmental function improvement at 6M). The surface area of abnormal myocardium may be visually estimated and manually drawn but this method is prone to subjective over- or underestimation; thus more “objective” criteria, not operator-dependent, should be used, such as pixel count lying over a cut-off value (eg, >3 SD of the mean normal values). 9 T1 area smaller than LGE area may be observed if imaging is performed too late after the acute event, in the case of poor slice co-localization (misregistration) or in the case of subendocardial infarction.

Two examples of acute MI.
In the case of no-reflow with microvascular obstruction in the infarct core, a pseudo-normalization of T1 values is observed10,11 (Fig. 2A), and T1 is even more decreased in the case of hemorrhage (Fig. 2B), owing to methemoglobin accumulation. 12
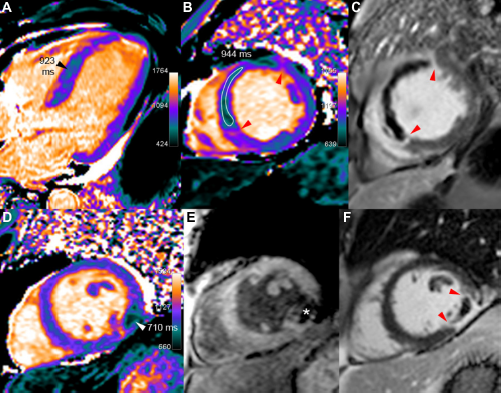
Acute MI with no-reflow and with hemorrhage.
Myocarditis and Tako-tsubo syndrome, as well as recent infarction, include an area of edema leading to a focal area of increased T1 and T2 (see Table 2). In acute myocarditis (Fig. 3), this abnormal area is co-localized with regions of LGE13–15 because of associated cellular destruction; in contrast, no associated LGE is seen in Tako-tsubo 7 as illustrated in Figure 4. Interestingly, beyond focal lesions, diffuse increase in myocardial T1 values, although of lower magnitude, is also observed in acute conditions as compared with healthy myocardium7,11,13–15 (cf: Table 2). This is particularly salient in cases of acute myocarditis, where the inflammatory process may be diffuse rather than discrete. In this setting, using ShMOLLI at 1.5 T, T1 mapping with a cut-off value of 990 ms offers optimal sensitivity (90%) and specificity (88%) as compared with T2-STIR and LGE imaging. Moreover, the T1 threshold approach is able to diagnose extra cases with small focal islands of myocardial injury, not detected by T2-STIR and LGE imaging.13,15

Acute myocarditis in a young 22-year-old male with troponin i rise up to 34 and recent history of gastro-enteritis. T1 map (

Tako-tsubo syndrome, in a 74-year-old female who presented an anaphylactic shock during orthopedic surgery, requiring the administration of adrenalin, followed by heart failure (EF 40% with anterior-apical dyskinesia). At the time of imaging, 11 days after the acute event, systolic dysfunction has almost disappeared with mild persistent segmental hypokinesia, but anterior distal myocardial edema remains still visible on both T1 (
Myocardial inflammation related to several other diseases, not yet systematically studied up to now, may also provide focal or diffuse increase in T1 values. Systemic disorders that affect the heart, such as sarcoïdosis, lupus erythematosus, and systemic sclerosis, are known to induce tissue edema at the acute stage with elevated T2 (and T1) values. 16 In these cases, T1 quantification may be useful to identify cardiac involvement (leading to therapeutic implications) and help assess a prognosis. 17 T1 mapping also seems to have the potential to depict early rejection of transplanted hearts, as shown in Figure 5, which may obviate the need for more invasive endomyocardial biopsy, particularly in the case of primary graft dysfunction. 18

A 67-year-old patient with heart transplantation 5 years ago, presenting clinical and histologic signs of acute rejection. LV volumetric (70 mL/m2) and ejection fraction (60%) are preserved and LGE does not show significant abnormality but T1 mapping demonstrates definitely elevated T1 values (in the range of 1160 ms, ie, +12% or +3.2 SD as compared with normal T1 values in healthy subjects). Moreover, a small nodular of even higher T1 increase (approx. 1400 ms) is seen in the anterior-basal wall. Concomitant T2 elevation (62 ms) suggests an inflammatory process rather than a diffuse interstitial fibrosis.
Fibrosis
Fibrosis, which constitutes a common and final pathway in several cardiac diseases, may be discrete, focal (scar), or diffuse (uniform interstitial process).19–21 Expansion of the collagen matrix increases the volume of distribution (approximately from 20% to 30%), leading to combined pre-contrast T1 augmentation and greater gadolinium uptake (shorter post-contrast T1). Thus, focal lesions are assessable by both T1 mapping and LGE techniques. In contrast, in the case of diffuse, uniform T1 alteration, LGE is no longer able to depict abnormal patterns, since no relevant contrast is revealed between one region and another. In this case, T1 mapping circumvents the influence of windowing and reveals its strength, allowing a direct T1 quantification.
Focal replacement fibrosis (scar) in chronic MI
In the chronic stage of MI, edema resolves and is replaced by increased extracellular collagen (fibrous scar). The large area, initially identified with elevated T1 in the acute stage of infarction (edema), is replaced by a smaller area of scar tissue. This phenomenon may explain why both the magnitude and the extent of focal T1 increase are reduced when compared to the acute stage. 9 However, even 6 months after infarction, some reports showed persistent edema (concomitant T2 increase), which could also account for T1 increase in chronic infarction. 22 At 1.5 T, as seen in Figure 6, infarction demonstrated by LGE is seen incompletely on T1 maps and the rate of infarct scar identification was reported to be only 57%, 23 particularly in cases of subendocardial lesion. In contrast, at 3 T, an experimental study in dogs demonstrated that T1 can accurately determine location, size, and transmurality of chronic MI, just as well as LGE. 24 Similarly, a clinical study conducted in post-infarction patients with low mean ejection fraction (39%, synonymous of large infarction) showed that T1 mapping was able to detect chronic scar tissue caused by chronic MI with 95% sensitivity and 97% specificity, suggesting that accurate diagnosis could be reliably assessed even without LGE imaging, 25 but this preliminary report needs to be confirmed.

Chronic inferior-lateral Mi partially depicted by native T1 mapping. Fibrous infarct scar appears as a limited residual area of mildly elevated T1 values in the T1 map (
Another added benefit of T1 mapping in old infarcts, illustrated in Figure 7, is a better view of lipomatous metaplasia, with noticeable T1 decrease in the fatty replacement area located within the infarct core.10,22

Chronic lateral infarction with lipomatous metaplasia. In this 50-year-old patient with previous lateral infarction 5 years ago, T1 mapping (
Diffuse interstitial fibrosis, cardiomyopathy
Myocardial fibrosis is composed of increased deposits of extracellular collagen associated with extracellular matrix expansion. Unlike replacement fibrosis, interstitial fibrosis may be reversible and is a target for treatment (eg, aldosterone). 17 Histological markers of fibrosis have been shown to correlate with increased myocardial stiffness and impaired diastolic function, which are in turn associated with clinical vulnerability and adverse outcome. 17 In recent years, a major interest in T1 mapping has focused on the significant correlation between the degree of fibrosis and increased T1 relaxation time.17,19–21 Reported correlations between histological collagen volume fraction determined from biopsy samples obtained during surgery for aortic valve replacement and T1 were good, with r = 0.65 26 and r = 0.78. 27
In patients with cardiomyopathies, heart failure, or aortic stenosis, four studies found significant myocardial T1 increase (presumably related to interstitial fibrosis) when compared to controls (cf: Table 2), but one other work (performed in heart failure patients) found a not significant +2% T1 increase. 28 Puntmann et al reported the strongest difference with ≈+16% T1 increase in the septum. This T1 increase was correlated to left ventricular (LV) remodeling and systolic dysfunction in DCM patients and was correlated to LV mass index in HCM patients. 29 Comparison of area under the curve (Receiver operating characteristic (ROC) analysis) showed that native T1 provided the best distinction between controls and patients with cardiomyopathy (as compared with post-contrast T1). Bull et al reported a +7% T1 augmentation in patients with aortic stenosis. 26 T1 increase was less pronounced in the studies of Dass et al. 30 (≈+3%, with changes being borderline if using ROI excluding LGE-positive regions) and of Lee et al. 27 (+3.4% in patients with aortic stenosis). In fact, fibrosis involvement, visually perceivable as specific hyper-enhanced foci in HCM (Fig. 8) or quantified as a diffuse process on T1 quantification in DCM (Fig. 9), seems to appear inconstantly on T1 maps. The imperfect concordance between native T1 mapping and LGE imaging for detecting focal replacement fibrosis may be explained by the distinct significance of both imaging methods, since LGE (as well as post-contrast T1 mapping) reflects only extracellular space whereas native T1 mapping reflects a composite of both intra- and extracellular compartments. 30 Imperfect identification of diffuse fibrosis in cardiomyopathies, with large inter-individual overlap between patient groups, probably results from the limited magnitude of T1 alterations in some fibrotic tissue at 1.5 T or even at 3 T, which may be better discriminated with improved sequences or at higher field strength. 30

Apical HCM in a 40-year-old man. T1 mapping (

A 62-year-old male with DCM and left bundle branch block (LVEDVI 135 mL/m2, EF 25% and normal coronary angiography). Small scattered slightly increased T1 areas are seen in the T1 map (
Several other diseases involving diffuse myocardial fibrosis and impaired diastolic function may reveal increased myocardial T1: diabetic cardiomyopathy, systemic or pulmonary hypertension, chronic renal disease, valvular heart disease, arrhythmogenic right ventricular cardiomyopathy, atrial fibrillation, and adult congenital heart disease. 31 In patients with stable systemic lupus erythematosus, T1 increase (+9%), attributed to fibrosis rather than edema, was the best parameter to separate normal subjects from lupus patients. 32 In patients with long standing systemic sclerosis (SSc) but without clinical sign of cardiac involvement, a +5% T1 increase was found as compared with controls. The volume fraction of T1 >990 ms (cut-off for detection of edema with ShMOLLI at 1.5 T) was 52% (vs 3% in controls). These T1 abnormalities were considered to represent a combination of low-grade chronic inflammation and diffuse myocardial fibrosis. 33
Infiltrative, overload, and other cardiac diseases
Even before the advent of T1 mapping, systemic light-chain (AL) amyloidosis was recognized as a typical etiology of markedly elevated myocardial T1 values. 34 In a series of 53 patients with biopsy-proven AL amyloidosis, Karamitsos et al demonstrated that T1 values correlated well with markers of systolic and diastolic dysfunction and were 19% higher than those in healthy subjects, with minimal overlap between groups. 35 This was concordant with the presence of typical LGE pattern or with abnormal myocardial to blood pool signal suppression pattern indicative of diffuse myocardial infiltration (Fig. 10). In patients with transthyretin cardiac amyloidosis, T1 elevation was not found to be as high as in AL amyloidosis (+13% and +17%, respectively), but the area under the ROC curve was similar in both conditions (0.85 and 0.84, respectively). 36 The great advantage of T1 mapping here is to be assessable even in patients with severe renal impairment precluding gadolinium chelates injection. Other foreseen advantages of T1 quantitation, as continuous metrics rather than a “binary” visual diagnosis provided by LGE, lie in the possible estimation of a patient's prognosis and possible interesting tools for treatment monitoring. 37
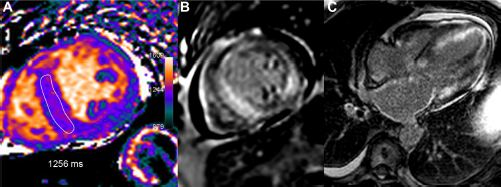
A 66-year-old male with AL amyloidosis, heart failure, and marked restrictive echocardiographic pattern. T1 map (
In contrast to previous causes of T1 increase, the London Heart Hospital group reported marked T1 lowering in two kinds of pathologies, both accessible in specific therapy: Anderson–Fabry (Fig. 11) and iron overload diseases. Fabry disease is a rare but underdiagnosed lipid disorder with accumulation of intracellular glycosphingolipids. Mean septal T1 was reduced by 9% in these patients, and interestingly T1 reduction allowed for an efficient discrimination between Fabry disease and several other causes of left ventricular hypertrophy, with no overlap. T1 correlated inversely with wall thickness and was abnormal in 40% of subjects even without left ventricular hypertrophy (LVH). 38 In the case of post-gadolinium contrast enhancement in the postero-lateral wall (a typical feature of this disease), T1 pseudo-normalization or augmentation was focally observed (effect of replacement fibrosis exceeding the fatty-related T1 decrease).
A 64-year-old female with Anderson–Fabry disease. The septum thickness is increased, up to 17 mm (left ventricular mass index 95 g/m2). Myocardial T1 is uniformly low (in the range of 900 ms, as seen on five-chamber and short axis slices in
According to the same authors, cardiac iron overload (in transfusion-dependent patients, mostly including thalassemia major) seems to induce even greater T1 reduction. In these patients, T1 was reduced by −14% and T1 strongly correlated with T2* (r = 0.79). No patient with low T2* had normal T1, but 32% of patients with normal T2* (>20 ms) presented T1 lowering beyond 2 SD.39,40 Similar results and similar correlation between T1 and T2* (r = 0.83) were reported by Feng et al. 41 , indicating that T1 can be used reliably to assess myocardial iron and that T1 may help plan and monitor ironchelating treatments.
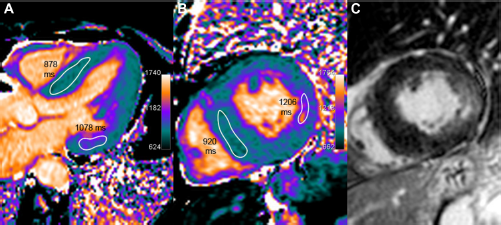
Finally, aside from previously enumerated myocardial alterations, it is interesting to know that the order of magnitude of T1 values in adipose tissue (paracardiac fatty fringes, lipoma) and in pericardial effusion (Fig. 12) is, respectively, less than 500 and greater than 2000 ms (depending on chemical composition and shorter for protein-rich transudate or abscesses as compared with transudate). Apart from ischemia and cardiomyopathies, T1 mapping reports are scarce for other pathological conditions such as cardiac masses, thrombi (Fig. 12), or tumors (Figs. 13 and 14), but case reports have been published for myxoma, 42 calcified mitral pseudocyst, 43 and lipomatous hypertrophy of the atrial septum. 44

Two apical thrombi (maximal long axis 16 mm) are seen at the apex of the left ventricle in this 69-year-old patient with large apical dyskinesia following LAD occlusion. Native T1 values in the thrombus are lower than myocardial T1 values (

Large inferior-lateral mass (25 mm thick) in a 21-year-old female with atypical symptoms. T1 mapping shows strongly increased T1 values in this tumor, similar to the blood pool T1 values, in the range of 1354 ms, ie, +31% or +8.3 SD vs remote normal septum. Concomitant high T2 signal pattern (

Left atrial myxoma in a 60-year-old female. In the T1 maps (
Conclusion
At present time, pre-contrast T1 mapping has not yet become the “non invasive biopsy” mentioned by Kramer. 45 However, T1 mapping is already a useful tool for daily diagnostic in several conditions such as amyloidosis, Fabry, and iron overload diseases. Moreover, several reports suggest that in the future, it might become possible to rely on native T1 mapping instead of LGE imaging for accurate diagnosis of myocarditis and acute or chronic MI, particularly in patients with severe renal impairment precluding gadolinium contrast injection. Tissue characterization in subclinical cardiac injury involving diffuse fibrosis is another awaited clinical application, but overlap remains quite large with normal T1 values. T1 mapping is evolving rapidly and still requires methodological standardization. Objective quantification of abnormal myocardium with threshold-based T1 analysis (areas of injury) will probably help this highly reproducible and minimally operator-dependent technique to better define the prognosis and contribute to monitoring therapy in various myocardial diseases.
Author Contributions
Conceived and designed the experiment: PG, SE. Analyzed the data: PG, SE. Wrote the first draft: PG. Contributed to the writing: SE, MJ. Agree with results and conclusions: PO, EE, CR, AG. Developed structure and arguments: PG, SE, MJ. Made critical revisions: PG, SE, MJ. All authors reviewed and approved of the final manuscript.
Footnotes
Acknowledgments
Authors thank the team of developers of the Siemens Quantitative Cardiac Parameter Mapping (WIP780): B Spottiswoode, A Greiser, C Glielmi, S Giri and R Kroeker and Mrs Ninon Teissier for English editing.